Headlines
- Autodesk Forms Inverse Head-and-Shoulders
- Quest Diagnostics Hits New High
- Leonardo DRS Breaks Short-term Resistance
- MercadoLibre Goes for a Breakout
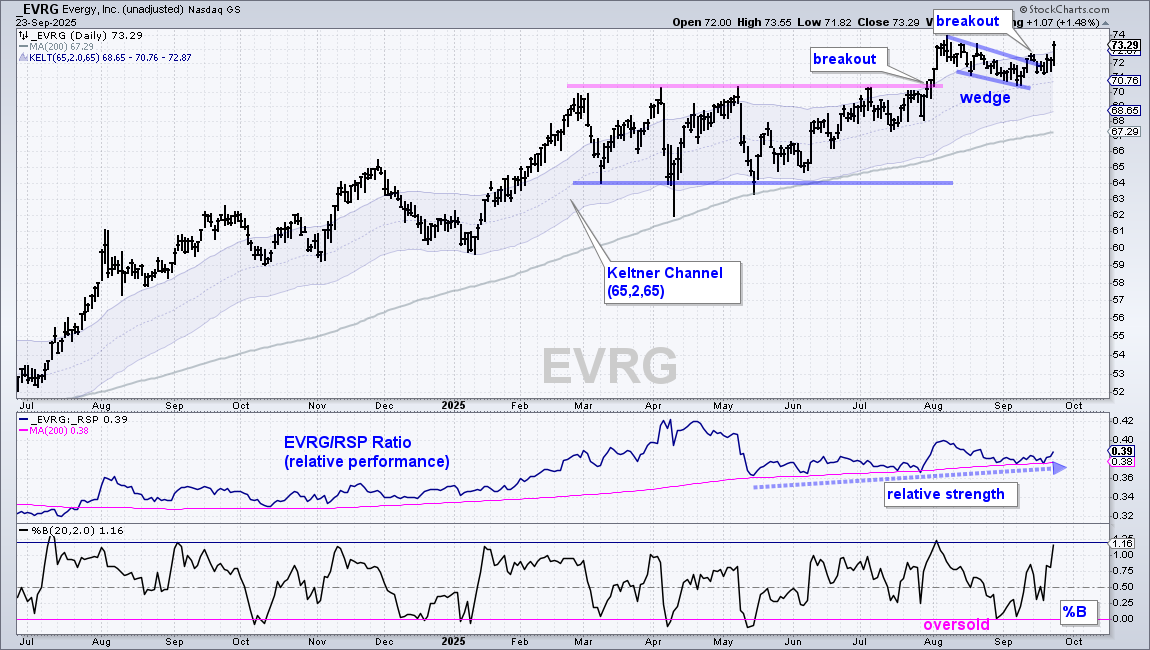
- Four Utility Stocks with Breakouts: AEE, CNP, ETR, EVRG
I will update the Market Regime page laser today.
Today’s report features two stocks with leading uptrends, two stocks with short-term breakouts and four utility stocks with breakouts. Most of these stocks come from strong areas of the stock market: software, defense and utilities. Quest Diagnostics is part of the Healthcare sector, which is lagging the broader market. Mercado Libre is an ecommerce giant in Latin America. Today’s stocks are: ADSK, DGX, MELI, DRS, AEE, CNP, ETR and EVRG.
Autodesk Forms Inverse Head-and-Shoulders
Autodesk (ADSK) is part of the Software ETF (IGV). It has been a bumpy ride since late November, but the stock tagged a 52-week high in early September as a large inverse head-and-shoulders formed. There are two types of head-and-shoulders patterns: continuation and reversal. I view the current pattern as a big consolidation after a run from 200 to 330 in 2024, which makes it a continuation H&S. A breakout would score a 52-week high and put the stock in uncharted territory (clear uptrend). Short-term, ADSK surged after earnings and consolidated with a pennant, which is a short-term bullish continuation pattern. A breakout would also project a move to new highs.
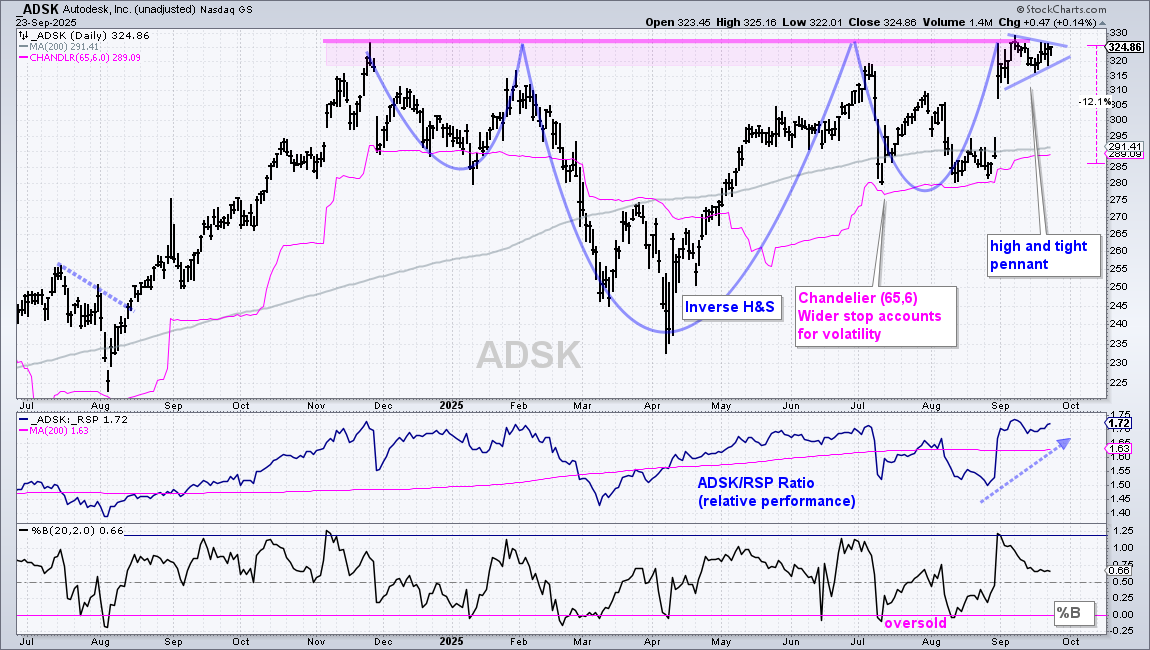
As far as stops are concerned, I am showing the Chandelier Exit (65,6). Sometimes a slightly wider stop is needed to absorb volatility shocks (see early July 2025 and early August 2024). Instead of 5 ATR(65) values, this version is 6 ATR(65) values below the 65-day high. At current levels, a stop-loss triggered on a close below the Chandelier Exit (65,6) would be around 12%, which is on the high side. Chartists looking for a better risk/reward ratio can put this stock on their watchlist and wait for a tradable pullback or short-term oversold condition.
Quest Diagnostics Hits New High
Quest Diagnostics (DGX) provides diagnostic services and equipment to the Healthcare sector. The Healthcare SPDR (XLV) is lagging the broader market, but DGX is leading with a series of new highs this year. Most recently, DGX surged in August, formed a pennant into September and broke out this week.
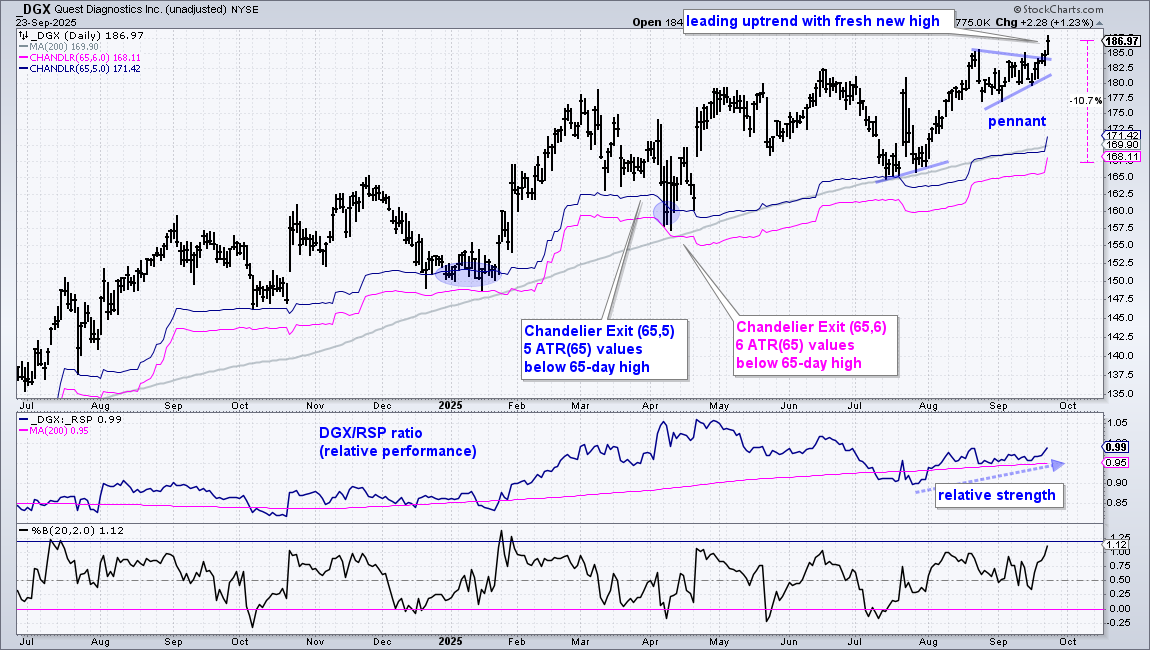
This chart shows the Chandelier Exit (65,5) in blue and the Chandelier Exit (65,6) in pink. Notice that the (65,5) version triggered stops in December-January and April (blue ovals). In contrast, the (65,6) version did not trigger and held throughout the uptrend. Sometimes we need to test different versions to find the best fit for a particular stock. The Chandelier Exit (65,6) is around 11% below the current price. As with ADSK above, this is on the high side for risk. Chartists looking for a better risk/reward ratio can put this stock on their watchlist and wait for a tradable pullback or short-term oversold condition.
Plan your Trade, Trade your Plan and Diversify
There are two ways to approach these short-term setups.
First, trade them as swing trades. A falling flag or wedge breakout is bullish and this signal remains valid until a break below the re-evaluation level, which is usually the low just before the breakout. For short-term trading, I usually set a profit target and close one third to one half of the position when this target is reached. A trailing stop is then placed to ensure that the entire trade does not result in a loss.
Second, use short-term setups to participate in the bigger uptrend. Bullish setups stem from short-term oversold conditions, falling wedges/flags or pullbacks. Instead of a re-evaluation level, the exit signal is based on a long-term trend change and a trend-following exit. Signals include a cross below the 200-day SMA, a major support break, a Chandelier Exit or a Keltner Channel break. This means the potential loss will be larger, but there is also a possibility to take part in an extended uptrend.
Thus, plan before making the trade, and then trade according to that plan. Also consider position sizing and diversification to spread the risk.
Leonardo DRS Breaks Short-term Resistance
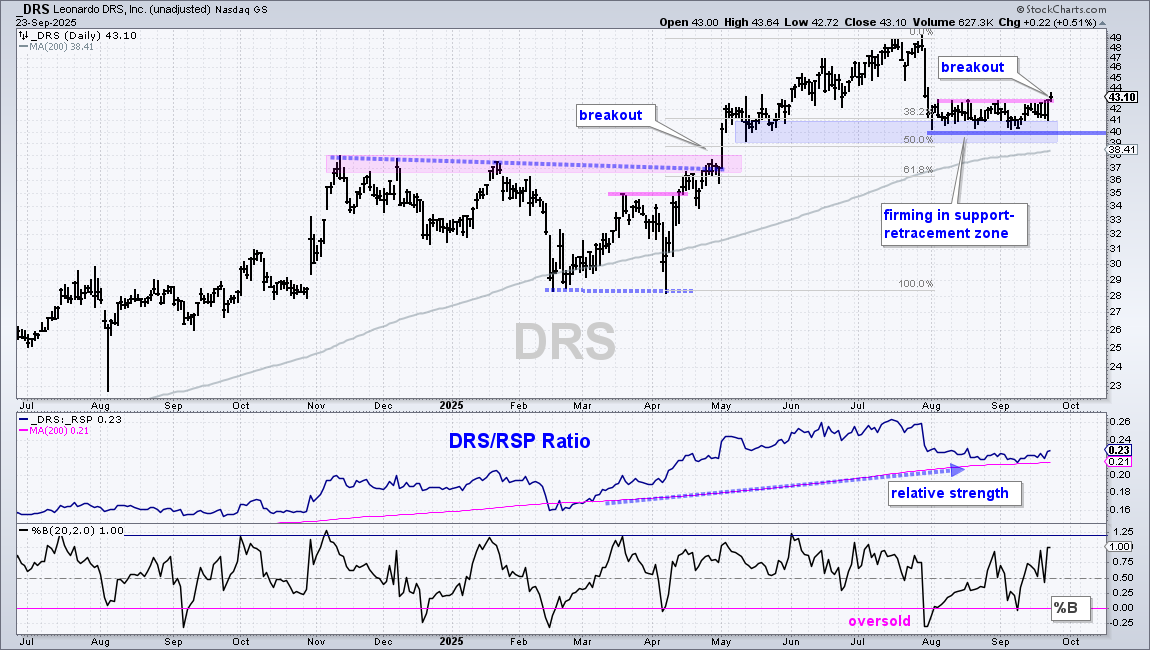
Leonardo DRS (DRS) is a drone maker that is part of the Aerospace & Defense industry. The stock is in a long-term uptrend with a big breakout in early May and new highs in June-July. The stock took a tumble in late July with a decline to the low 40s, but held well above the rising 200-day SMA. Overall, DRS is firming in a bullish setup zone marked by support and retracements. The May lows mark support in the 39-41 area and this zone also marks a 38-50 percent retracement of the April-July advance. The advance was two steps forward and the decline was one step backward. DRS broke resistance at 43 on Tuesday and this is the first sign of increased buying pressure. The stock defended the 40 level from early August to September. A break below 40 would show an increase in selling pressure and argue for a re-evaluation. Note that DRS was first featured on September 3rd.
Mercado Libre Goes for a Breakout
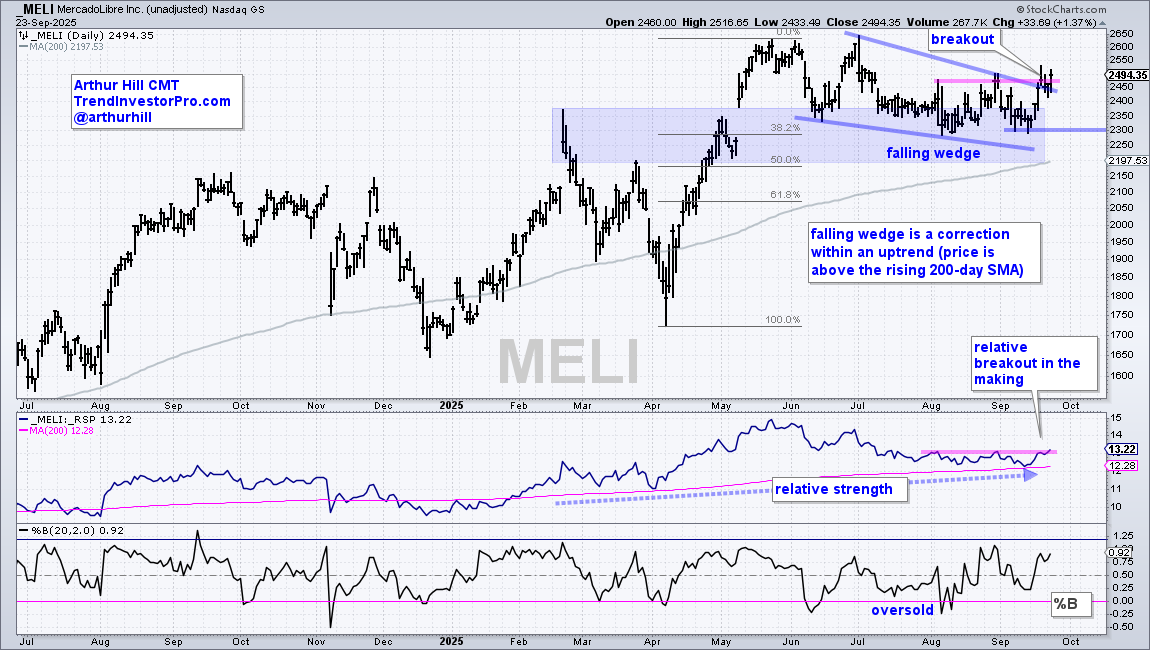
Based in Uruguay, Mercado Libre (MELI) provides ecommerce services in Latin America. This stock was first featured on August 27th. Sometimes it takes a while for setups to turn into breakouts. First and foremost, MELI is in a long-term uptrend with a new high in May and price well above the rising 200–day SMA. The stock corrected from June to September with a falling wedge that returned to the breakout zone, which turns into support (blue shading). This area also marks a 38-50 percent retracement of the April-May advance. Taken together, the support area and the retracements mark a Bullish Setup Zone, which is an areas to watch for firming and a breakout. There are signs of firming since mid early August as the stock held support in the 2300 area. Also note that %B became oversold in early August and a falling wedge formed. MELI broke out with a surge above resistance. This signals an end to the correction and a resumption of the bigger uptrend. Re-evaluation support is set at 2300.
4 Utility Stocks Breaking Out
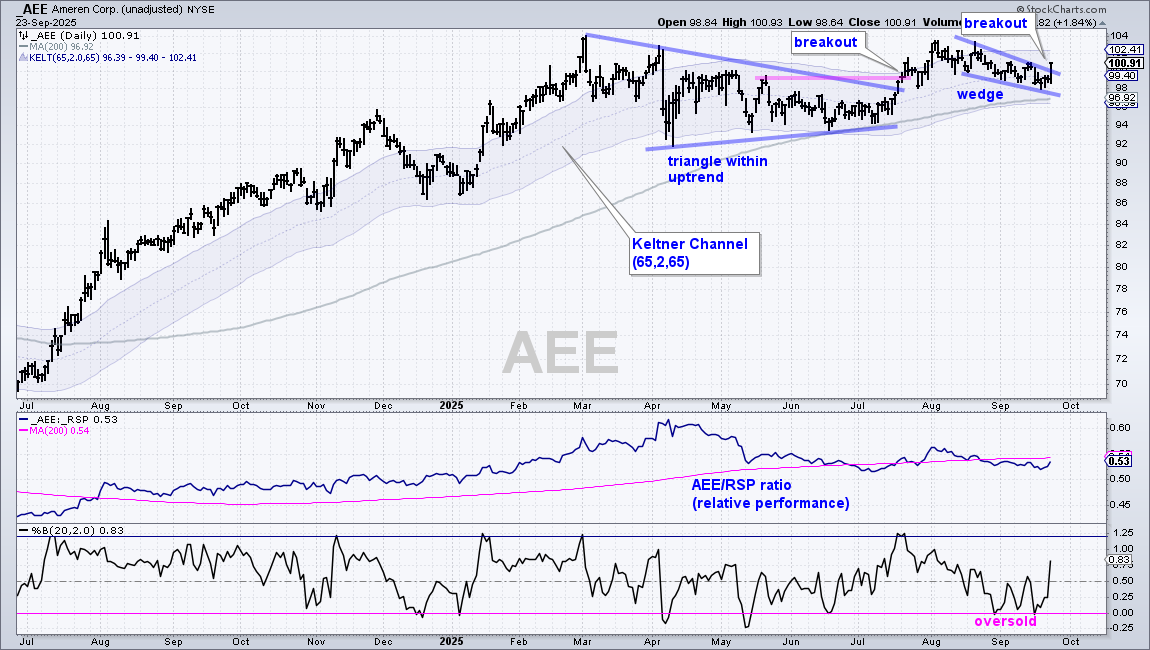
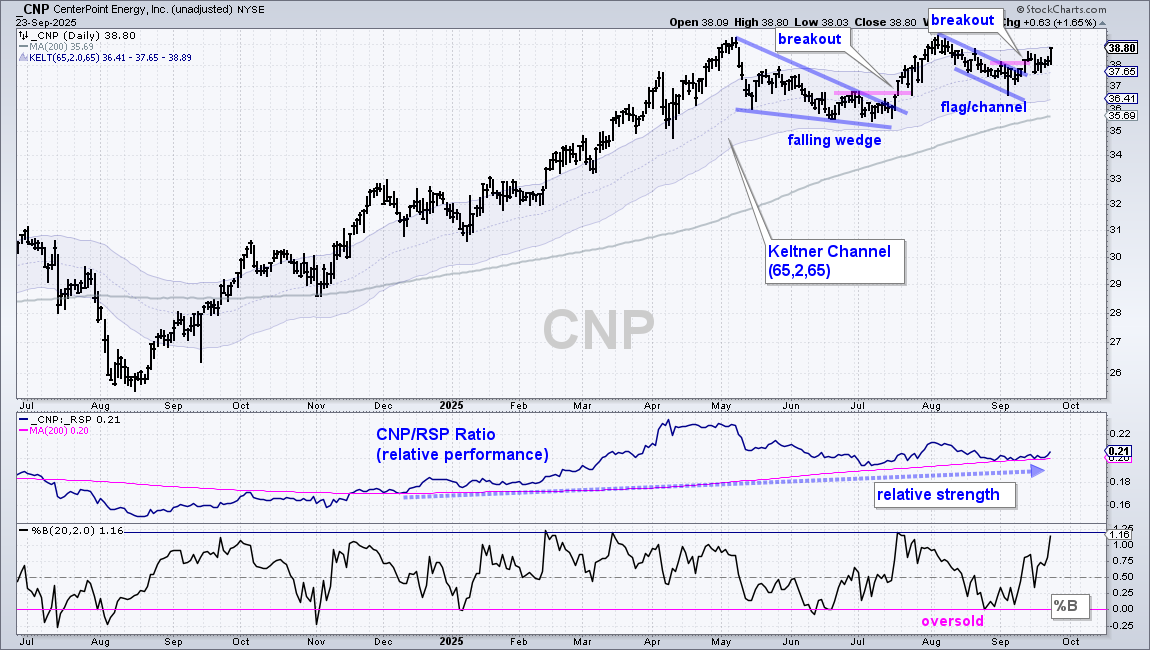
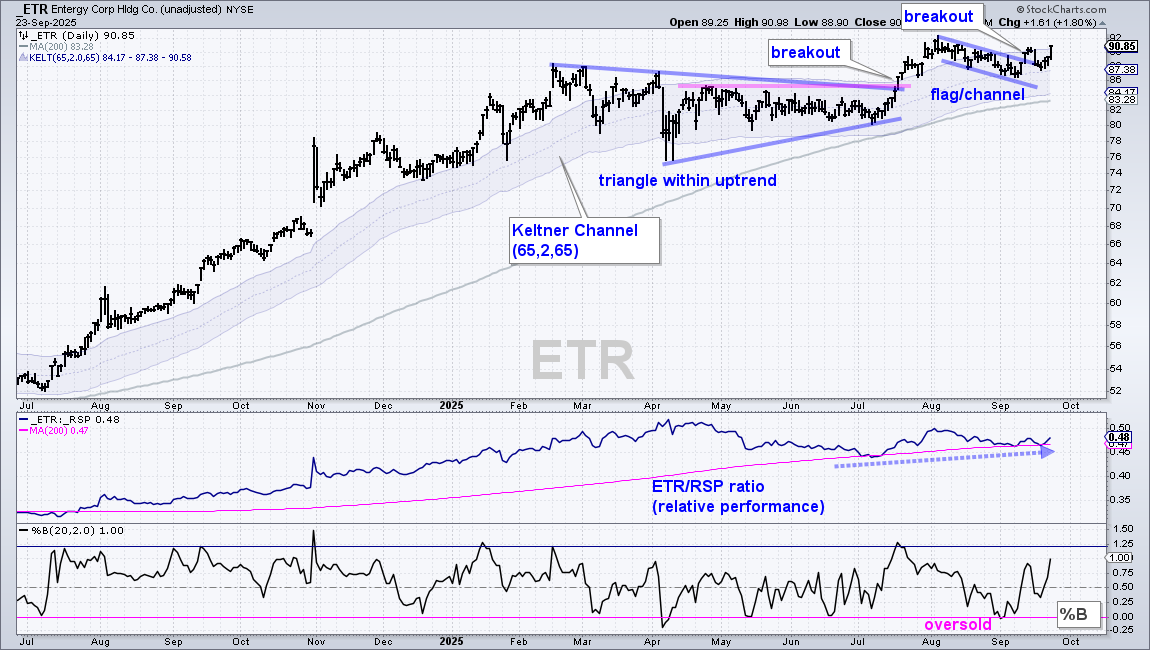
The Utilities SPDR (XLU) was regularly featured since mid August as it corrected within an uptrend. XLU reversed its short-term pullback with a breakout on September 10th. Stocks in the utilities sector are positively correlated, which means they move in the same direction. This correlation is high because this is a very homogeneous group. The next charts highlight utility stocks with long-term uptrends and short-term breakouts.
Instead of the Chandelier Exit, I am showing the Keltner Channels (65, 2, 65) to define the long-term trend and trend-following exit. Note that both indicators use the Average True Range (ATR), which makes the similar. The middle line of a Keltner Channel is a 65-day EMA and the outer lines are 2 ATR(65) values above/below the middle line. A break below the lower line would signal the start of a downtrend. I am also showing the 200-day SMA (gray line) for reference.
DISCLAIMER: This content provided strictly for informational and educational purposes. It should not be interpreted as an offer to buy or sell any security, nor as a solicitation to engage in any investment activity. Nothing here constitutes a recommendation regarding any specific security, portfolio, transaction, or investment strategy.
At times, the author or affiliates may hold positions or interests in securities discussed. Any stocks or examples mentioned are not endorsements or suggestions to purchase. This material does not consider your individual financial goals or circumstances, and you should seek guidance from a qualified financial or investment adviser before making any trading or investment decisions.
Past performance does not guarantee future results.
Send feedback to support(at)trendinvestorpro.com or use the contact form.