Systematic Strategies and Next Level Technical Analysis
Gold/Copper Wind Up – Miners Hit New Highs – Uranium in Play – Bitcoin Sets Up
Arthur Hill, CMT
Archive
Alternative ETFs
Use CRTL+P to Print
Headlines
7-10Yr TBond ETF Extends on Breakout
Inflation-Protected Bonds Lead Normal Bonds
Gold Remains in consolidation as Silver Breaks Out
Gold and Silver Miners Extend to New Highs
Copper ETF Stalls with Tight Range
DB Base Metals ETF Holds Upswing
Physical Uranium ETF Turns Back Up
Bitcoin ETF Tests Support from Prior Breakout
The next report/video will be on Tuesday morning (1-Sep)
Today’s report starts with the 7-10Yr TBond ETF, which is extending higher after its June breakout. Despite this strength, inflation appears to be an issue because the Inflation-Protected Bond ETF is stronger. Attention then turns to metals with gold in a bullish consolidation and miners hitting new highs. Base metals are holding up with copper consolidating in a tight range. There is a breakout signal in Uranium and Bitcoin is setting up with an oversold support test.
7-10Yr TBond ETF Extends on Breakout
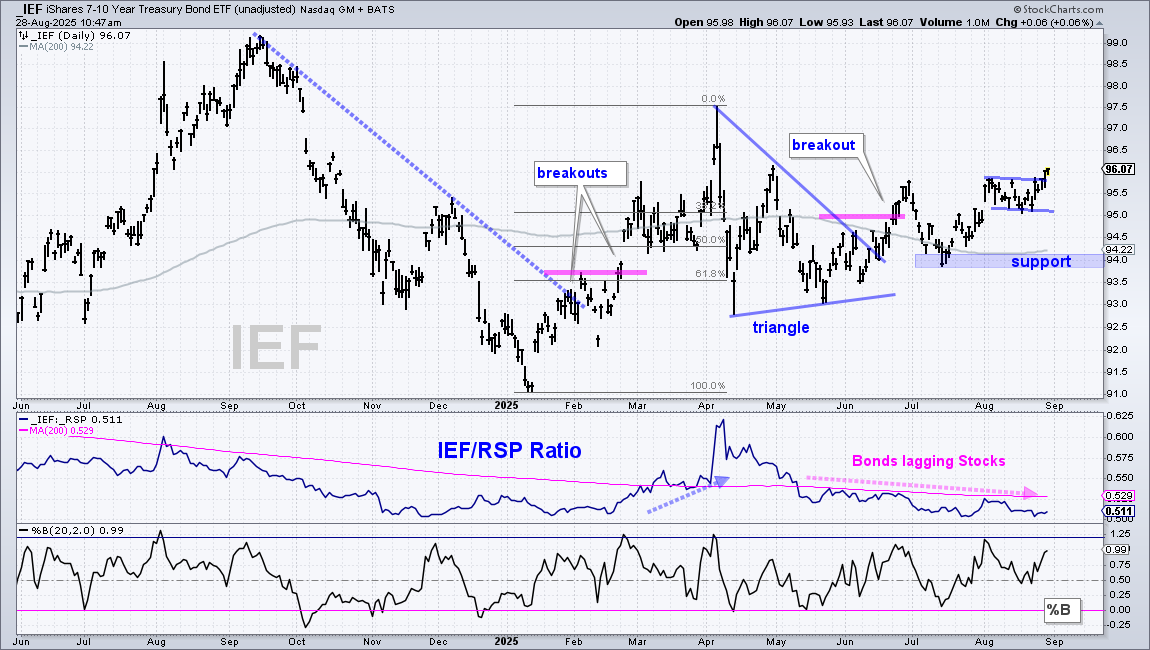
There is no change in the 7-10Yr TBond ETF (IEF) as it extends on its June breakout. This safe-haven asset has gone nowhere for over a year so I am focused on the medium-term price swings. Most recently, IEF surged in the first quarter, corrected in the second quarter with a triangle and broke out in late June. The triangle represents a rest after the Q1 surge and the breakout signals a continuation higher. The July low marks a support zone in the 94 area (blue shading). I will remain bullish until a close below the July low.
Inflation-Protected Bonds Lead Normal Bonds
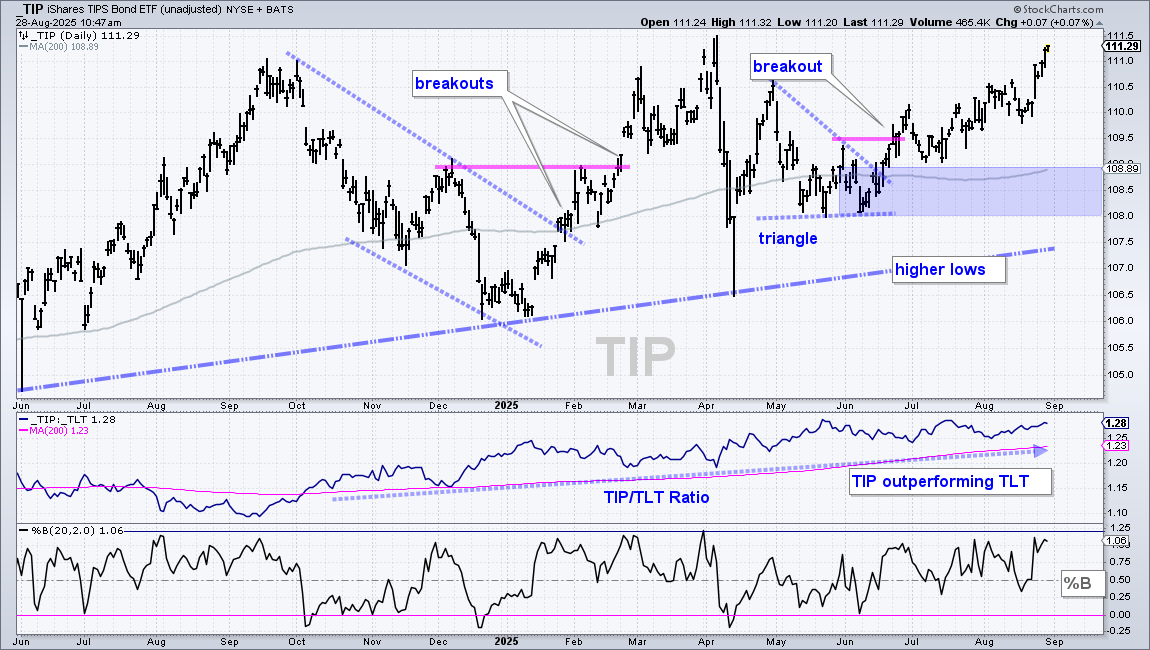
The 0-30Yr TIPS Bond ETF (TIP) is much stronger than the 7-10Yr TBond ETF (IEF) and the 20+Yr TBond ETF (TLT) . TLT, for example, is still below its falling 200-day SMA. TIP is above its rising 200-day SMA and in a strong uptrend. This means inflation-protected bonds are outperforming normal bonds, which means inflation is still an issue. TIP broke out in June and extended higher after this breakout. It recorded a new closing high in August and remains in a leading uptrend. The middle window shows the TIP/TLT ratio moving above its 200-day in October as TIP started to outperform. This ratio is still rising as TIP continues to outperform.
Gold Remains in consolidation as Silver Breaks Out
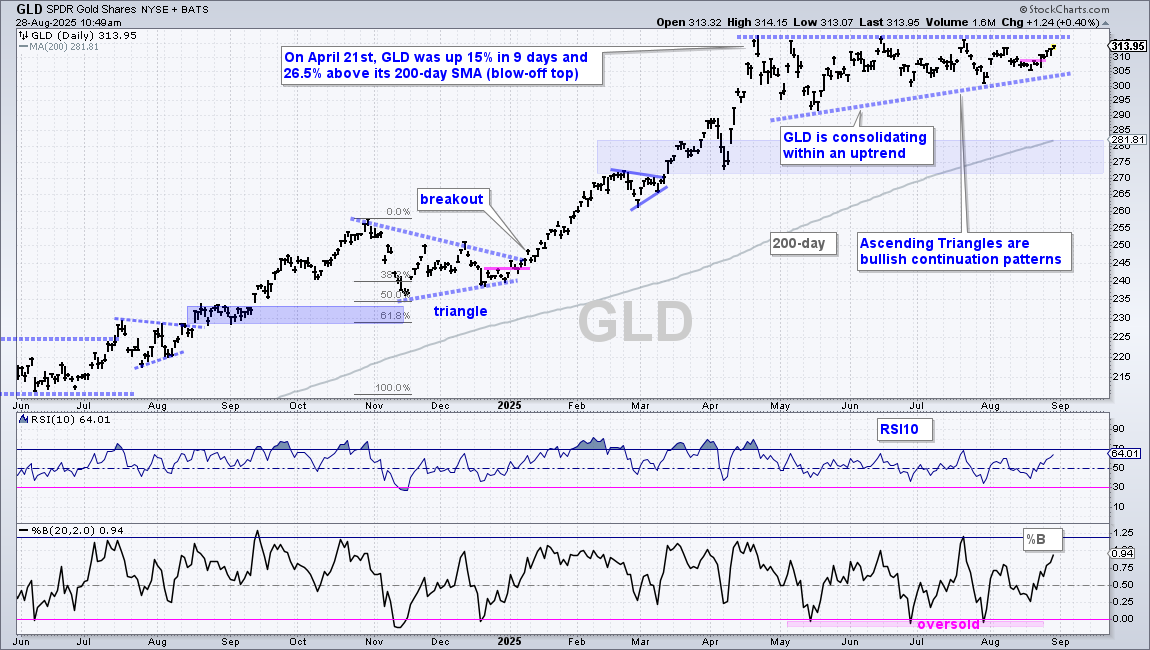
There is no change in the Gold SPDR (GLD). The long-term trend is up with a new high in April. GLD became extremely overbought in April and moved into a consolidation with an Ascending Triangle taking shape. This consolidation is working off overbought conditions and paving the way for the next move. Ascending Triangles are bullish continuation patterns that represent a rest within the uptrend. A breakout at 320 would be bullish. Within the pattern, prices fell in mid August and then turned up the last six days. This upswing within the pattern increases the chances for a resistance challenge and breakout.
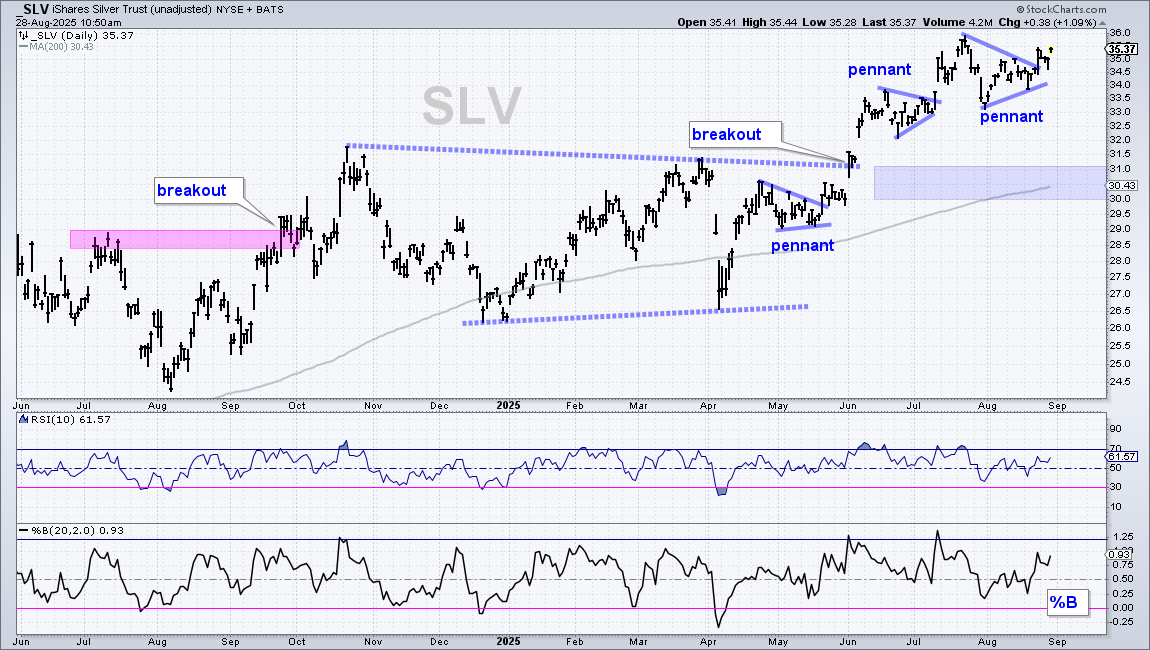
The Silver ETF (SLV) is stronger than GLD because it extended higher from May to July. SLV consolidated with a pennant taking shape and broke out with a surge last Friday. Pennants are short-term continuation patterns that take their bias from the prior move, which was up. The breakout at 35 signals a continuation higher and opens the door to new highs. Long-term, I am marking support in the 30-31 area (rising 200-day SMA).
Gold and Silver Miners Extend to New Highs
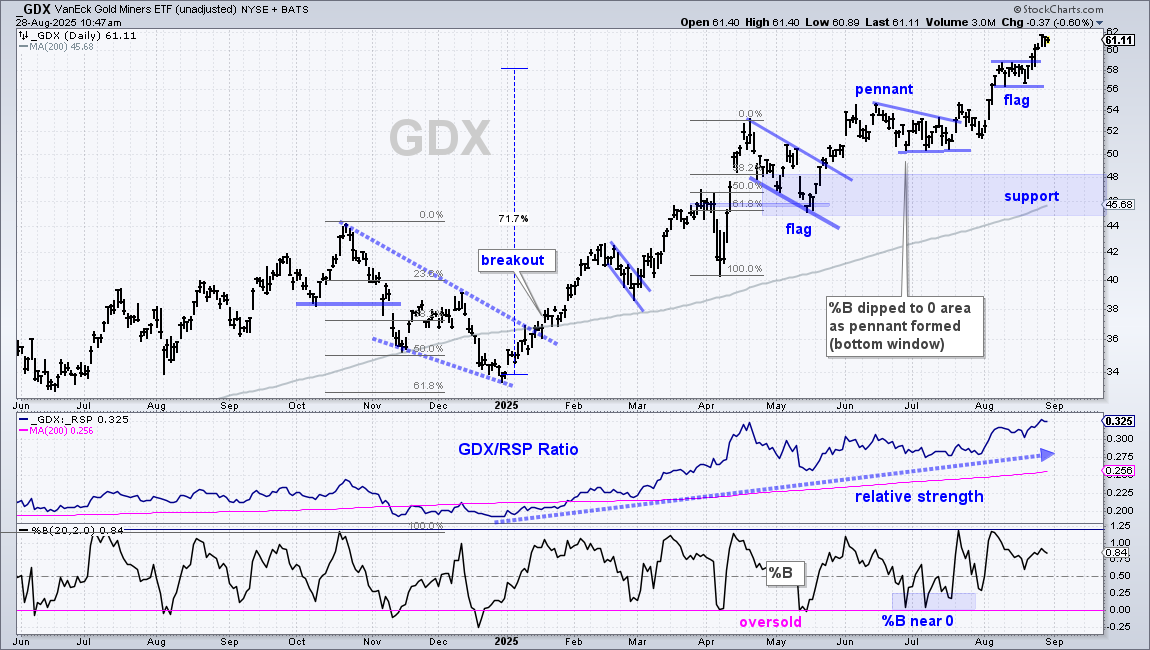
The Gold Miners ETF (GDX) continues to lead the metal with new highs in June, July and August. GDX is clearly in a leading uptrend with price well above the rising 200-day SMA and the price-relative (GDX/RSP ratio) hitting a new high in late August. Short-term, GDX surged from 52 to 59 in early August (five days), consolidated with a high/tight flag and broke out last week. The ETF continued higher after this breakout and shows no signs of weakness. Long-term support is set in the 44-48 area, but will be raised in the next week or two.
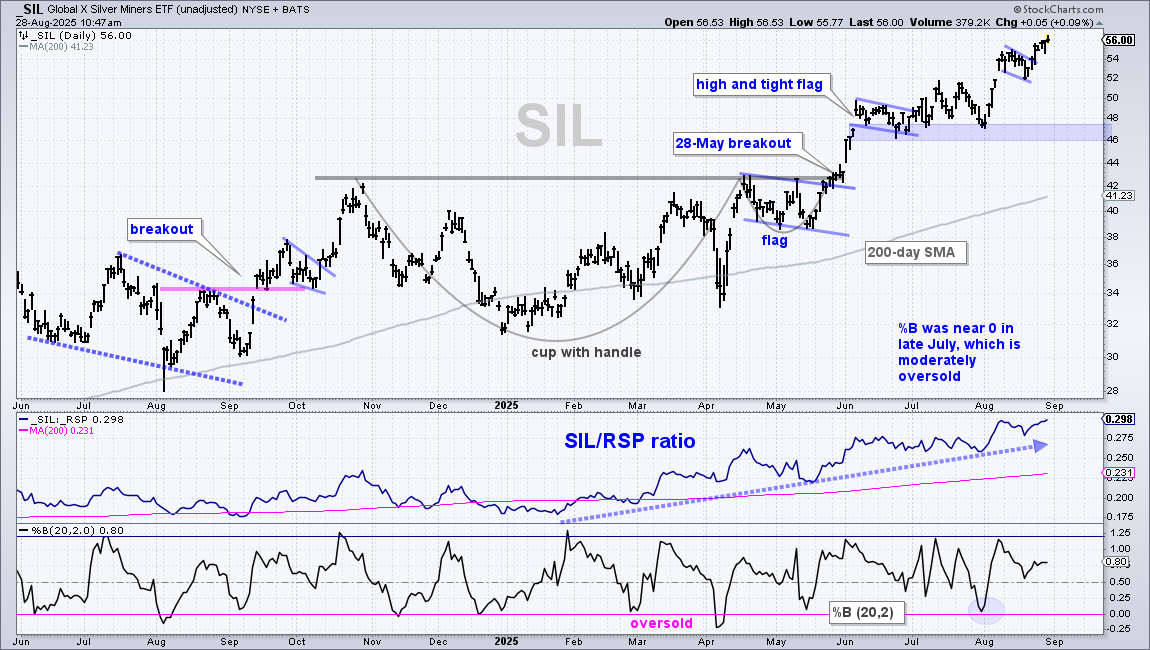
The Silver Miners ETF (SIL) is keeping up with a big breakout in late May and early June, and new highs throughout June, July and August. Short-term, SIL surged in early August and pulled back with a small pennant. The ETF broke out last Friday and continued to new highs this week. Support is set in the 46-48 area.
Copper ETF Stalls with Tight Range
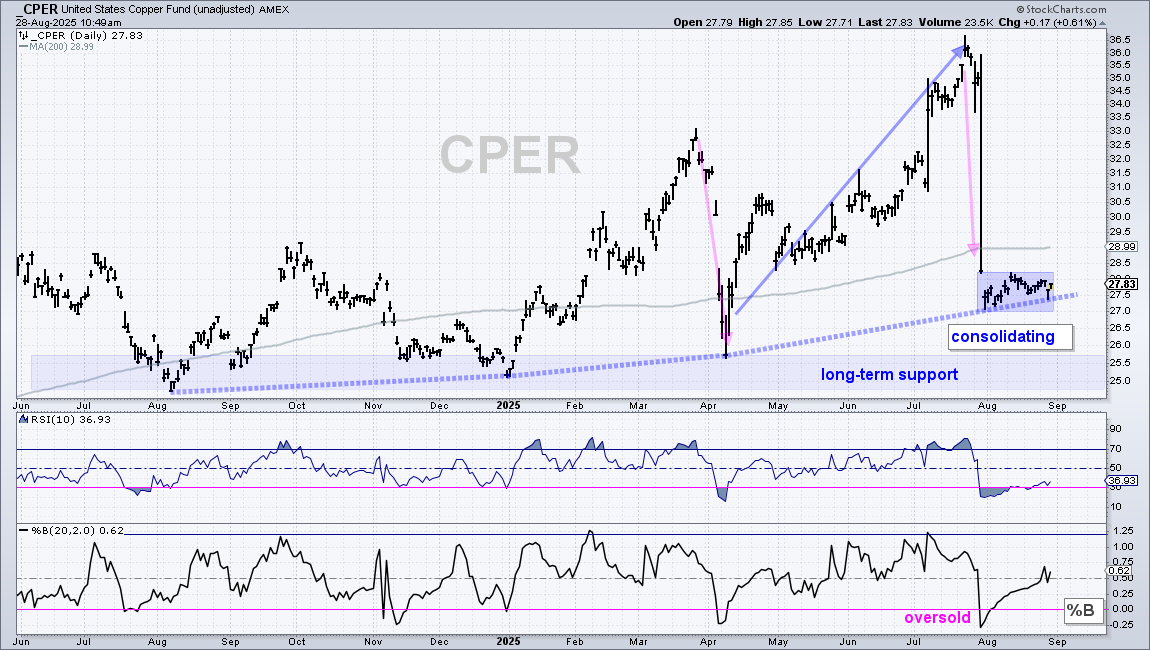
After three big swings in the last six months, the Copper ETF (CPER) is quieting down with a tight trading range in August. The dashed trendlines mark higher lows from August to December, December to April and April to August. There is also a ton of support in the 25-26 area and CPER was extremely oversold at the end of July. Recent firming confirms support in the 27-28 area. I am now watching for an upside break. A move above the mid August high would show buying pressure returning and could foreshadow the next directional move.
DB Base Metals ETF Holds Upswing
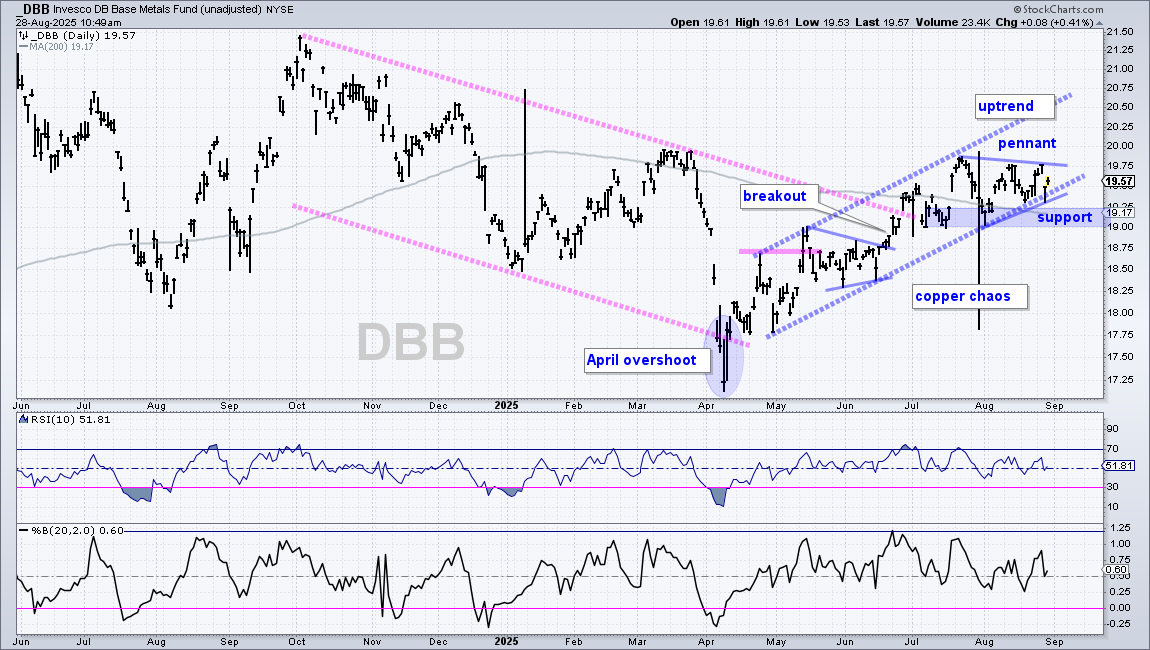
The DB Base Metals ETF (DBB) reversed with the rest of the markets in early April and worked its way higher the last 4-5 months. And I do mean work. The upswing started with the June breakout in the 18.75-19 area. The dashed blue lines define this upswing with support marked in the 19-19.25 area (blue shading). A pennant formed the last four weeks and a breakout at 19.80 would signal another continuation higher.
Physical Uranium ETF Turns Back Up
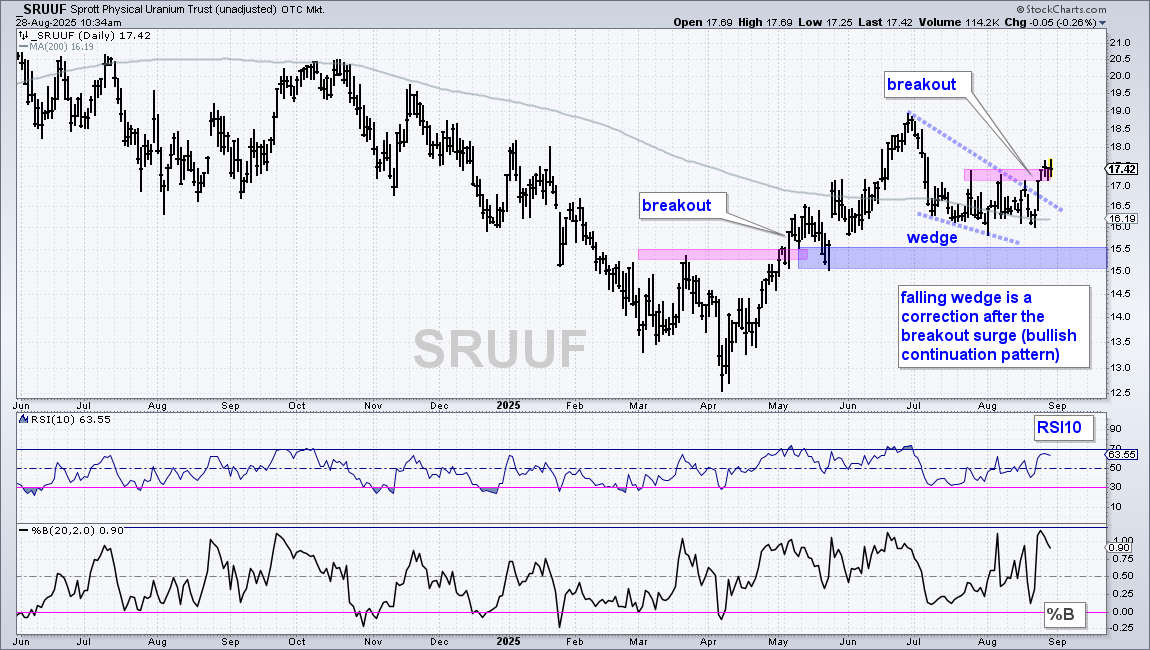
The next chart shows the Sprott Physical Uranium (SRUUF) reversing its downtrend with a surge from April to June. SRUUF broke resistance in early May and exceeded the 200-day SMA in June. The ETF then corrected with a move back to the 200-day SMA. SRUUF is firming just above the breakout zone with support in the 16 area. More importantly, a falling wedge formed and the ETF broke out with a surge the last five days. I view this breakout as bullish because it signals a continuation of the bigger uptrend.
Note that volatility for the Sprott Physical Uranium (SRUUF) is high, which means risk is above average. I am also more inclined to give this breakout some wiggle room. A close below 16 would negate the falling wedge, but I see a support zone in the 15-15.5 area. This support zone holds the key to the early May breakout and long-term uptrend. A close below 15 would negate this signal and reverse the trend.
Bitcoin ETF Tests Support from Prior Breakout
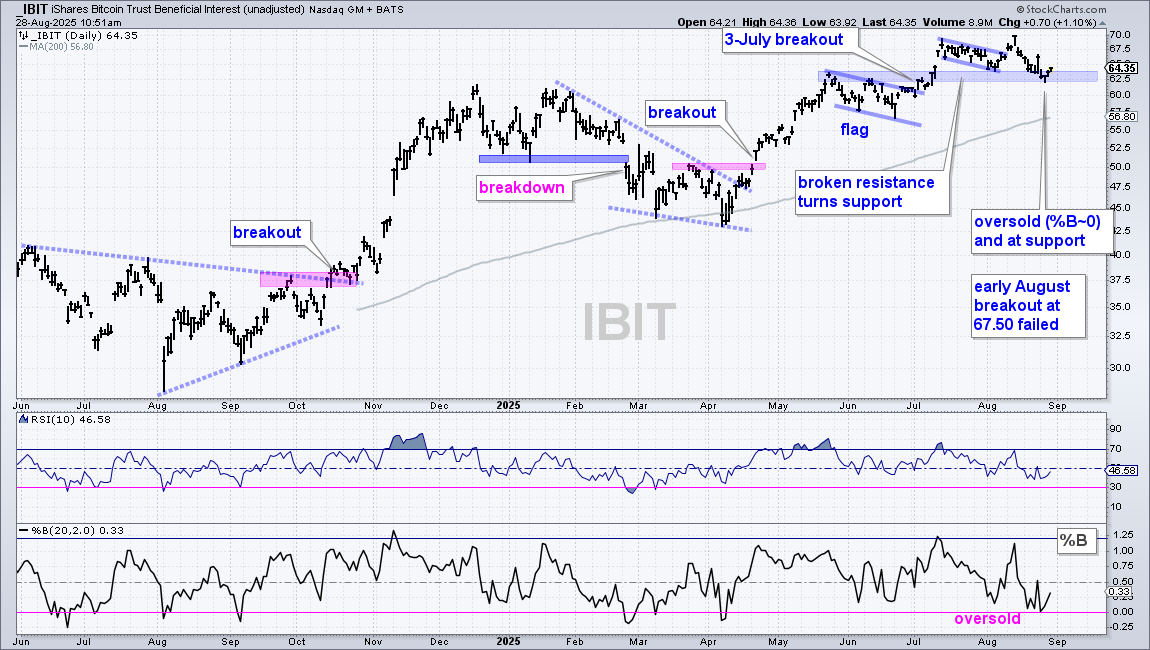
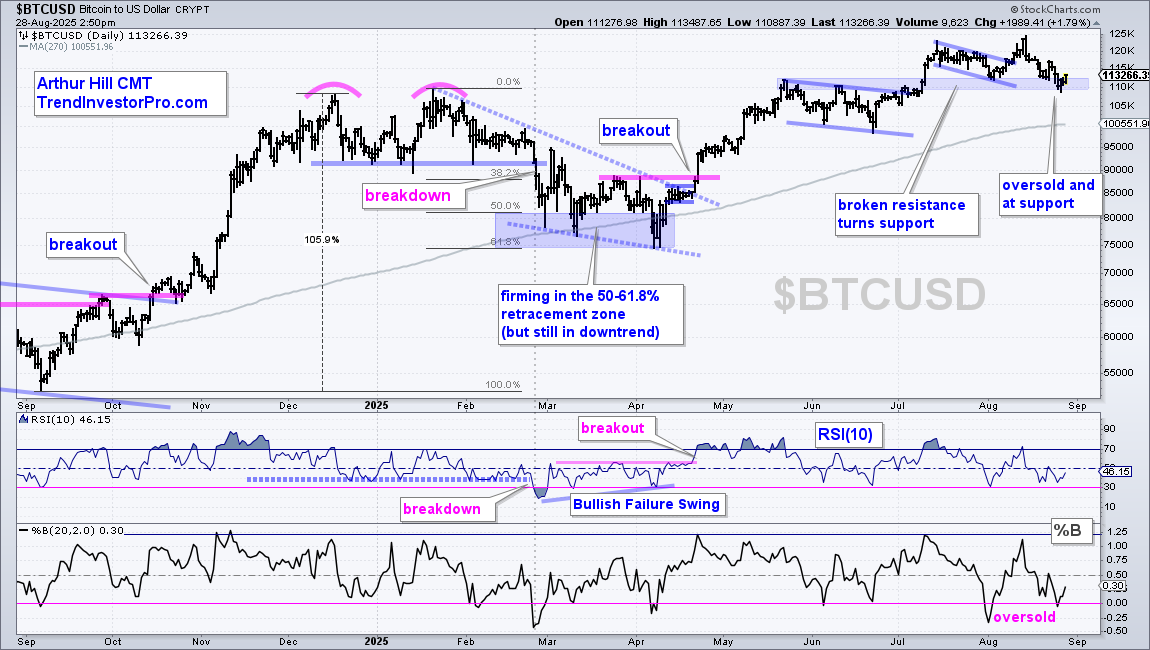
The Bitcoin ETF (IBIT) remains in a long-term uptrend with the rising 200-day marking support in the 56-57 area. Support here also stems from the June low. Short-term, IBIT formed a flag in June, broke out on July 3rd and hit new highs in mid July. Trading since mid July turned choppy as IBIT formed another flag into early August, but the subsequent breakout did not hold. After peaking at 70, the ETF fell below the flag lows and is now testing support from broken resistance (blue shading). %B also fell to zero and became oversold. Thus, the ETF is oversold and at support, which could give way to a bounce. I do not see a tradable pattern though.
DISCLAIMER: This content provided strictly for informational and educational purposes. It should not be interpreted as an offer to buy or sell any security, nor as a solicitation to engage in any investment activity. Nothing here constitutes a recommendation regarding any specific security, portfolio, transaction, or investment strategy.
At times, the author or affiliates may hold positions or interests in securities discussed. Any stocks or examples mentioned are not endorsements or suggestions to purchase. This material does not consider your individual financial goals or circumstances, and you should seek guidance from a qualified financial or investment adviser before making any trading or investment decisions.
Past performance does not guarantee future results.
Send feedback to support(at)trendinvestorpro.com or use the contact form.