Systematic Strategies and Next Level Technical Analysis
Tech ETFs Still Leading – Speculation Builds – A Plan for The Trader and The Accumulator
Arthur Hill, CMT
Archive
Equity ETFs
Use CRTL+P to Print
Headlines
Bull Run Continues with Favorable Conditions
Large Techs and Micro Caps Lead 13 Day Sprint
SPY, QQQ and IWM Extend to New Highs
Tech ETFs Follow Through on Consolidation Breakouts
A Plan for The Trader (ARTY Example)
A Plan for The Accumulator (CIBR Example)
Eight Tech-Related ETFs with Breakouts and Wide Stops
XLK, MAGS, SOXX, SMH, IGV, BLOK, ARKF & ARKK
Bull Run Continues with Favorable Conditions
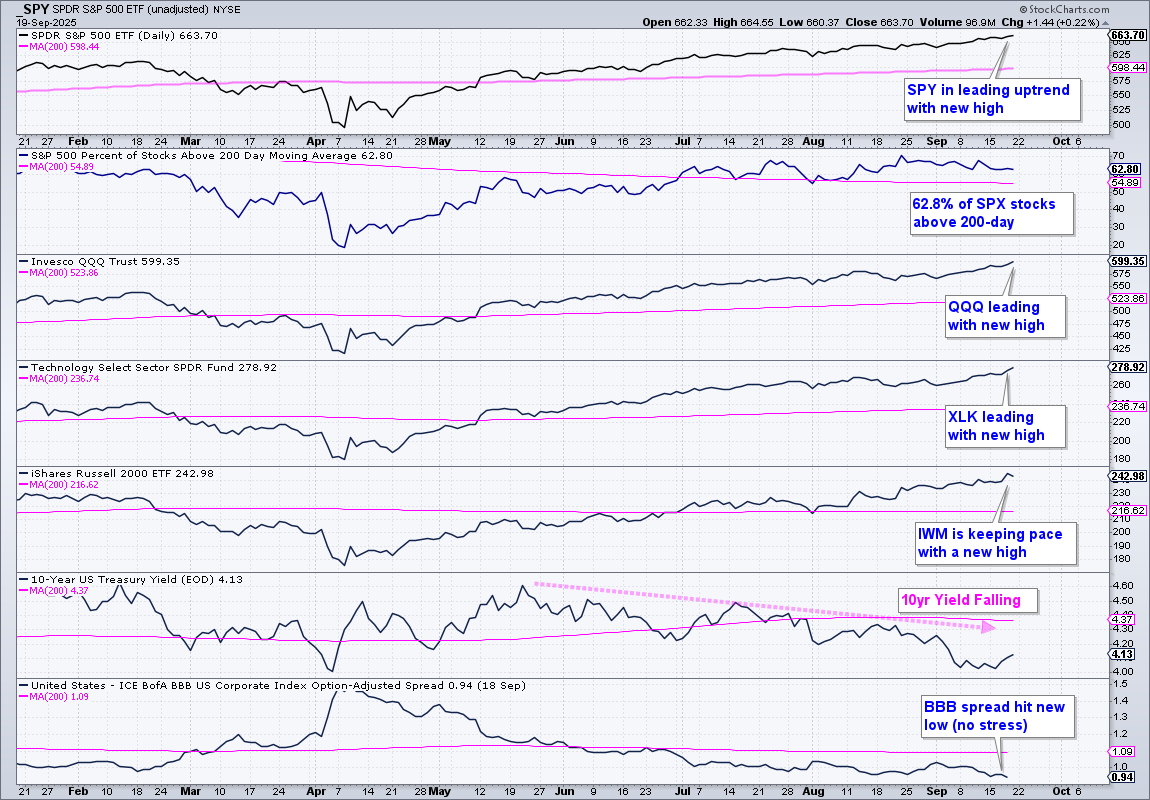
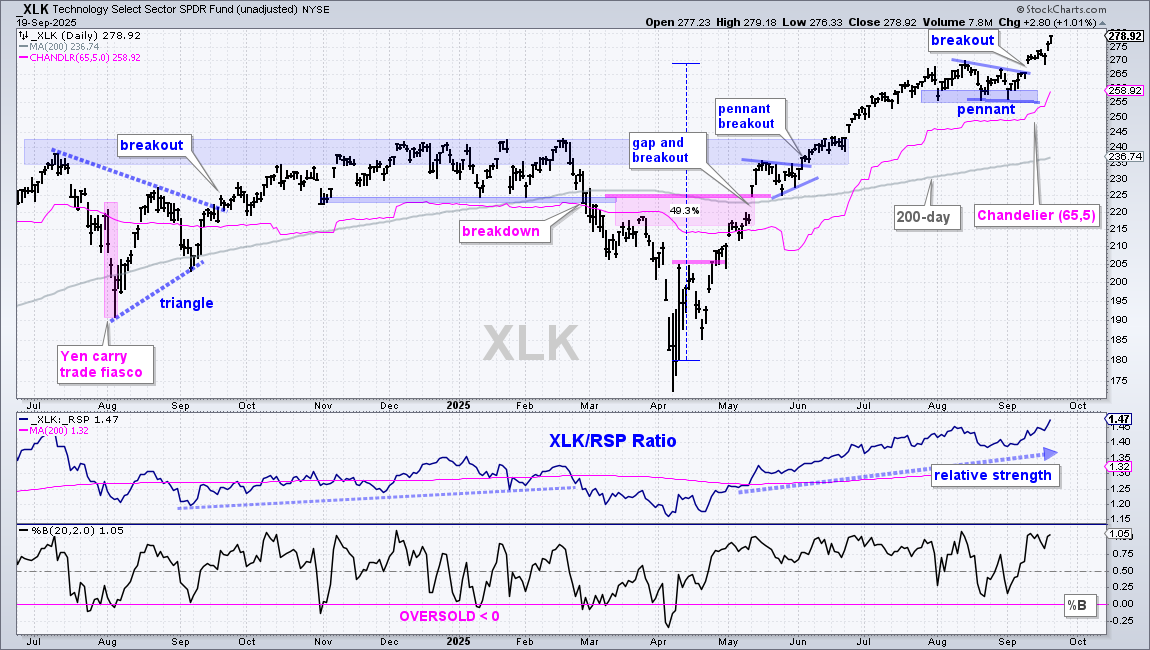
The bull run continues with large-caps and large-cap techs leading the charge. SPY, QQQ and XLK hit fresh new highs this week. Breadth is strong enough to support a bull market with 62.80% of S&P 500 stocks above their 200-day SMAs. With new highs in SPY, QQQ and IWM, this percentage, however, is relatively subdued. In a strong bull market, I would expect to see more than 70% of stocks above their 200-day SMAs, especially after the strong run here in September. This subdued percentage means we are in a selective bull market with large-caps and tech stocks doing the heavy lifting.
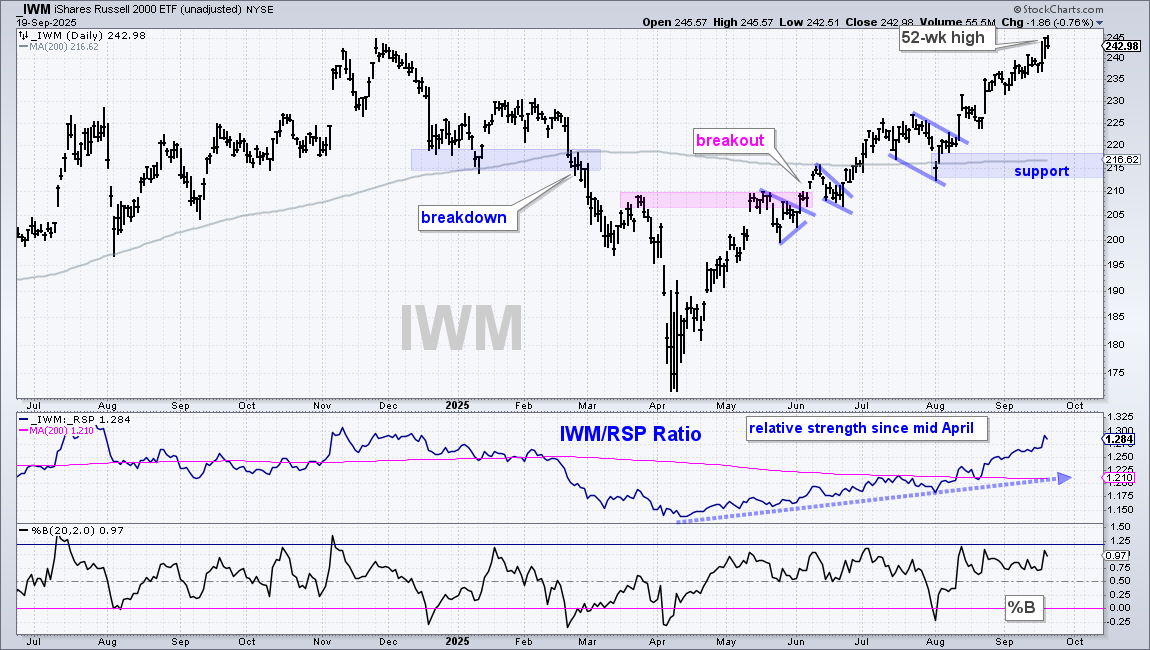
The Russell 2000 ETF (IWM) hit a new high last week by surpassing its November high, finally. The S&P MidCap 400 ETF (IJH) and S&P SmallCap 600 SPDR (IJR), however, are not as strong because both remain well below their November highs. Elsewhere, the 10-yr Treasury Yield ($UST10Y) remains in a downtrend since late May and the BBB yield spread hit a new low, which shows confidence in the credit markets.
Large Techs and Micro Caps Lead 13 Day Sprint
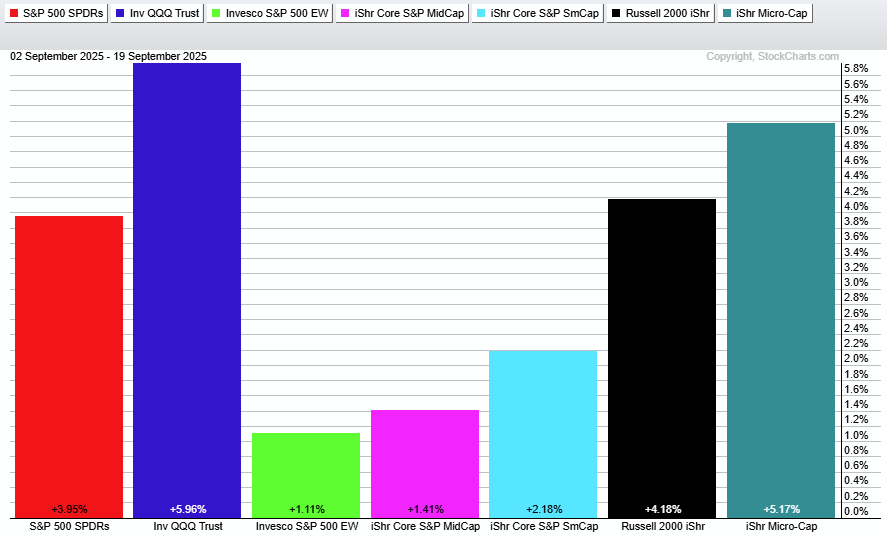
After starting the month with a dip on September 2nd, stocks sprinted higher with QQQ (+6%) leading the charge. Meet the new leader, same as the old leader. Large-cap techs continue to lead the market. We are also seeing speculative names leading with strong gains in the Russell Microcap ETF (+5.17%) and Russell 2000 ETF (4.18%). Could this be froth? In the middle of the market, the S&P 500 EW ETF (1.11%) and S&P MidCap 400 ETF (+1.41%) are dragging their feet. We have leadership from large-cap techs and micro-caps, and underperformance in the middle. This is a selective market.
SPY, QQQ and IWM Extend to New Highs
SPY, QQQ and IWM are in the midst of uptrends, which puts them in the trend-monitoring phase. There are no trading setups on these charts, just clear uptrends. Now is the time to monitor price action, set stops/exits, mark support/re-evaluation levels and wait for the next setup.
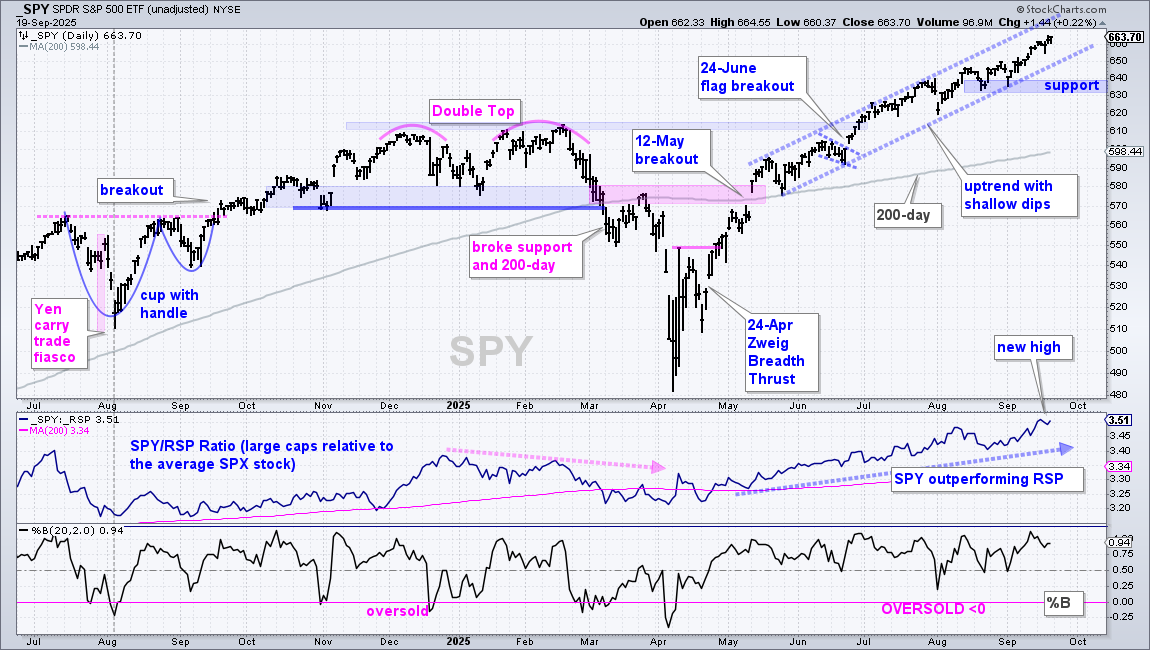
The first chart shows the S&P 500 SPDR (SPY) with a steady uptrend since the mid May breakout surge. The dashed blue lines mark a rising channel that features shallow dips and pushes to new highs. Shallow dips enticed buyers and continued buying pressure pushed SPY to new highs. This is a remarkably steady advance with the first support zone in the 630-640 area.
The middle window shows the price-relative (SPY/RSP ratio) hitting a new high in mid September. SPY continues to outperform the S&P 500 EW ETF (RSP). This means large-caps are stronger than the average stock in the S&P 500. Equal-weight, mid-caps and small-caps cannot consistently outperform large-caps.
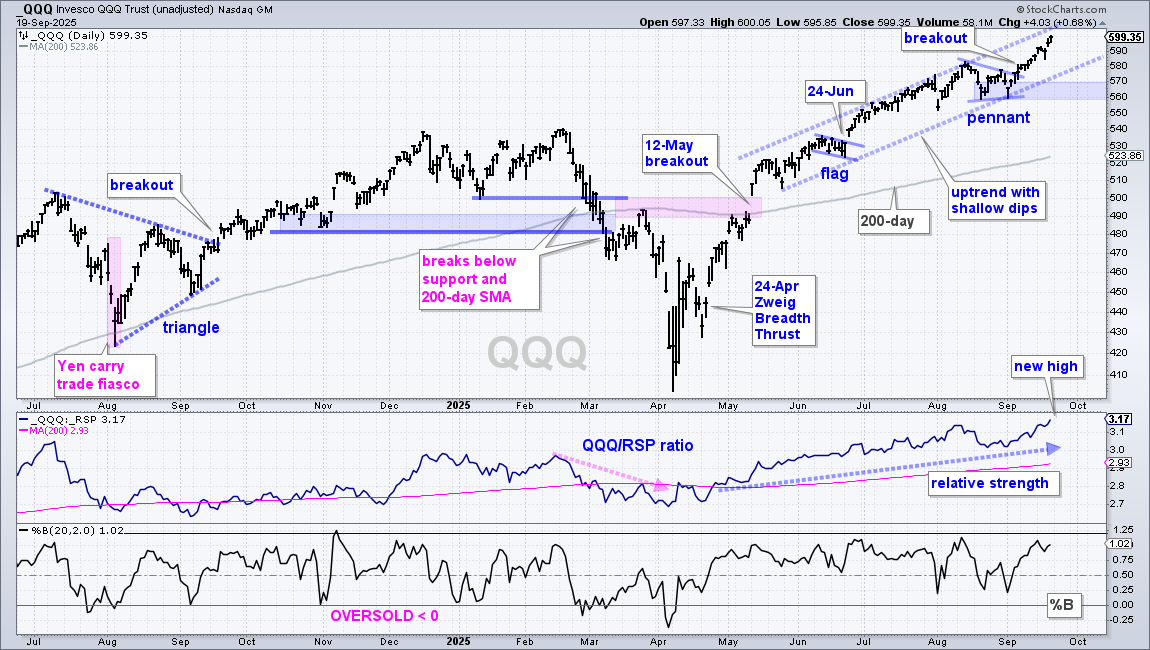
QQQ is leading SPY with even bigger gains the last 13 days (+6%). As with many tech-related ETFs, QQQ consolidated in August with a pennant and broke out with surge the first week of September. Prices continued higher the last two weeks with QQQ hitting fresh new highs. The August lows mark the first support zone in the 560-570 area.
The middle window shows the price-relative (QQQ/RSP ratio) hitting new highs in early August, dipping into late August and turning up the last four weeks. The ratio hit a new high last week, which means QQQ is leading RSP. Large-cap techs are the strongest stocks in the market now.
The next chart shows the Russell 2000 ETF (IWM) tagging a new high last week with a close above 245 on Thursday. There is no setup on this chart, but IWM is looking short-term extended after a 13% advance since early August. Small-caps are more erratic than large-caps, which means IWM is more prone to dips and pullbacks. Long-term support remains in the 215 area.
Tech ETFs Follow Through on Consolidation Breakouts
Several tech-related ETFs formed short-term bullish consolidation patterns in August and broke out in late August or early September. These patterns include falling flags/wedges, flat flags, pennants or small triangles. After a sharp move higher, these patterns represent a rest within the uptrend. Subsequent breakouts end the consolidation period and signal a continuation of the uptrend.
Traders can use these patterns for short-term trading (The Trader). Trading is an active short-term endeavor. Investors, in contrast, can use these patterns to build a position within the uptrend (The Accumulator). Investing is also an active process, but the holding periods are usually longer and signals are less frequent. The key, as always, is to plan your trade ahead of time and trade according to that plan.
A Plan for The Trader (ARTY Example)
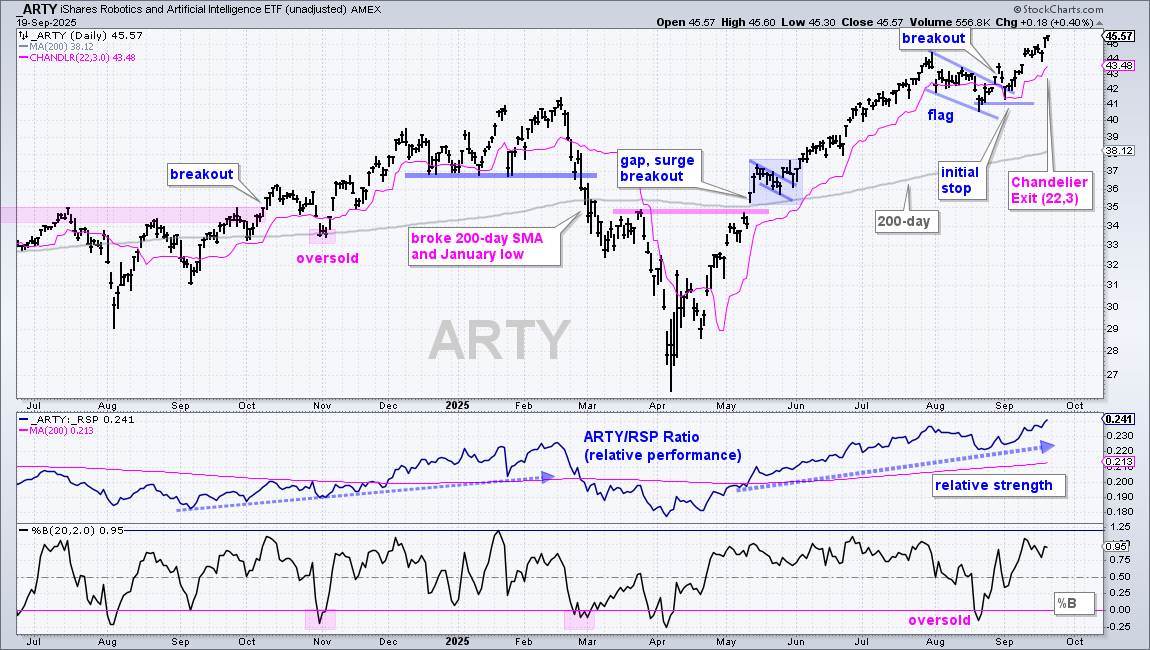
Here is a possible plan for The Trader (active short-term traders). First, buy the breakout and set an initial stop based on the low of the pattern. Second, set a profit target and close a third of half of the position when hit. For example, close half with a 5% profit. Third, set a trailing stop for the remainder. This could be based on a Chandelier Exit (22,3), ATR Trailing Stop, moving average or support level.
The chart below shows the Robotics AI ETF (ARTY) with a flag breakout in late August and an initial stop-loss level at 41. ARTY continued higher in September and is currently up around 5% since the breakout. This could be an area for short-term traders to book partial profits. The pink line shows the Chandelier Exit (22,3) at 43.48, which is the trailing stop. This exit is 3 ATR(22) values below the 22-day high, which means it rises as long as higher highs persist (the uptrend continues).
A Plan for The Accumulator (CIBR Example)
Here is a possible plan for The Accumulator (position building investor). Buy when the long-term trend turns up. Add to positions when the name becomes oversold and/or a bullish continuation pattern forms. Exit when the uptrend reverses or a wide trailing stop triggers. For trend reversals, chartists can use the 200-day SMA, a major support break or the Trend Composite.
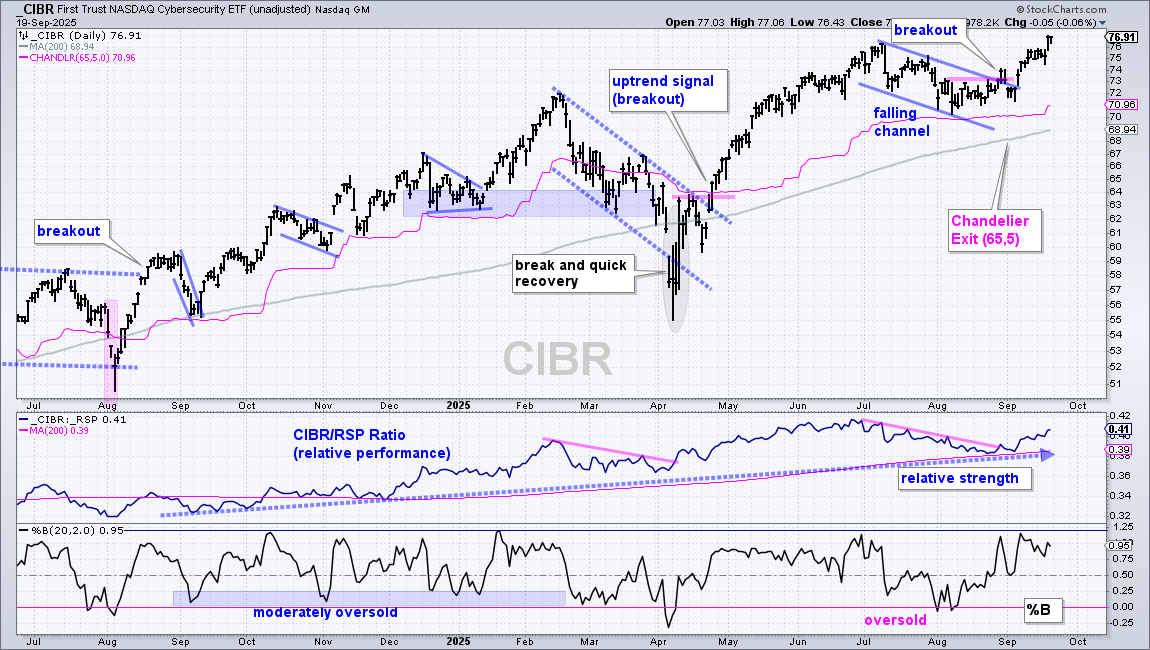
The next chart shows the Cybersecurity ETF (CIBR) with an uptrend signal (breakout) in late April and a move to new highs. Trend signals work best with wide stops so I am using a Chandelier Exit (65,5). This exit is 5 ATR(65) values below the 65-day high (three month high).
An accumulation setup occurred in August as CIBR corrected with a falling channel from early July to August. %B also became oversold with dips below zero in early August. This setup was identified in the report on August 12th. CIBR broke out in late August, fell back after the breakout and then surged to new highs last week. After adding to a position, the Accumulator can consider using the Chandelier Exit (65,5) as a trend-following stop.
Eight Tech-Related ETFs with Breakouts and Wide Stops
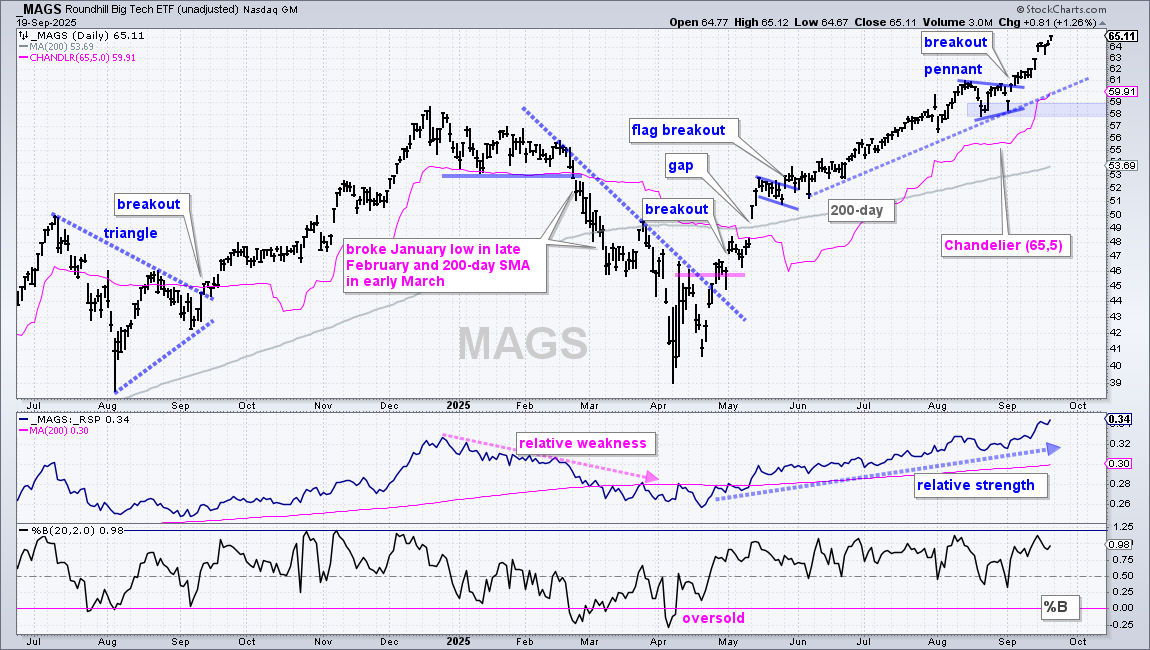
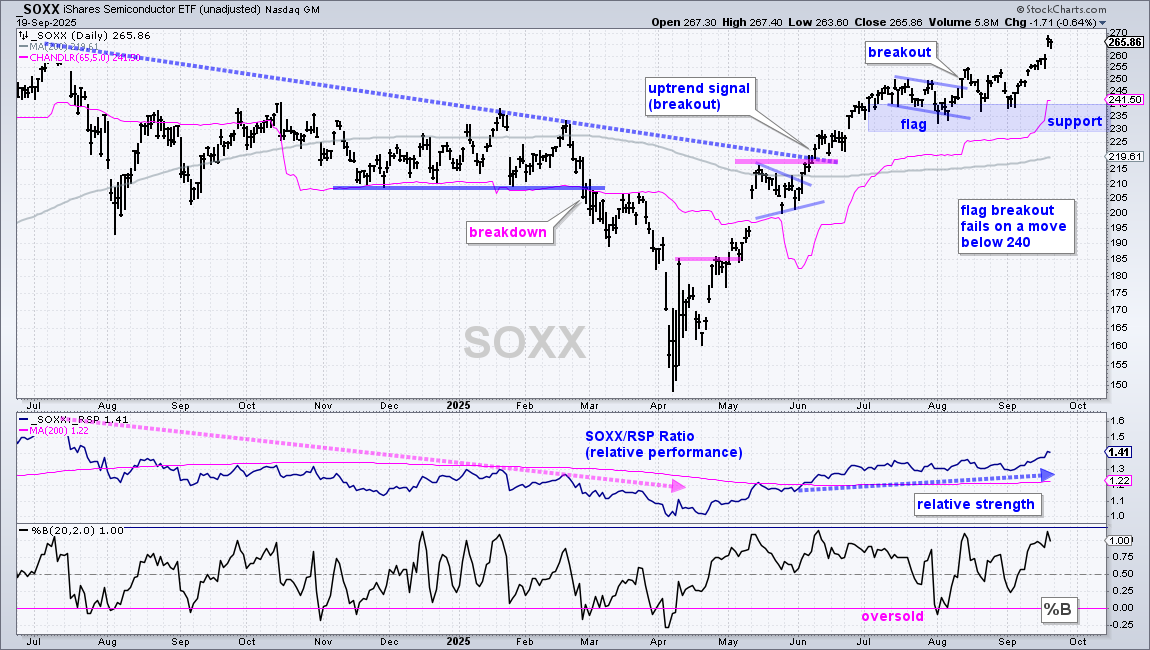
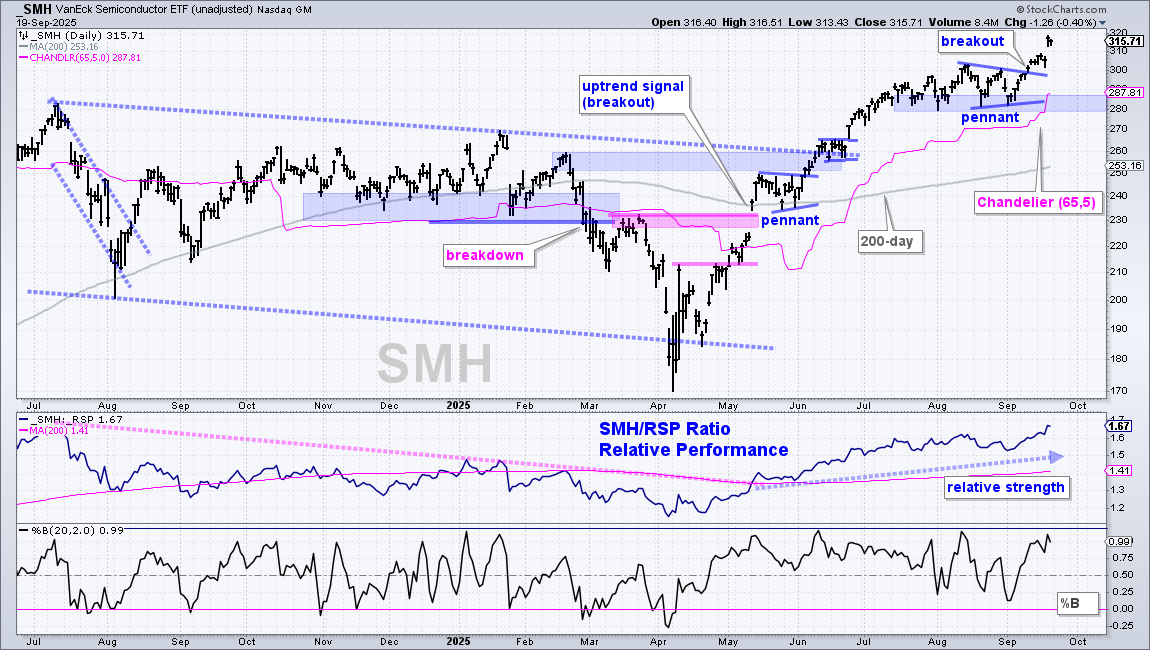
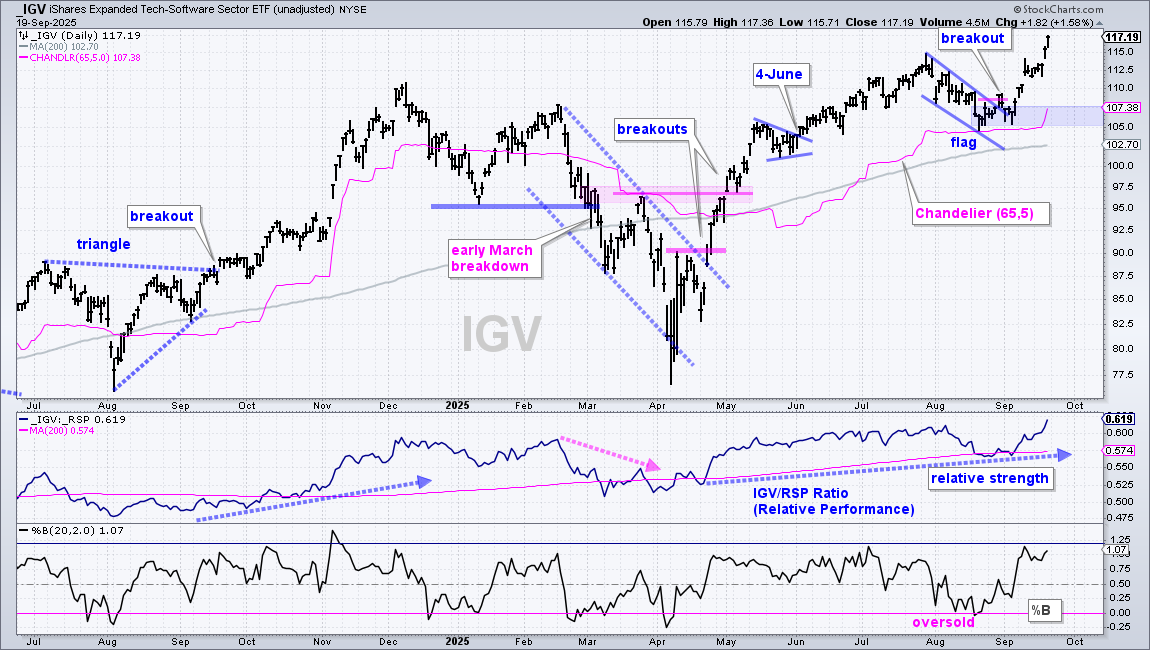
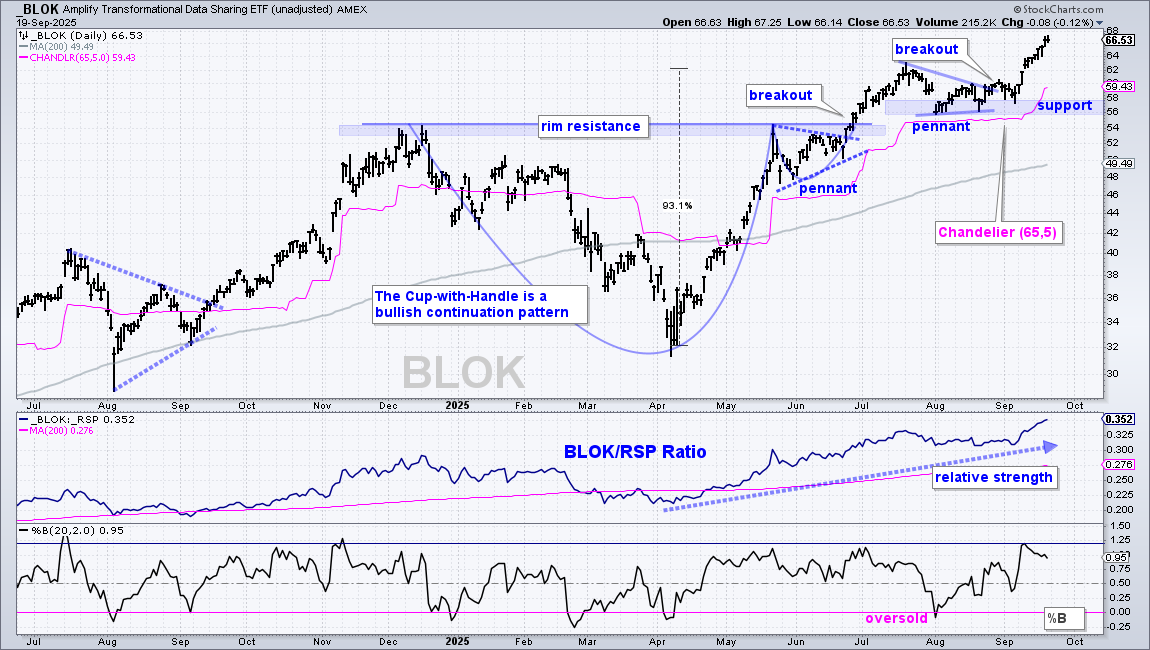
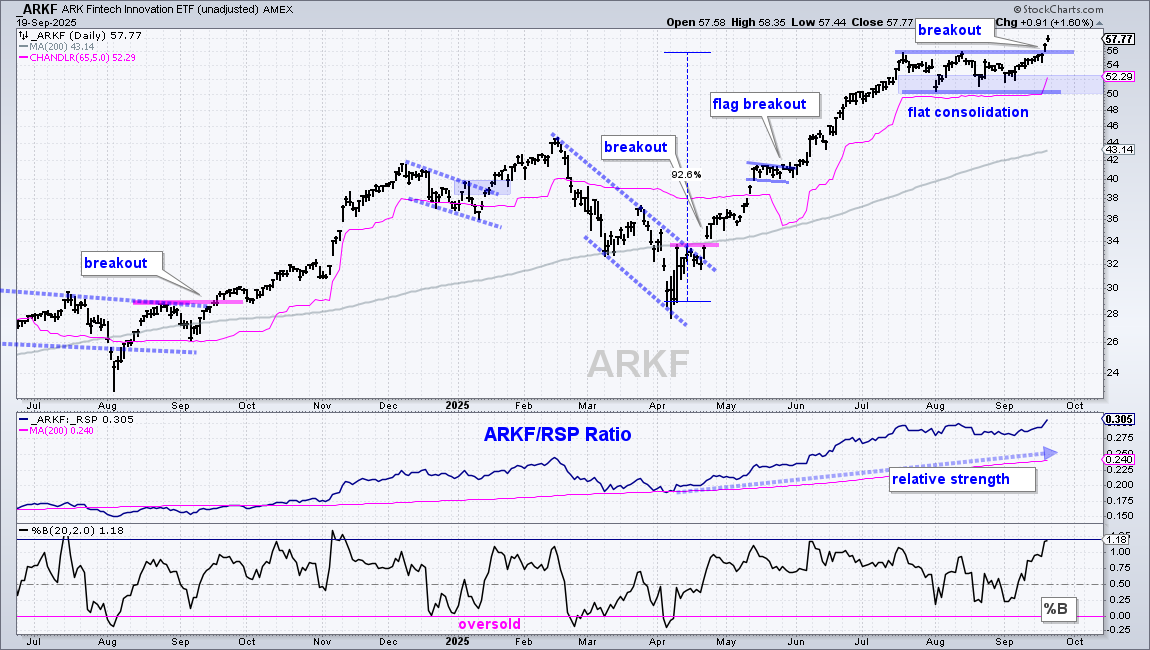
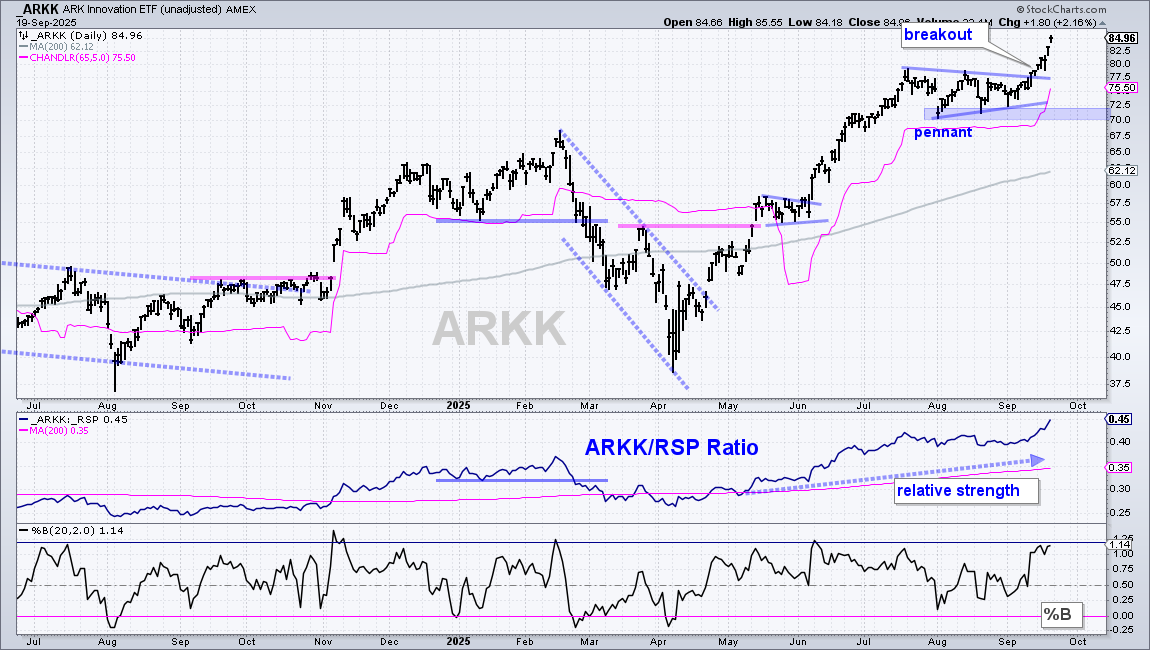
XLK, MAGS, SOXX, SMH, IGV, BLOK, ARKF & ARKK
The next charts show eight tech ETFs with consolidation breakouts and Chandelier Exits (65,5). Personally, I am more of an Accumulator than a Trader. This is simply because my goal is to trade less and focus more on the bigger trends at work. We are all individuals with different goals and trading styles. We must find a trading style that fits our goals.
DISCLAIMER: This content provided strictly for informational and educational purposes. It should not be interpreted as an offer to buy or sell any security, nor as a solicitation to engage in any investment activity. Nothing here constitutes a recommendation regarding any specific security, portfolio, transaction, or investment strategy.
At times, the author or affiliates may hold positions or interests in securities discussed. Any stocks or examples mentioned are not endorsements or suggestions to purchase. This material does not consider your individual financial goals or circumstances, and you should seek guidance from a qualified financial or investment adviser before making any trading or investment decisions.
Past performance does not guarantee future results.
Send feedback to support(at)trendinvestorpro.com or use the contact form.