Systematic Strategies and Next Level Technical Analysis
Alternative ETFs – GLD, SLV, GDX, SIL, CPER, DBB, SRUUF (Uranium), $BTCUSD and IBIT
Arthur Hill, CMT
Archive
Alternative ETFs
Use CRTL+P to Print
Headlines
Gold and Silver Surge to New Highs
Gold and Silver Miners Follow their Metals Higher
Copper Breaks Out as Base Metals Extend Higher
Uranium Trust Extends on Breakout
Bitcoin Corrects within Long-term Uptrend
Precious metals continue to lead the financial markets as gold, silver and their respective miners hit new highs. The recent breakouts were not a surprise because bullish continuation patterns formed in August. We are also seeing continued strength in Base Metals, as well as a recent breakout in Copper. Uranium extended on its breakout, but Bitcoin remains in corrective mode.
Gold and Silver Surge to New Highs
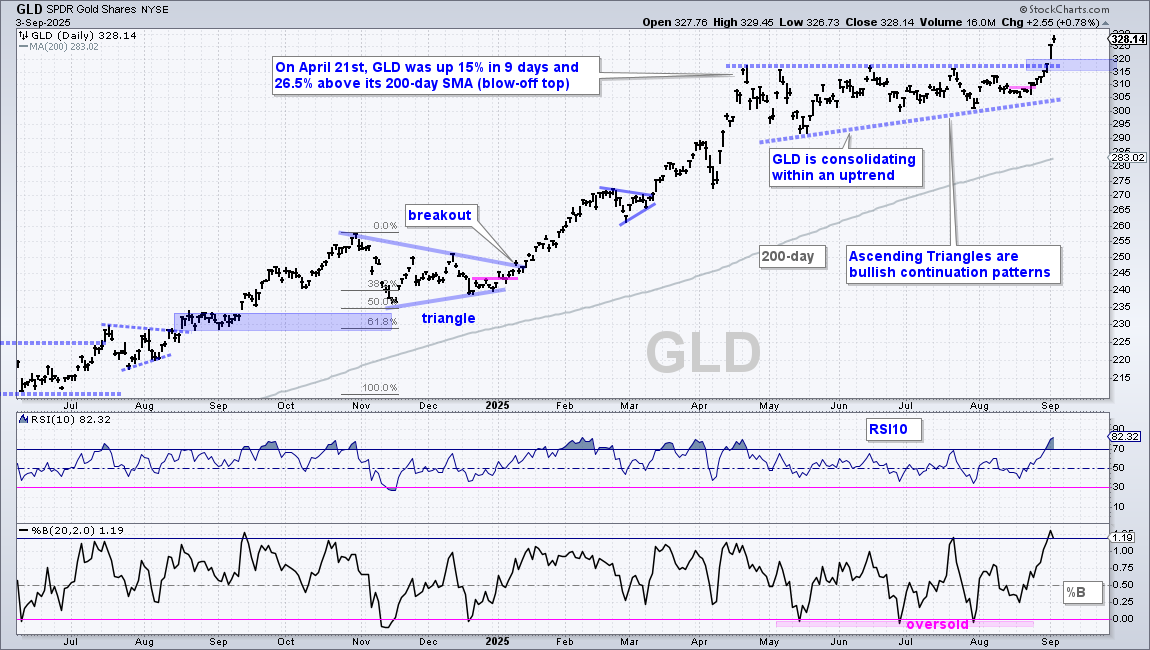
It was a long time coming, but the Gold SPDR (GLD) finally broke to new highs with its biggest two week surge (+7.5%) since mid April. After surging past 300 in mid April, GLD moved into a trading range for four months. As noted throughout the range, this was viewed as a consolidation within an uptrend, which makes it a bullish continuation pattern. A breakout was expected, and we got it. There were up and down swings within this consolidation, but these swings became smaller and smaller as the Ascending Triangle narrowed. There was a small breakout at 310 (pink line) on August 22nd, which was noted last week. There is nothing to do now except monitor this leading uptrend and wait for the next bullish setup. The breakout zone in the 315-320 area turns first support, should GLD pull back.
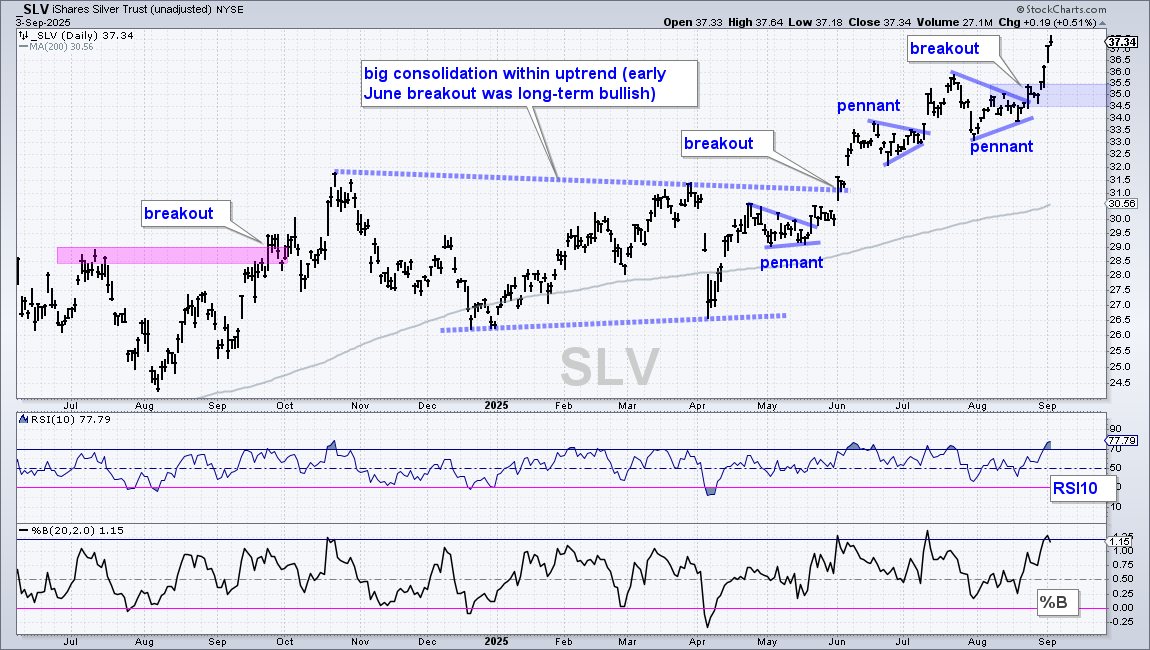
The next chart shows the Silver ETF (SLV) breaking out of a pennant with a big move on August 22nd. Pennants represent a rest within the ongoing trend and the breakout signals a continuation higher. This pennant was first noted on August 21st. The late August breakout was bullish and SLV extended sharply higher. As with GLD, it is now time to monitor the uptrend and wait for the next bullish setup to emerge.
Gold and Silver Miners Follow their Metals Higher
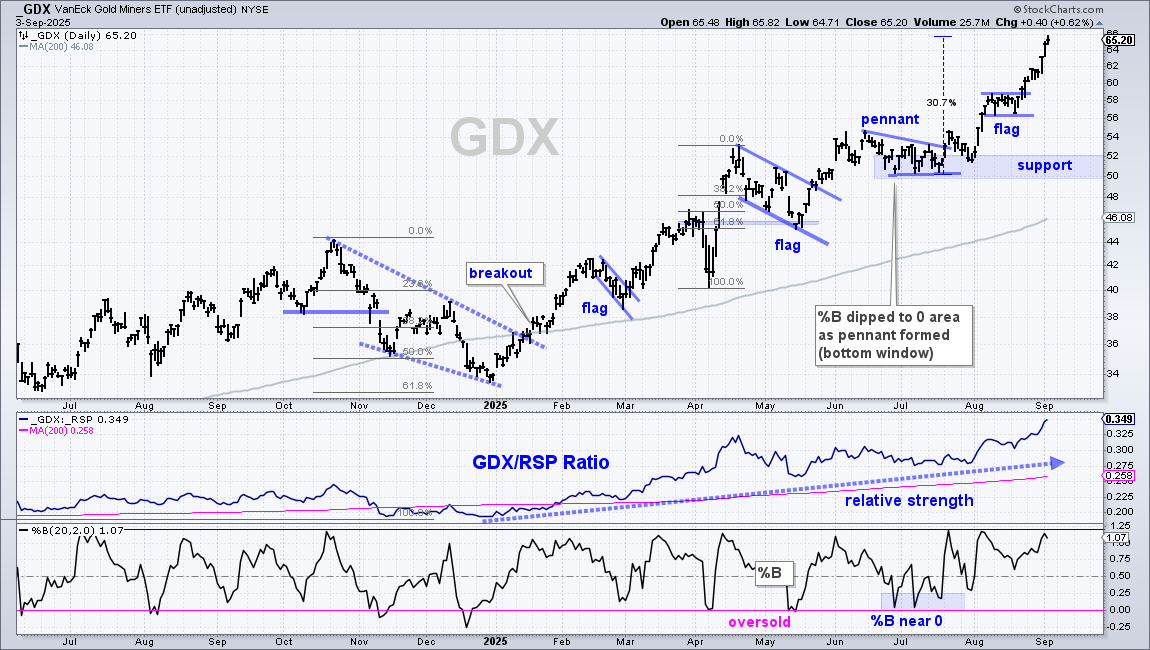
Unsurprisingly, the Gold Miners ETF (GDX) extended on its flag breakout and hit a series of new highs the last nine days. Since the big breakout in mid January, GDX formed one bullish consolidation after another and broke out (flag, flag, pennant, flag). The latest was a high and tight flag in mid August. This is a short-term bullish continuation pattern and the August 21st breakout confirmed the pattern. GDX did not look back and is now up some 30% since mid July. The ETF is getting short-term extended so traders should be on guard for a pullback or consolidation. Long-term support is set in the 50-52 area.
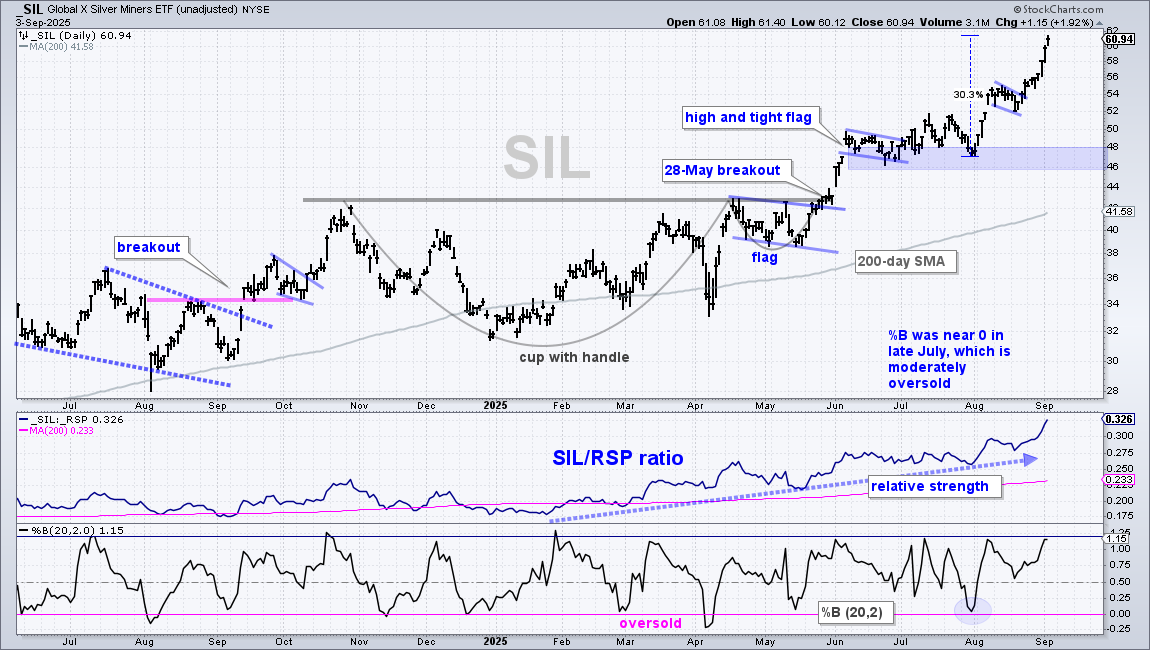
The next chart shows the Silver Miners ETF (SIL) with similar characteristics.
Copper Breaks Out as Base Metals Extend Higher
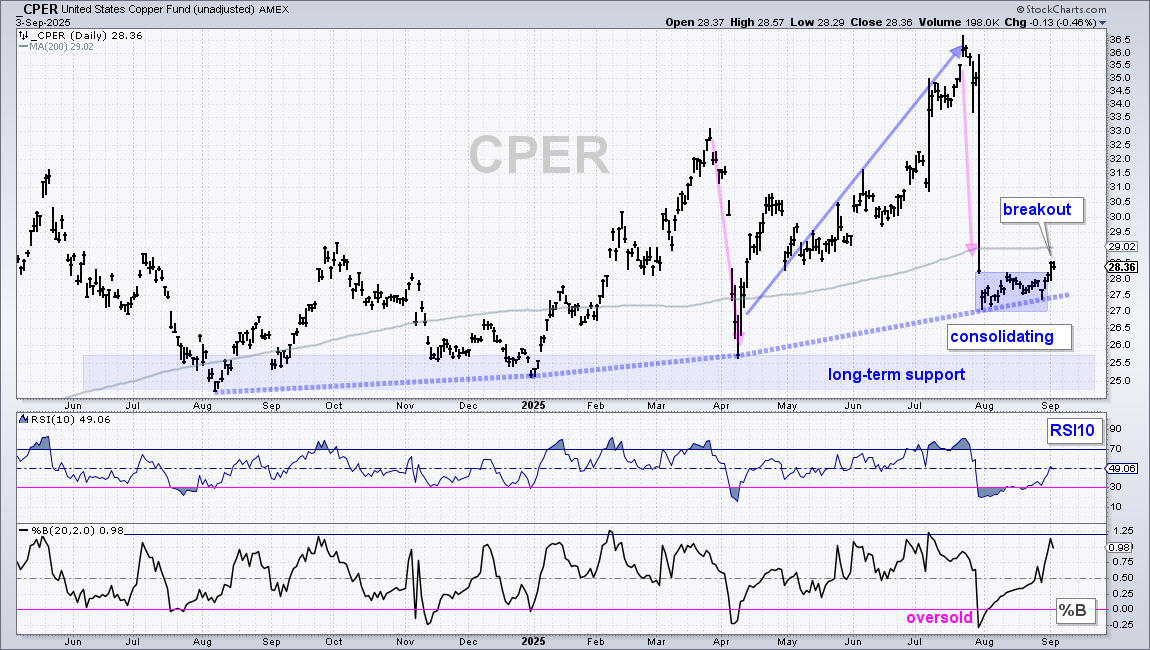
The Copper ETF (CPER) was featured last week as it consolidated above the April high. Long-term, there is still a volatile uptrend intact with higher lows extending back to August 2024 (blue dashed line). CPER also has higher highs in September, March and July, as well as two massive drips (pink arrow lines). After becoming extremely oversold in late July, CPER firmed in August and established support in the 27-28 area, which is above the prior low (April). Buying pressure increased this week as the ETF broke above the mid August highs. I view this as bullish price action with first support set at 27.
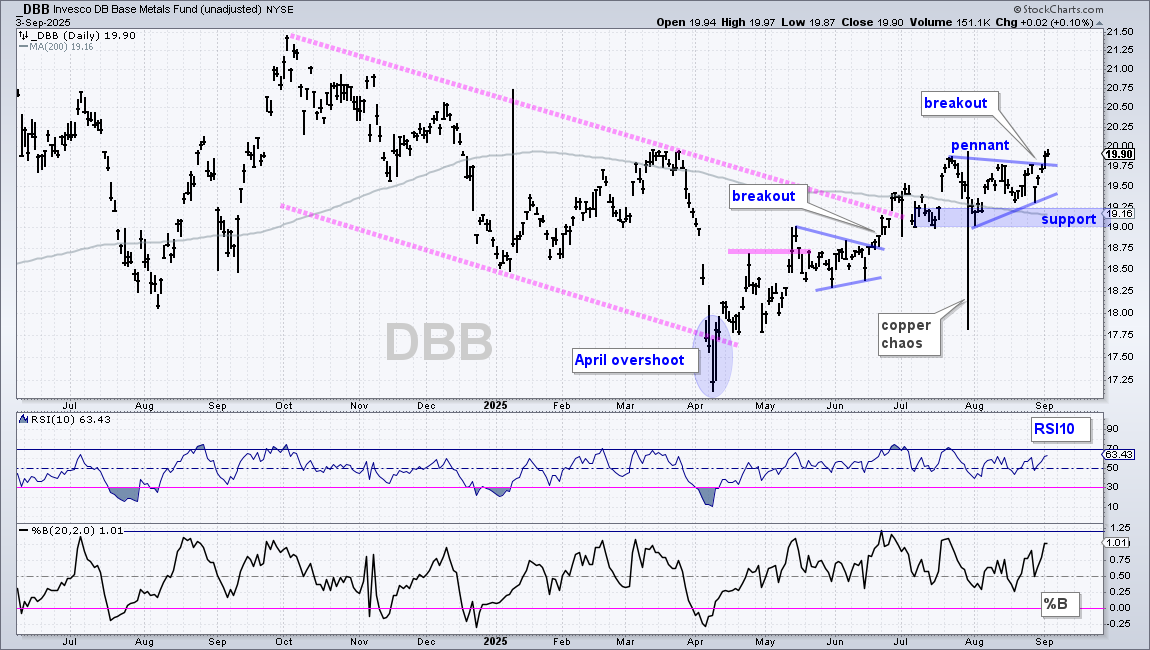
The next chart shows the DB Base Metals ETF (DBB), which is equal parts copper, aluminum and zinc. DBB trended lower from October to April and started reversing this downtrend in May. The ETF broke the mid April high in mid May, broke the pennant line in late June and broke the channel line in late June. DBB has been working its way high since the April low and is trading above the 200-day SMA. Most recently, a pennant formed into August and DBB broke out with a surge the last five days. This move keeps the uptrend alive and reinforces support in the 19-19.25 area.
Uranium Trust Extends on Breakout
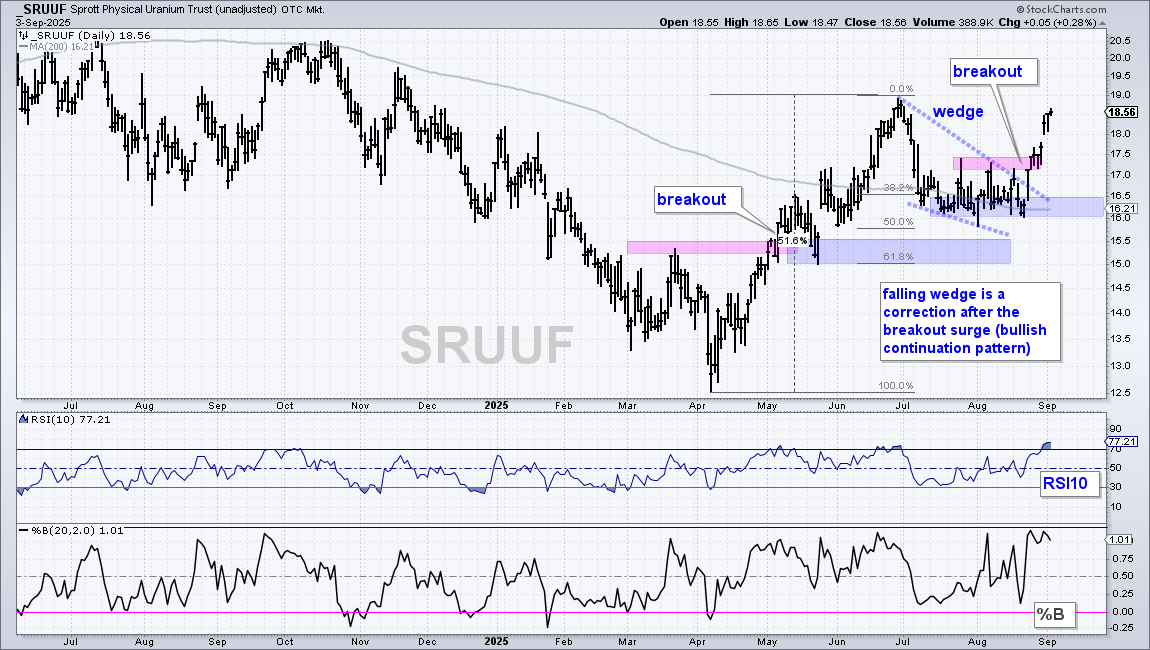
The Sprott Physical Uranium (SRUUF) was featured last week as it formed a bullish setup and broke out. Long-term, the downtrend reversed with the resistance break in early May and strong move above the 200-day SMA in June.
After a 50% advance, the ETF corrected back to the 200-day SMA with a falling wedge. Also notice that this wedge retraced 50% of the prior advance. Both the retracement amount and pattern are typical for corrections.
SRUUF firmed in the 16-16.5 area from mid July to mid August, broke out with a surge to 17.5 last week and continued higher this week. I am raising re-evaluation support to 16. Note that this is a VERY VOLATILE ETF with above average risk. If/when possible, consider taking some profits when possible to lock in gains and ensure that the entire trade does not turn into a loser.
Bitcoin Corrects within Long-term Uptrend
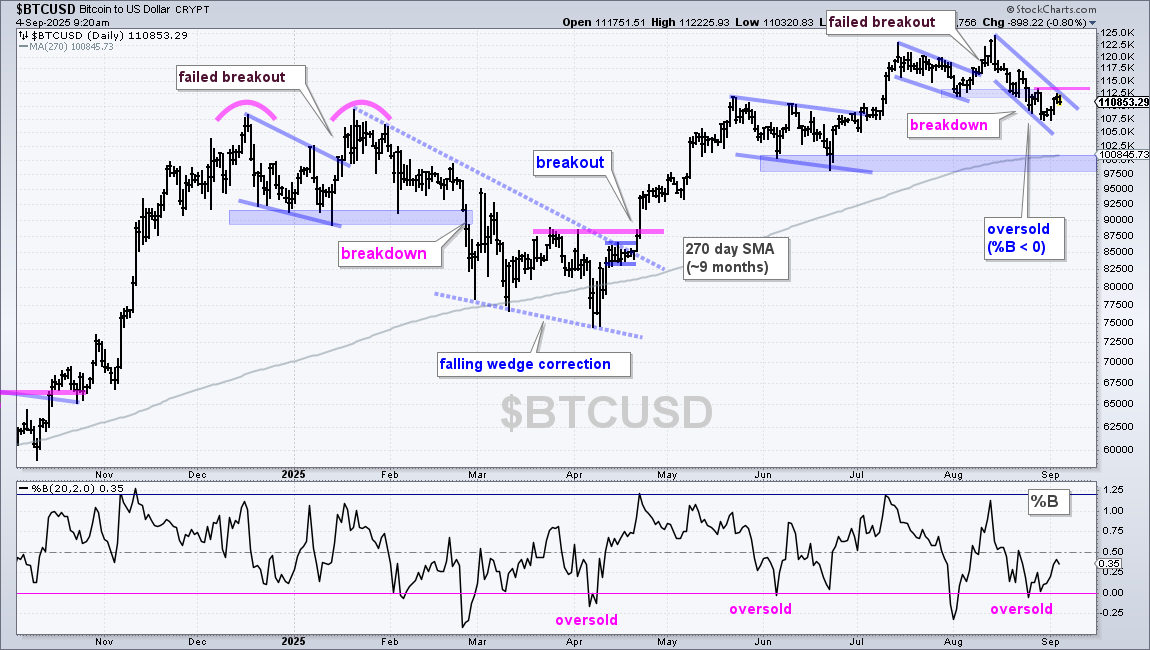
The first chart shows Bitcoin ($BTCUSD) in a long-term uptrend with a new high in mid August and price well above the rising 270-day SMA. BTC trades 24/7 so 270 calendar days is equivalent to 200 trading days for the ETF (~9 months). Long-term support is set in the 98000-10100 area.
Shorter-term, BTC broke out in mid August, but failed to hold this breakout and broke short-term support at 112000. This failed breakout and breakdown sequence remind me of a similar sequence from mid January to late February.
BTC is in a short-term downtrend since mid August with an oversold condition in late August. A setup is brewing, but BTC needs to reverse the short-term slide. I am marking short-term resistance at 113,500. A breakout here would be short-term bullish because it would forge a higher high. I would then mark initial re-evaluation support at 107,000.
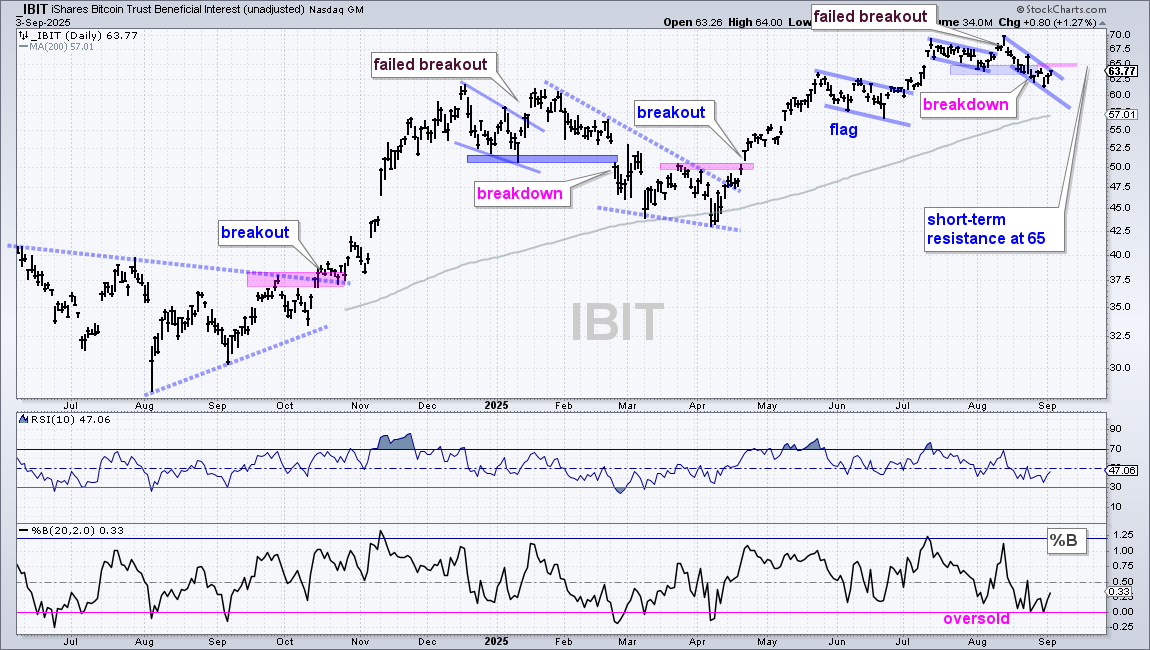
The next chart shows the Bitcoin ETF (IBIT) with similar characteristics and short-term resistance at 65.
DISCLAIMER: This content provided strictly for informational and educational purposes. It should not be interpreted as an offer to buy or sell any security, nor as a solicitation to engage in any investment activity. Nothing here constitutes a recommendation regarding any specific security, portfolio, transaction, or investment strategy.
At times, the author or affiliates may hold positions or interests in securities discussed. Any stocks or examples mentioned are not endorsements or suggestions to purchase. This material does not consider your individual financial goals or circumstances, and you should seek guidance from a qualified financial or investment adviser before making any trading or investment decisions.
Past performance does not guarantee future results.
Send feedback to support(at)trendinvestorpro.com or use the contact form.