Systematic Strategies and Next Level Technical Analysis
Smalls/Mids Lead – Biggest XLF Holding Breaks Out – Banks Strong – Utes Setup Up
Arthur Hill, CMT
Archive
Use CRTL+P to Print
Headlines
Mid-caps and Small-caps Extend to New Highs
Finance SPDR Leads as Biggest Holding Plays Catch Up
Small Regional Banks Power Small-caps
Insurance ETF Challenges Long-term Resistance
Utilities SPDR Forms Bullish Continuation Pattern
The next report/video will be on Tuesday morning (1-Sep)
SPY remains a leader with fresh new highs, but QQQ is still below its mid August high and XLK remains flat this month. Even though the latter two are still in long-term uptrends, they show relative weakness short-term and this could foreshadow a corrective period for big tech. Small-caps, mid-caps, Finance and Banks are leading in August with new highs for the move. We also look at Utilities because XLU formed a short-term bullish continuation pattern.
Mid-caps and Small-caps Extend to New Highs
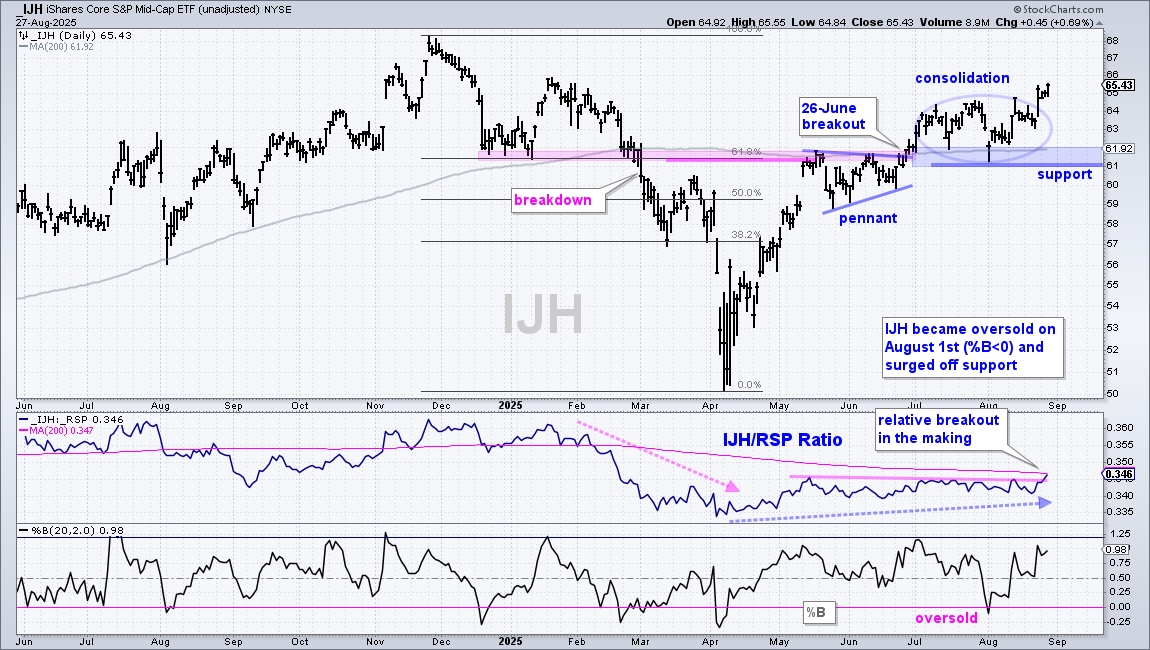
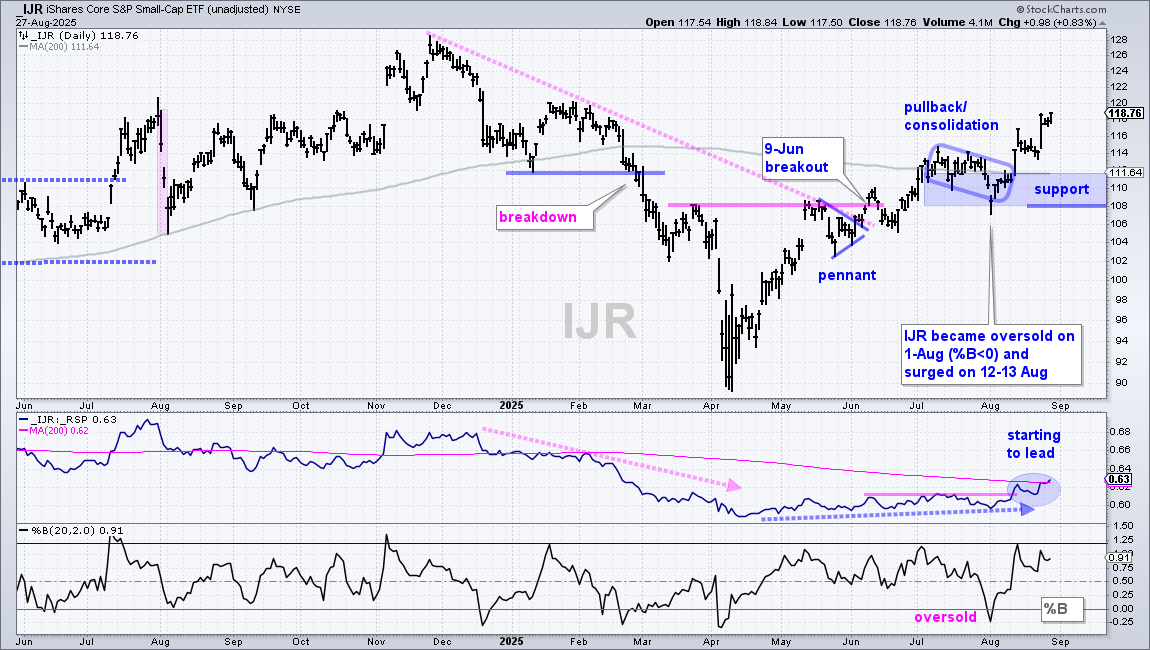
SPY extended to a new high on Wednesday to affirm its leading uptrend. QQQ bounced the last few days, but remains below its mid August high. Nevertheless, QQQ is in a long-term uptrend. The S&P MidCap 400 ETF (IJH) and the S&P SmallCap 600 SPDR (IJR) are the up and coming stars as both hit new highs for the move, which began with the April low. Both are still below their November highs, but leading the market here in August.
The first chart shows IJH with the trend-reversing breakout on June 26th, a consolidation (oval) into mid August and a break out last Friday. Even though this consolidation did not form a classic flag, wedge or triangle, it is a consolidation above the June breakout. The recent breakout signals a continuation higher and the November highs mark the next target. Key support is set at 61.
The next chart shows the S&P SmallCap 600 SPDR (IJR) breaking out on June 9th and working its way higher the last three months. There was a pullback in July and then a breakout in mid August as prices accelerated higher the last few weeks. IJR is up 7% in 12 days. Long-term support is set at 108. The middle window shows the price-relative (IJR/RSP ratio) turning up in August and breaking above its 200-day SMA this week. Small-caps are starting to lead.
Finance SPDR Leads as Biggest Holding Plays Catch Up
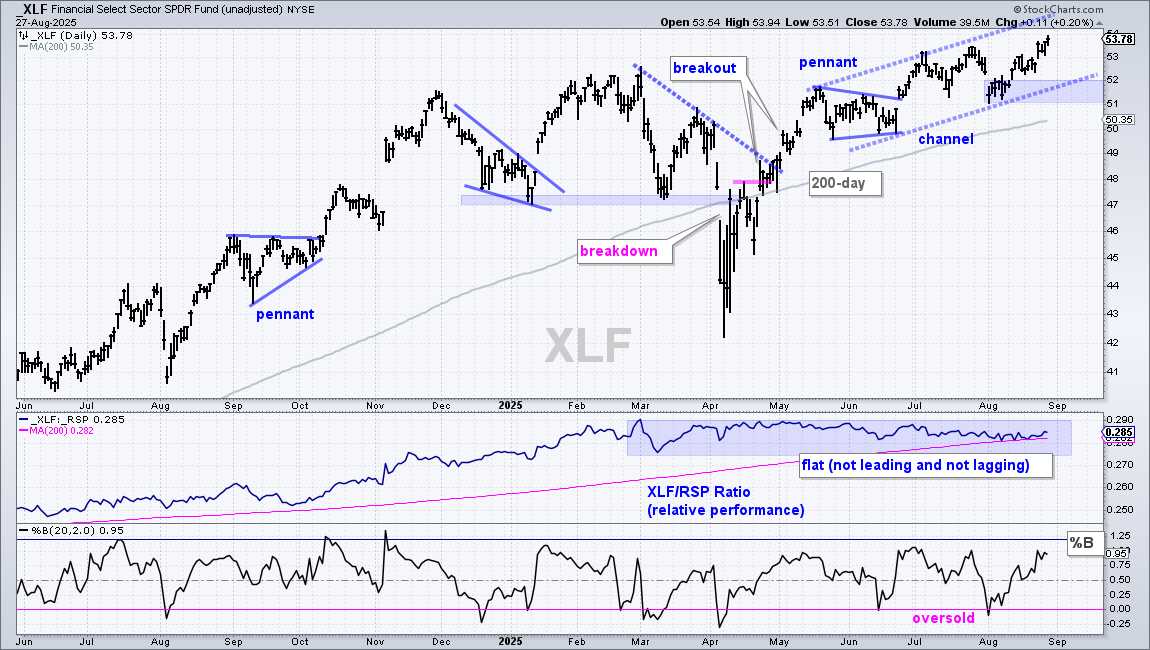
The Finance SPDR (XLF) is not the most exciting name, but it is in a steady uptrend with a new high this week. Strength in financials could be related to interest rates, however, note that interest rates are just one piece of the supply/demand puzzle. XLK broke out in late April, surged into mid May and then began working its way higher. A rising channel is taking shape with first support marked in the 51-52 area. The middle window shows the price-relative moving higher from October to February and then flat-lining the last six months. This means XLF is performing in line (not leading and not lagging).
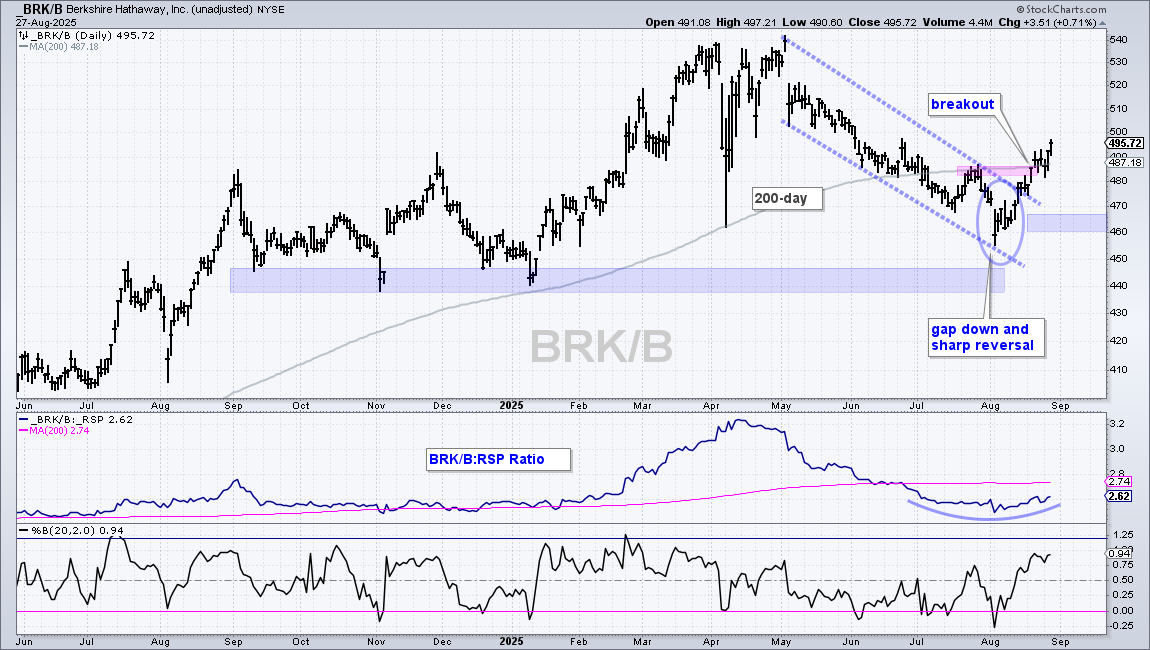
Berkshire Hathaway (BRK/B) is the largest holding (12%) in the Finance SPDR (XLF), but lagging the other top components since April. The middle window shows the price-relative falling from May to early August. Despite relative weakness, Berkshire shows signs of a trend reversal as the stock broke out of a long falling wedge and exceeded its July high. Also notice that this move started with a gap down and sharp reversal higher. This gap was immediately filled, which means it turned into a bear trap because traders shorting on the gap down are trapped with losses. On the bullish side, breakouts with outsized moves reflect strong upside momentum and buying pressure. This is bullish. The initial re-evaluation support level is set at 460.
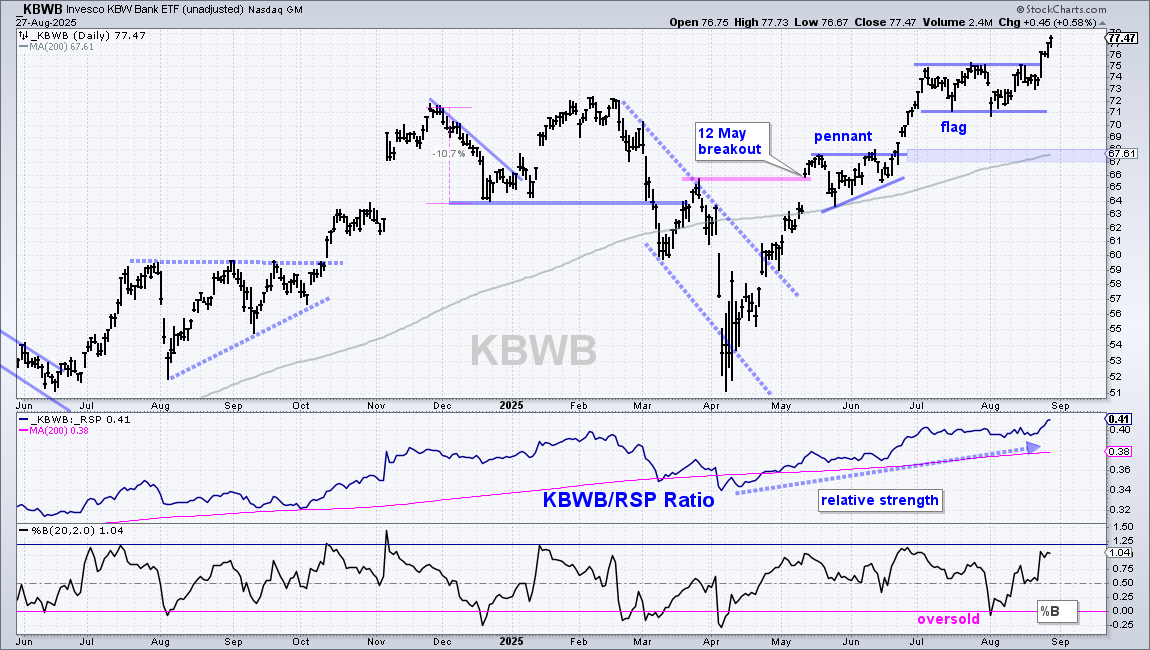
The next chart shows the KBW Bank ETF (KBWB), which is a true leader. KBWB is just banks – big banks. The ETF hit a new high in early July, consolidated into August and broke out to new highs again. The middle window shows the price-relative turning up in April and hitting a new high here in late August. I will use the rising 200-day SMA to mark support in the 67-68 area.
Small Banks Power Small-caps
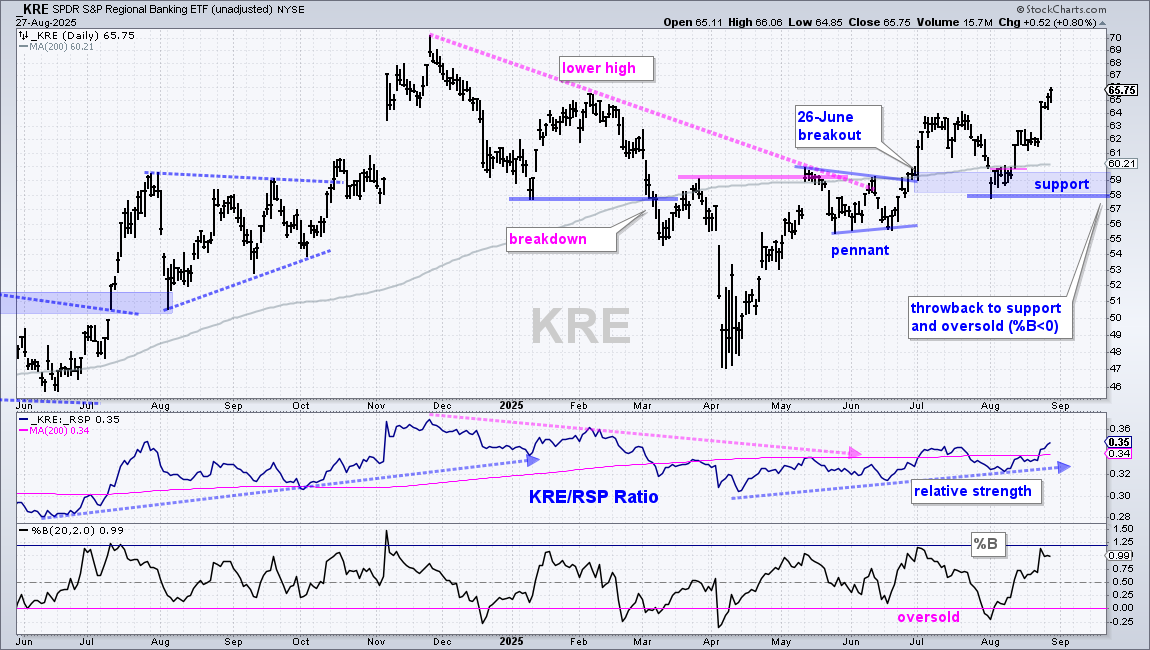
The next chart shows the Regional Bank ETF (KRE), which ties in with small-caps because financials account for 19-20 percent of IJR and IWM. REITs account for another 6-7 percent. KRE broke out on June 26th, fell back to the breakout zone and became oversold on August 1st. After firming for a few days, KRE surged back above the 200-day and short-term resistance (pink line). The ETF extended above its July highs and is leading the market in August. Long-term support is set at 58.
Insurance ETF Challenges Long-term Resistance
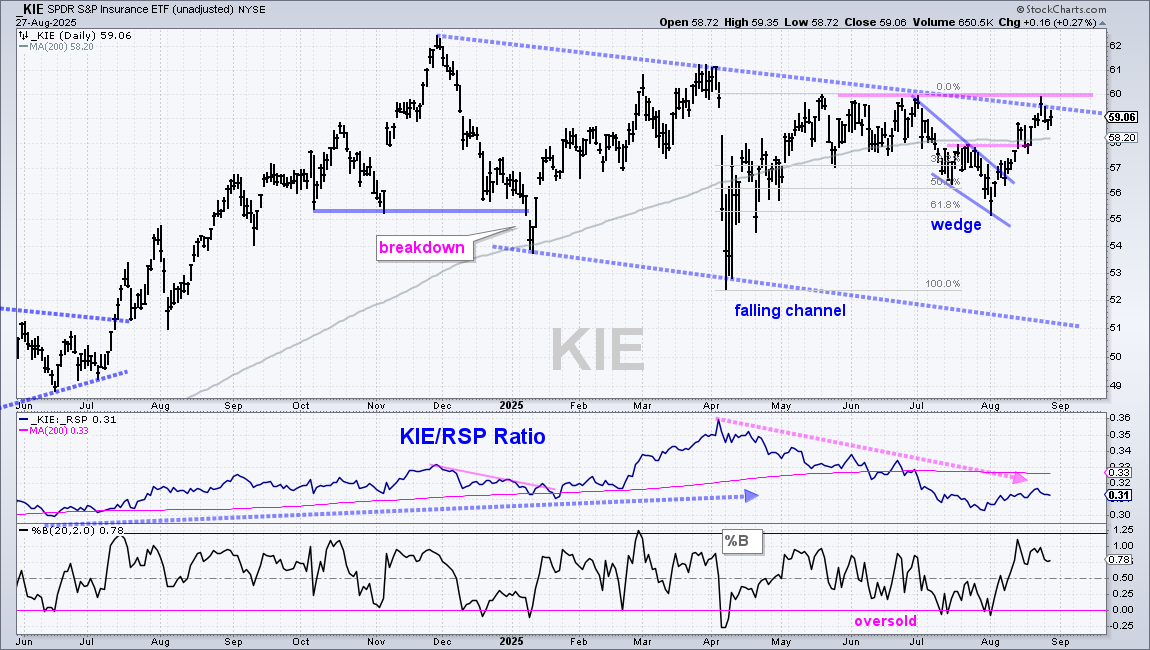
The next chart shows the Insurance ETF (KIE) in a downtrend since the breakdown in early January (lower lows and lower highs). KIE is showing signs of life with a wedge breakout in mid August and move above the 200-day SMA, which is turning up. Follow through above 60 would forge a higher high and reverse the long-term downtrend.
Utilities SPDR Forms Small Wedge
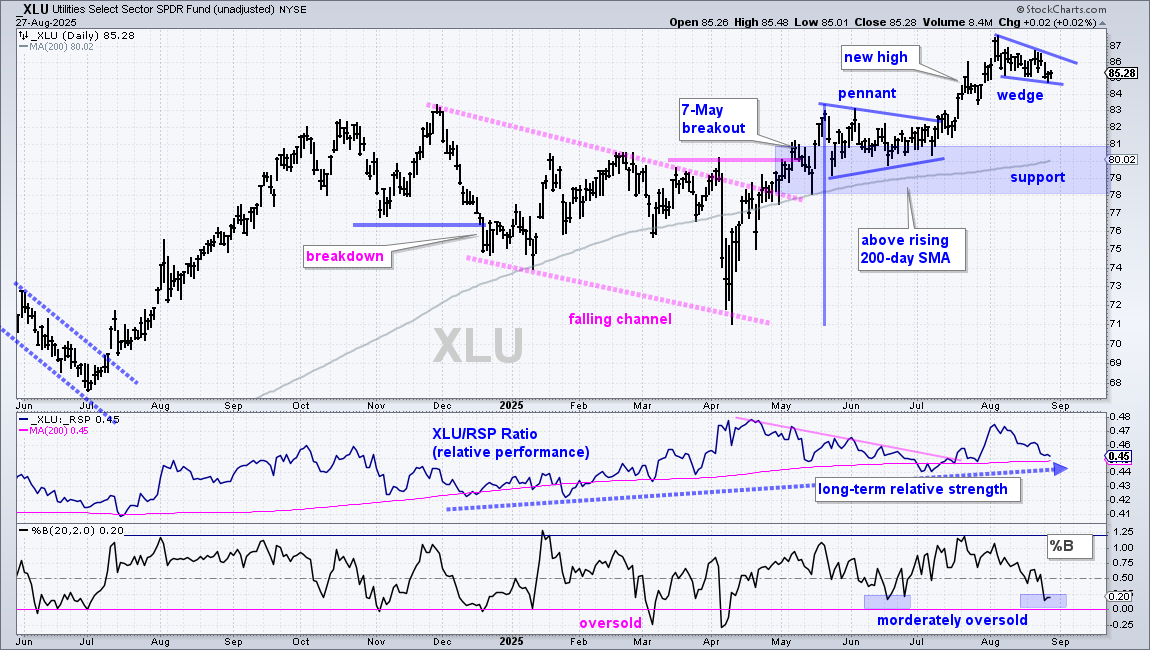
The next chart shows the Utilities SPDR (XLU) in an uptrend with new highs in July and early August. Price is also well above the rising trendline. Short-term, XLU surged from 81 to 88 (early July to early August), and then consolidated with a small wedge. This is a short-term bullish continuation pattern. Also notice that %B dipped into the 0-.25 zone, which shows a moderately oversold condition. XLU is setting up and a breakout at 87 would be bullish.
The small wedge is a short-term bullish continuation pattern. XLU could break out at 87 and then fall back below 85. This would result in a failed breakout and failed pattern. Long-term, such a pop and drop would not affect the uptrend. In fact, a move back to the 82-83 area could provide the next setup. Chartists can use short-term bullish continuation patterns to accumulate during an uptrend. Some of these may fail, but price action should resolve higher as long as the long-term uptrend is in place. Long-term support is set at 78.
DISCLAIMER: This content provided strictly for informational and educational purposes. It should not be interpreted as an offer to buy or sell any security, nor as a solicitation to engage in any investment activity. Nothing here constitutes a recommendation regarding any specific security, portfolio, transaction, or investment strategy.
At times, the author or affiliates may hold positions or interests in securities discussed. Any stocks or examples mentioned are not endorsements or suggestions to purchase. This material does not consider your individual financial goals or circumstances, and you should seek guidance from a qualified financial or investment adviser before making any trading or investment decisions.
Past performance does not guarantee future results.
Send feedback to support(at)trendinvestorpro.com or use the contact form.