Systematic Strategies and Next Level Technical Analysis
Market Conditions in One Chart – Plus XLV, IHI, XLU, KIE, URA, $BTCUSD, IBIT, BLOK
Arthur Hill, CMT
Archive
Use CRTL+P to Print
Headlines
Stock Market Conditions in One Chart
Healthcare SPDR Forms Pennant Near 200-day
Medical Devices ETF Renews Channel Breakout
Correction Extends for Utilities SPDR
Insurance ETF Forms Pennant above 200-day
Uranium ETF Breaks Channel/Flag Line
Bitcoin Goes for Flag Breakout
BlockChain ETF Breaks Pennant Line
The next report/video will be on Wednesday, September 3rd.
Today’s report starts with one paragraph and one chart summing up current market conditions, which are bullish. Techs are lagging the last five weeks, but other parts of the market are picking up the slack. Attention then turns to ETFs with bullish setups or signals. ETF related to Healthcare, Insurance and Blockchain have bullish pennants working. Channel breakouts are in play for Medical Devices and Uranium. Bitcoin is setting up with a bull flag.
Weight of the Evidence Remains Bullish
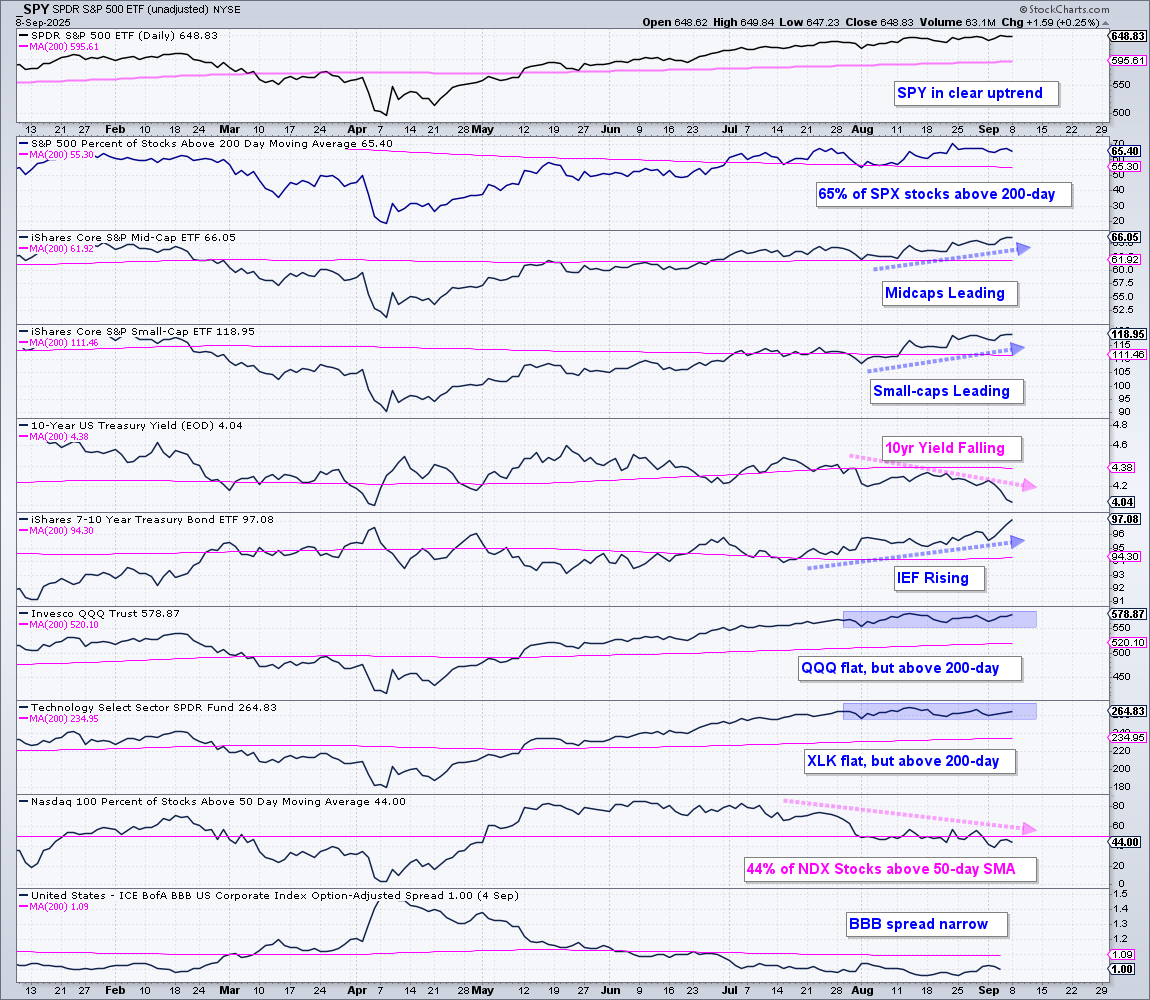
Here is one paragraph and one chart capturing stock market conditions. SPY remains in a strong uptrend with 65% of its components above their 200-day SMAs. Small-caps, mid-caps, banks and housing took the lead over the last five weeks as short and long-term rates fell sharply. Bond ETFs surged. QQQ and XLK are in long-term uptrends, but stalled and show relative weakness the last five weeks. Nevertheless, they have yet to break short-term support, which would signal the start of a correction. Nasdaq 100 stocks are under pressure short-term because only 44% are above their 50-day SMAs. Overall, stocks are in a bull market, the Fed is set to ease and yield spreads are narrow. Goldilocks would be proud.
Healthcare SPDR Forms Pennant Near 200-day
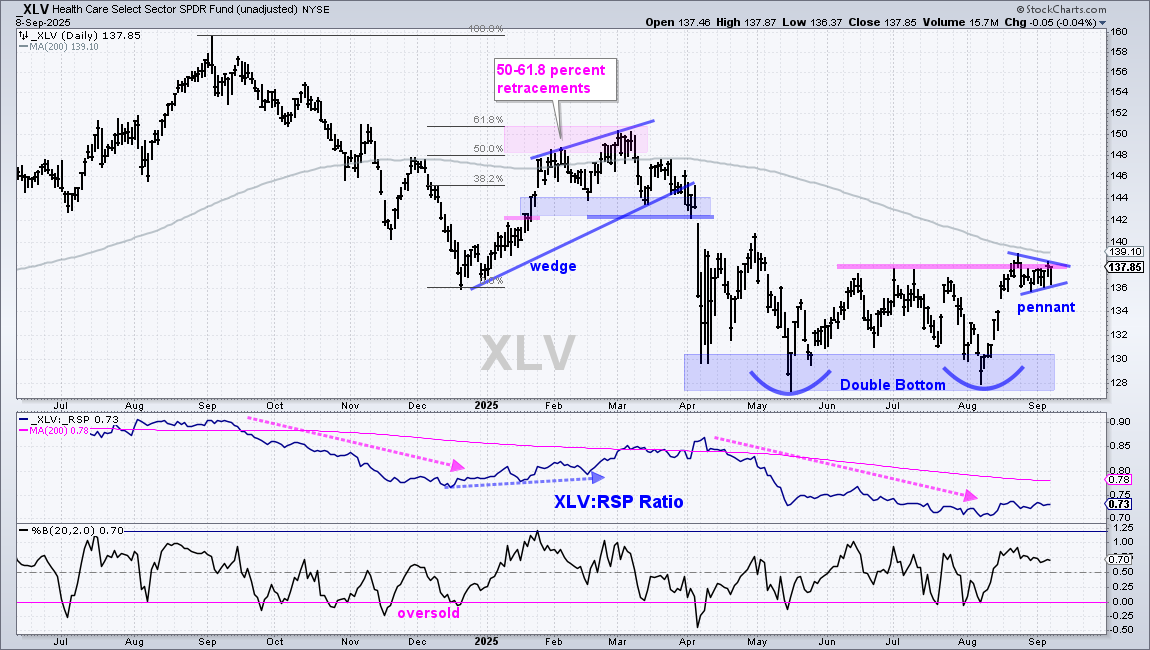
The Healthcare SPDR (XLV) is the weakest sector in 2025, but it is showing signs of life with a Double Bottom breakout. XLV formed two lows in the 128 area and surged to resistance with a strong move in mid August. Technically, XLV closed above the July high and broke resistance. Short-term, the ETF consolidated into early September with a pennant forming, which is a short-term bullish continuation pattern. A breakout would signal a continuation higher and likely break the 200-day SMA.
Medical Devices ETF Renews Channel Breakout
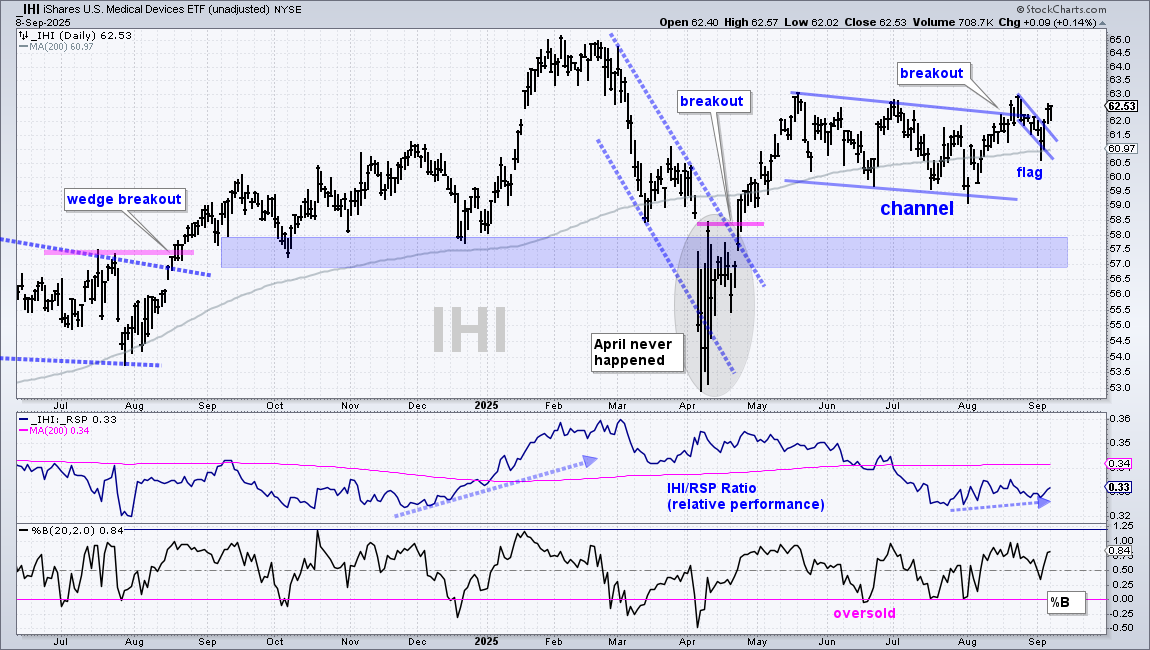
The Medical Devices ETF (IHI) is a subset of the Healthcare sector. Thus, strength in IHI would help XLV. IHI is in an uptrend with price just above the rising 200-day SMA (gray line). IHI surged with the rest of the market in April-May, but then moved into a consolidation pattern as technology led the market into July. I view this falling channel as a correction after the April-May surge. Moreover, the breakout in late August is bullish and opens the door to new highs. Short-term, I see a surge in August and a bull flag into early September, as well as a flag breakout. A close below 60 would argue for a re-evaluation of this bullish stance.
Insurance ETF Forms Pennant above 200-day
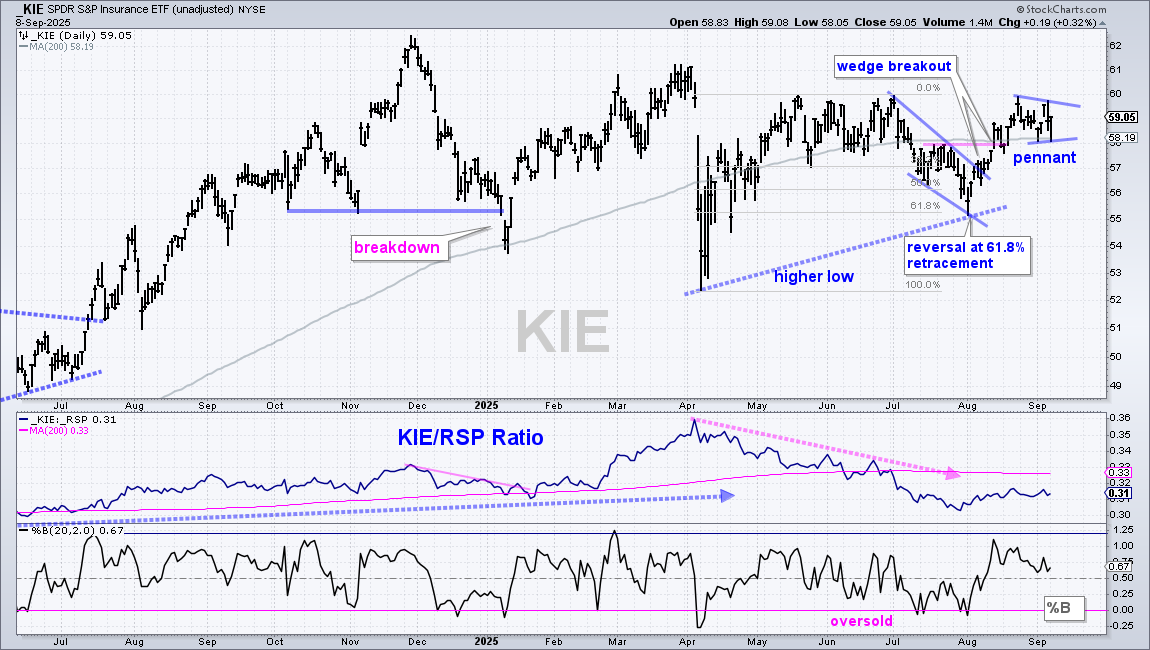
The next chart shows the Insurance ETF (KIE) with a bullish pennant after the August surge. Overall, I see the beginnings of an uptrend with a higher low from April to August and a wedge breakout in August. This breakout surge also broke the 200-day SMA. Short-term, KIE surged in August and then consolidated above the 200-day with a pennant. A breakout at 60 would signal a continuation higher. A close below 58 would negate the pennant and call for a re-evaluation.
Correction Extends for Utilities SPDR
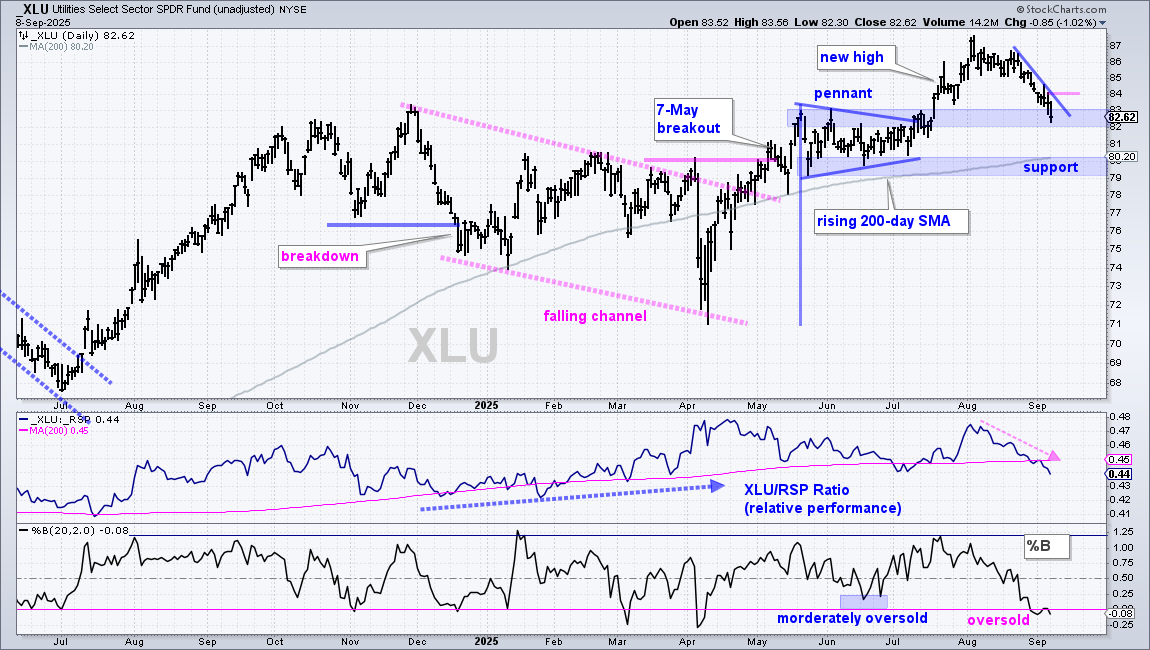
The Utilities SPDR (XLU) remains in corrective mode as the pullback extends. Corrections come in all shapes and sizes. They are a work in progress until a breakout or upside catalyst reverses the slide. XLU was setting up with a small wedge in August, but the decline extended the last two weeks. Even though the wedge is no more, I still see a correction within a long-term uptrend.
Large-term, XLU hit a new high in early August and remains well above the rising 200-day SMA. Short-term, the correction is hitting a support zone from broken resistance in the 82-83 area. %B also became oversold with two dips below zero in the last two weeks. The setup is here, we now need an upside catalyst. I am marking closing resistance at 84. A closing breakout here would be short-term bullish and provide the first clue that the correction is ending.
Uranium ETF Breaks Channel/Flag Line
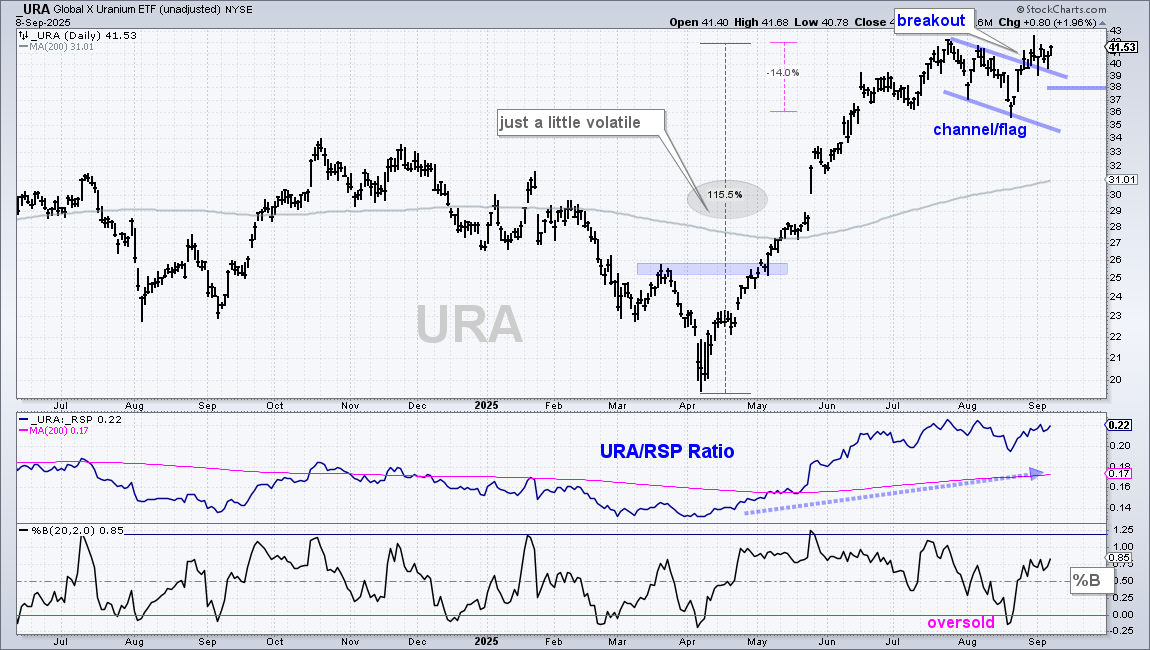
The holdings in the Uranium ETF (URA) are mostly stocks, but the ETF also holds some physical uranium. Top holdings are Cameco (21.6%), OKLO (10%), Physical Uranium (6.5%) and Uranium Energy Corp (6.34%). Before analyzing the chart, note that URA is highly volatile with above average risk. The ETF advanced 115% from early April to late July and then fell 14% during its correction.
Overall, the long-term trend is clearly up and URA shows relative strength. Short-term, the ETF corrected with a decline to around 36 and became oversold in late August as %B dipped below zero. URA formed a falling channel/flag and broke out with a surge into late August. The ETF then consolidated around the breakout zone. This breakout is holding and signals a continuation of the bigger uptrend. I am marking re-evaluation support at 38.
Bitcoin Goes for Flag Breakout
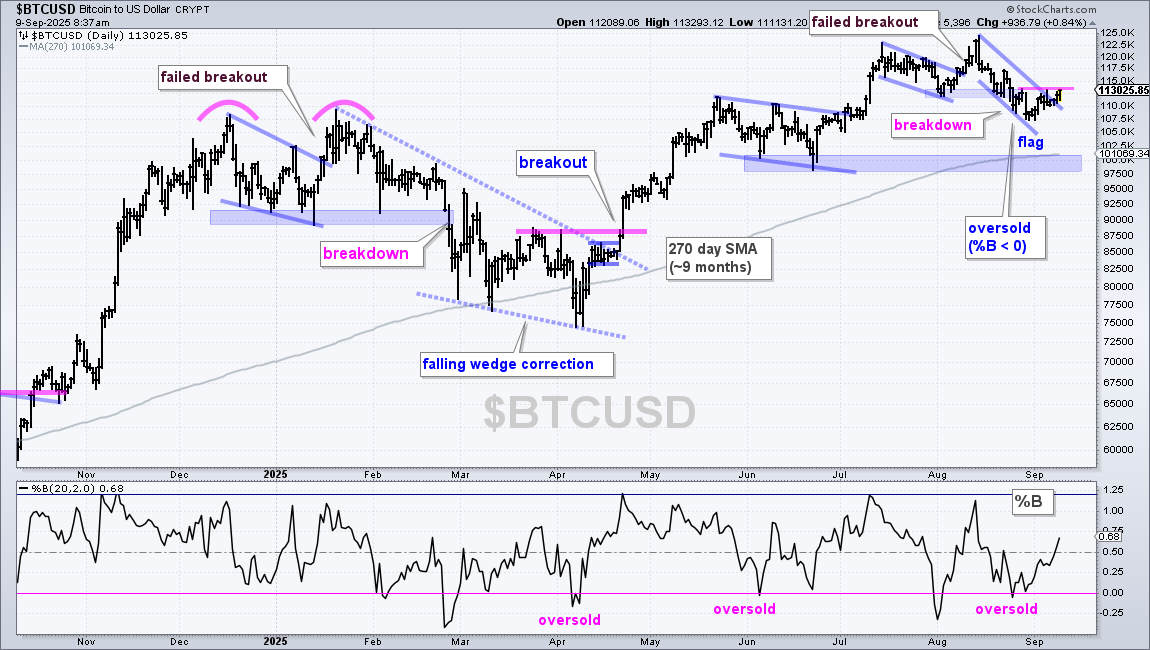
The first chart shows Bitcoin ($BTCUSD) in a long-term uptrend as it hit a new high in August and remains above the rising 270-day SMA. This uptrend has been in force since the April breakout. Most recently, Bitcoin broke out in mid August, but failed to hold this breakout and moved below the early August low. This move negated the July flag, but the decline is still viewed as a correction within a bigger uptrend. A falling flag formed into late August and %B became oversold with a dip below 0. This means a bullish setup is active. Bitcoin firmed up here in September and could be poised to break out. I am marking resistance at 113,000, a break of which would be bullish. I would then set re-evaluation support at 107,000.
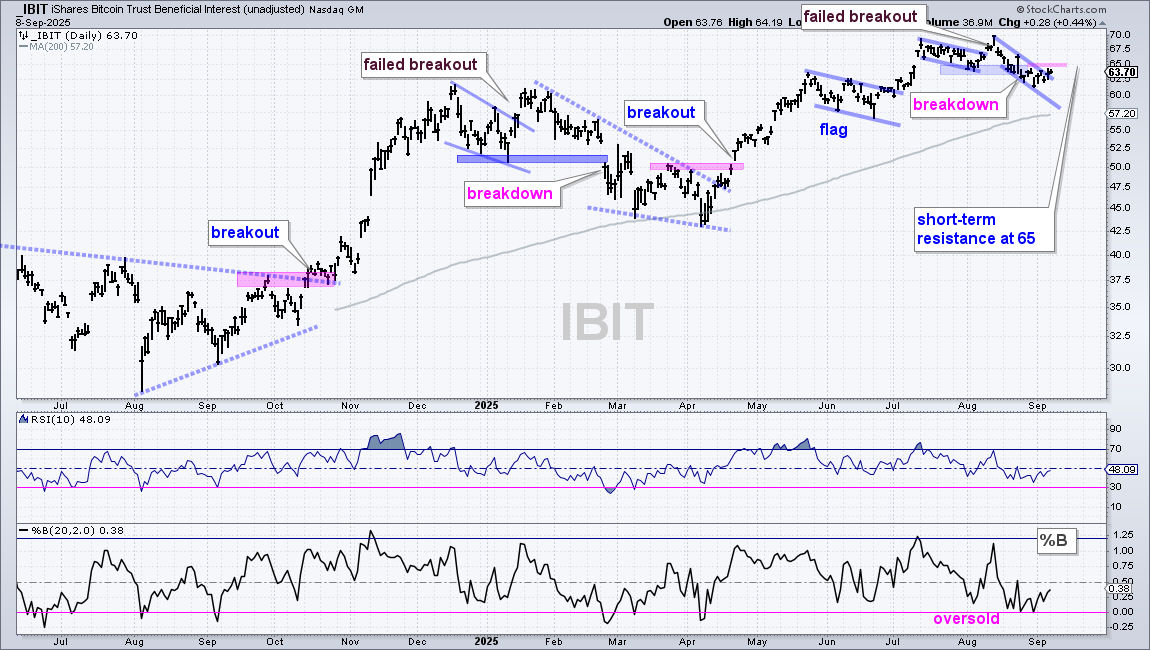
The next chart shows Bitcoin ETF (IBIT) with a falling flag into August and short-term resistance marked at 65.
BlockChain ETF Breaks Pennant Line
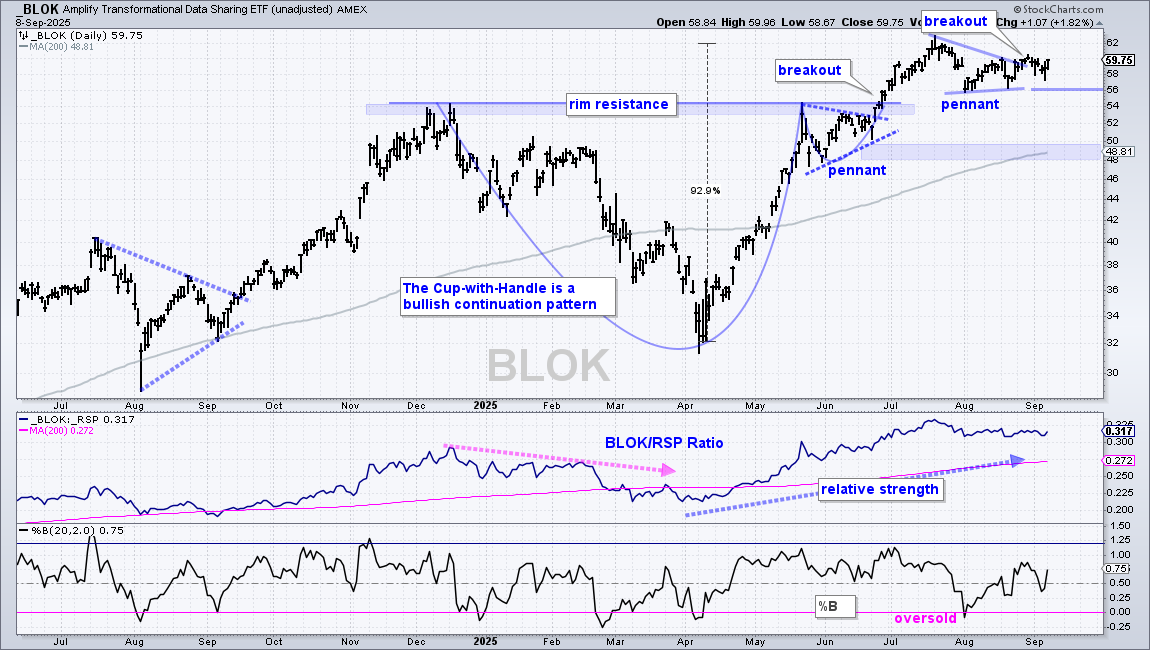
The Transformational Data Sharing ETF (BLOK), which I refer to as the BlockChain ETF, formed a bullish pennant above its breakout zone. First, a large cup-with-handle formed from December to June and the ETF broke rim resistance with a strong move into July. BLOK then consolidated into August with a pennant and broke the pennant line in late August. Even though the ETF has yet to follow through, I view this breakout as bullish. Moreover, it has yet to be proven otherwise. Support is set at 56 and a break here would negate the pennant.
DISCLAIMER: This content provided strictly for informational and educational purposes. It should not be interpreted as an offer to buy or sell any security, nor as a solicitation to engage in any investment activity. Nothing here constitutes a recommendation regarding any specific security, portfolio, transaction, or investment strategy.
At times, the author or affiliates may hold positions or interests in securities discussed. Any stocks or examples mentioned are not endorsements or suggestions to purchase. This material does not consider your individual financial goals or circumstances, and you should seek guidance from a qualified financial or investment adviser before making any trading or investment decisions.
Past performance does not guarantee future results.
Send feedback to support(at)trendinvestorpro.com or use the contact form.