Systematic Strategies and Next Level Technical Analysis
Gold/Silver Miners Go Parabolic – Copper Surges – Oil Sets Up – 4 Energy ETFs to Watch
Arthur Hill, CMT
Archive
Alternative ETFs, Equity ETFs
Use CRTL+P to Print
Headlines
A Bull Market for Commodities
Gold and Silver are in Trend-Monitoring Phase
Gold and Silver Miners Go Parabolic
Copper ETF Surges above Rising 200-day SMA
DBB Benefits from Copper Surge
Oil Bounces off Broken Resistance
Energy ETFs Breaking above their 200-day SMAs
Commodities are still an option, even in the AI age. Precious metals and their respective miners continue to lead the market with big moves since early August. Industrial metals are strong overall with copper catching a big bid this week. Energy is also showing promise as oil firms above its breakout zone and looks poised for a breakout. Today’s report will cover metals and oil. Note that I covered crypto and uranium on Tuesday. Symbols covered: GLD, SLV, GDX, SIL, CPER, DBB, USO, XLE, OIH, XOP, FCG.
A Bull Market for Commodities
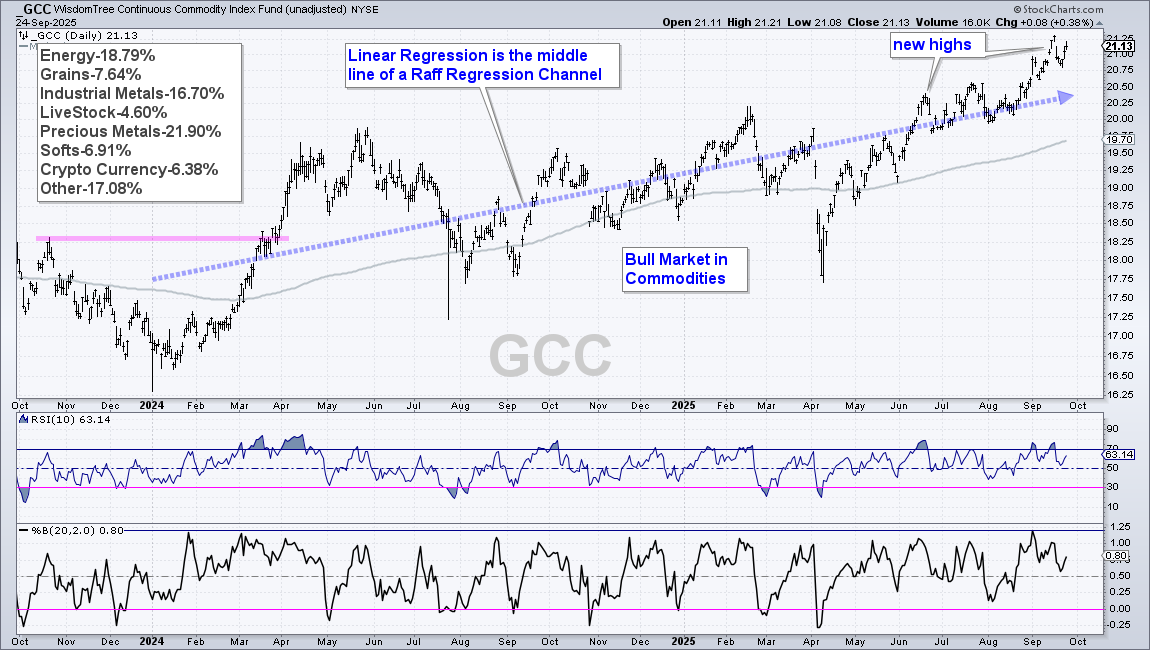
There is clearly a bull market in commodities. The chart below shows the Continuous Commodity ETF (GCC), which covers the main commodity groups and crypto. See the ETF holdings in the upper left of the chart. Overall, this ETF has been trending higher since the big breakout move in March 2024. The blue dashed line is a linear regression, which is the line of best fit for closing prices since January 2024. It is rising (uptrend) with GCC hitting new highs since June.
Gold and Silver are in Trend-Monitoring Phase
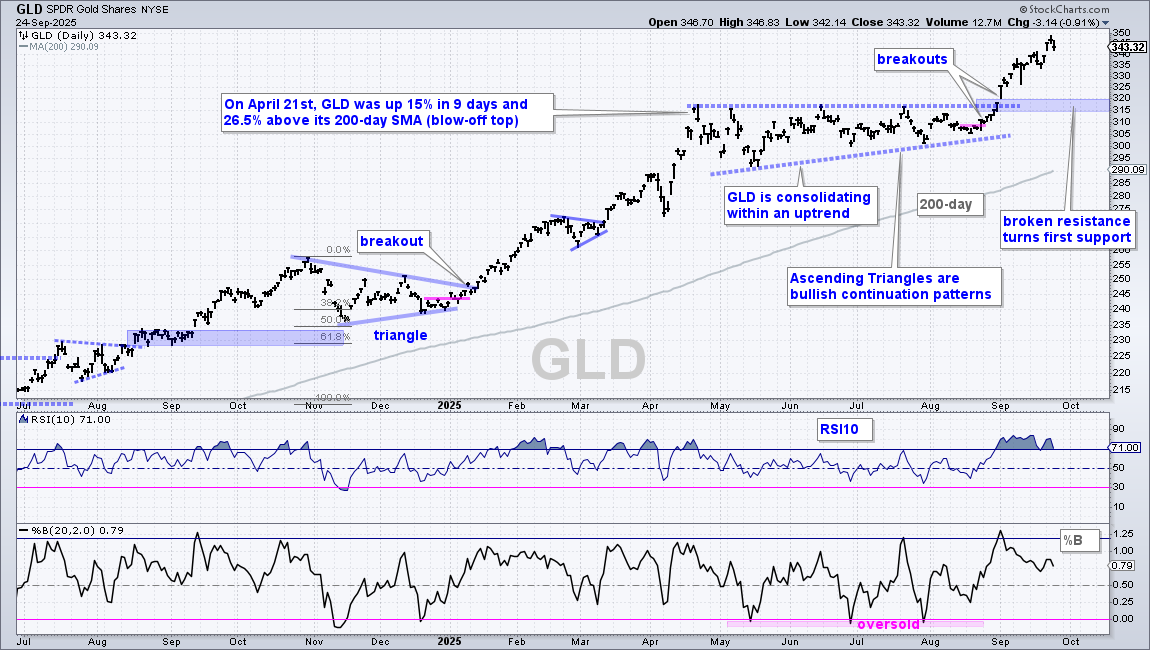
There is no change in the Gold SPDR (GLD), which is in the trend-monitoring phase since the Ascending Triangle breakout on September 2nd. This means there is no setup right now, just a confirmed uptrend. Broken resistance in the 315-320 area turns first support should we see a pullback. Given strength in GLD, support could be slightly higher because buyers may appear as soon as a dip occurs (perhaps 325-330).
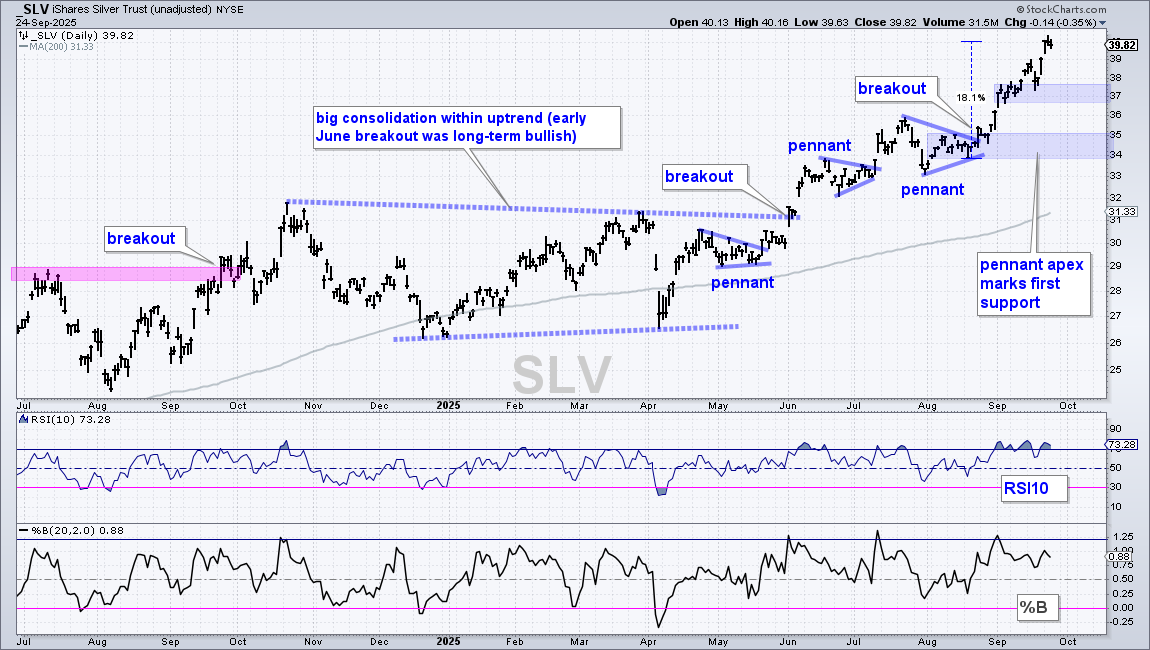
The next chart shows the Silver ETF (SLV) hitting new highs this week. SLV is also in the trend-monitoring phase (no setup and confirmed uptrend). The last setup was the pennant in August and the breakout in late August. SLV is up around 18% the last five weeks and short-term overbought, which is a sign of strong buying pressure. Nevertheless, SLV is looking extended and ripe for a rest. First support is set in the 37-38 area and second support in the 34-35 area.
Gold and Silver Miners Go Parabolic
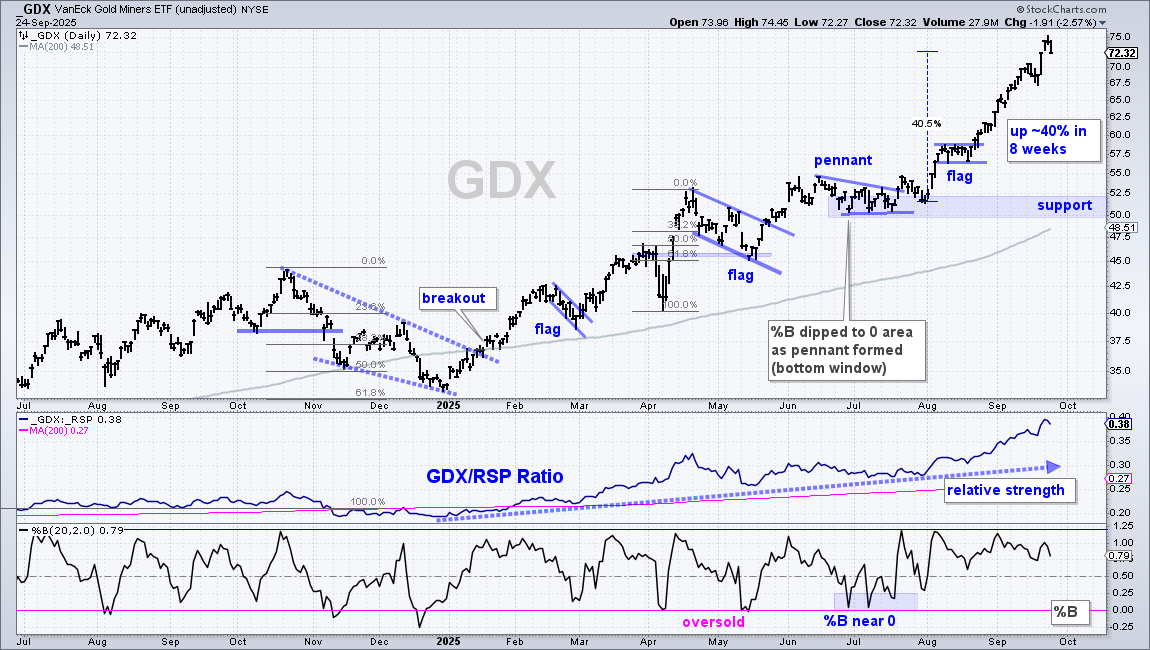
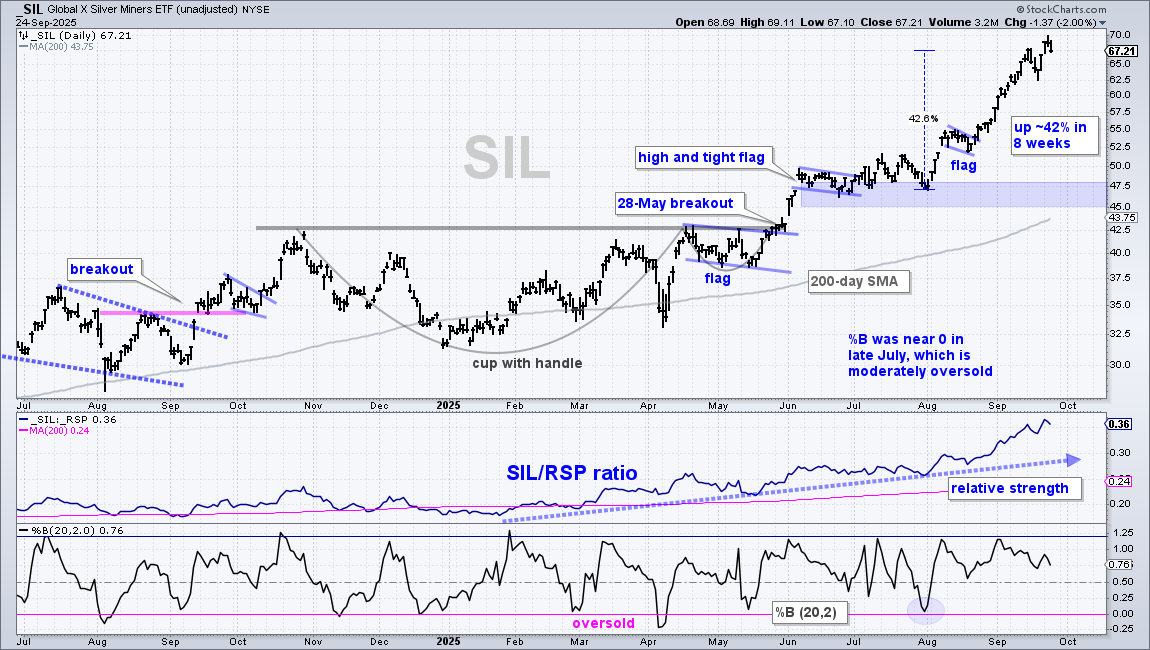
The Gold Miners ETF (GDX) and the Silver Miners ETF (SIL) went parabolic with massive gains since August 1st. GDX is up around 40% and SIL is up 42%, in just eight weeks. Keep in mind that volatility cuts both ways: up and down. Silver and silver miners are notorious for their violent move. Both GDX and SIL are in leading uptrends, but looking extended and ripe for a corrective period. This is perhaps a good time to take some money off the table by closing a portion of any position.
Copper ETF Surges above Rising 200-day SMA
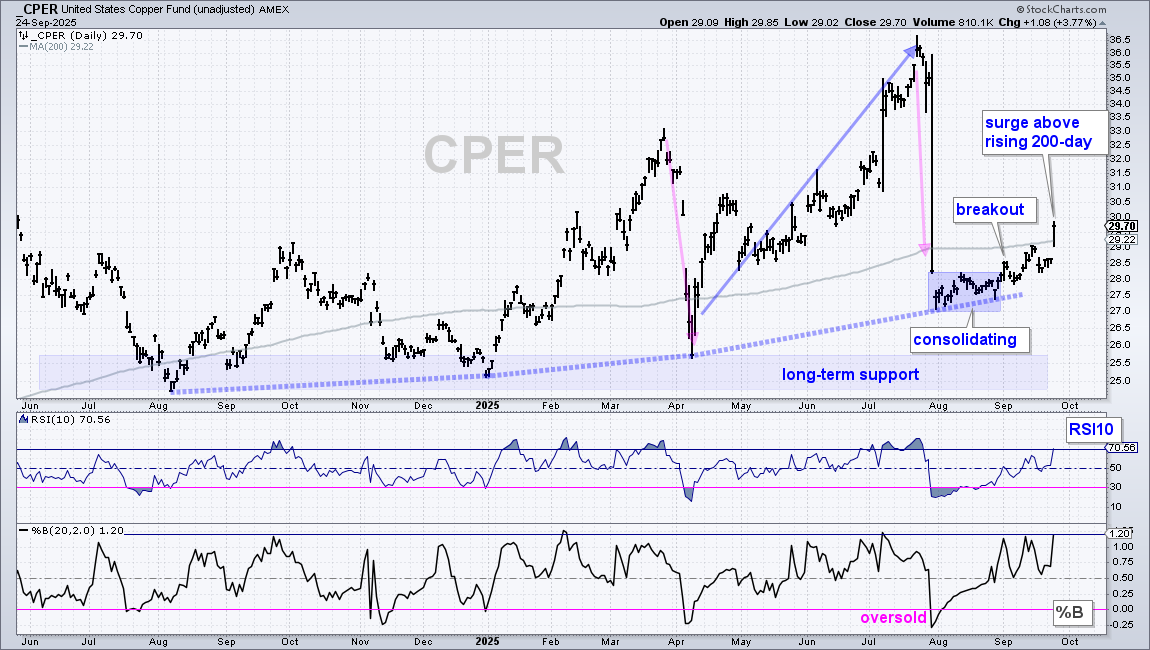
The Copper ETF (CPER) came to life in September with a breakout at the beginning of the month (noted here) and a 3.77% surge on Wednesday. As noted after the July plunge, CPER was still in a long-term uptrend with higher highs (September, March, July) and higher lows (blue dashed lines). The ETF plunged in late July, but managed to stabilize above the April low and trigger a short-term breakout on September 2nd. With a big surge this week, CPER is back above the rising 200-day SMA and in a confirmed uptrend.
DBB Benefits from Copper Surge
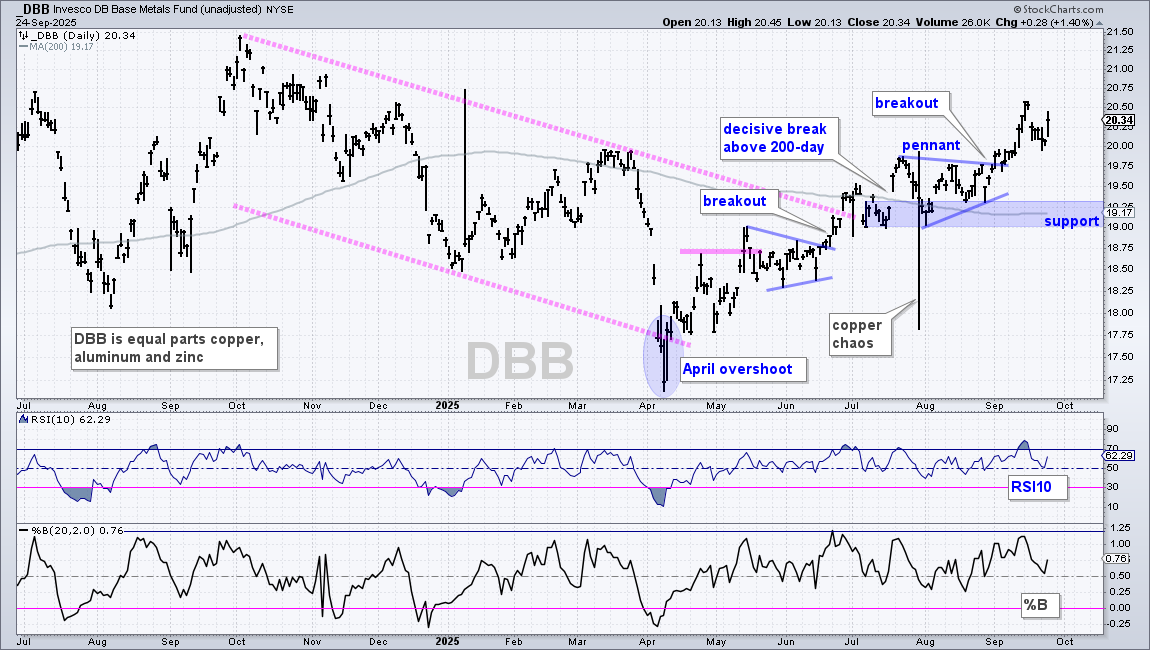
The DB Base Metals ETF (DBB) is benefitting from the surge in copper because it is equal parts copper, aluminum and zinc. DBB has been on my radar since the pennant breakout in late June. Since this breakout, the ETF has worked its way higher and hit its highest close of the year in September. The August pennant was the last setup and the early September breakout was the last signal. I do not see a setup now, just a confirmed uptrend (trend-monitoring phase). The August lows mark support in the 19-19.25 area.
Oil Bounces off Broken Resistance
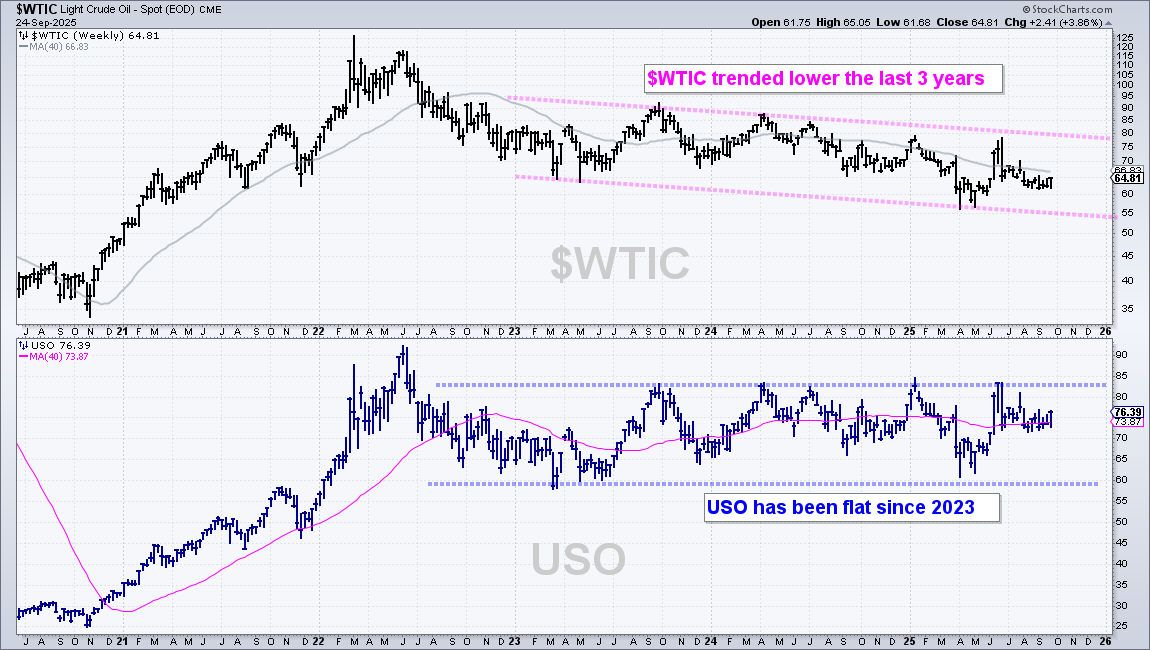
It has been a long time since I covered oil and the US Oil Fund (USO). Long-term, Spot Light Crude Oil ($WTIC) remains in a downtrend since peaking near $120 in early 2022. On the chart below, $WTIC is in a slow downtrend since 2023 (pink lines). The lower window shows the US Oil Fund (USO) in a trading range since 2023 (blue lines). Note that USO uses futures contracts and swaps to track daily price movements in light crude. It is not a perfect tracker, but does a pretty good job.
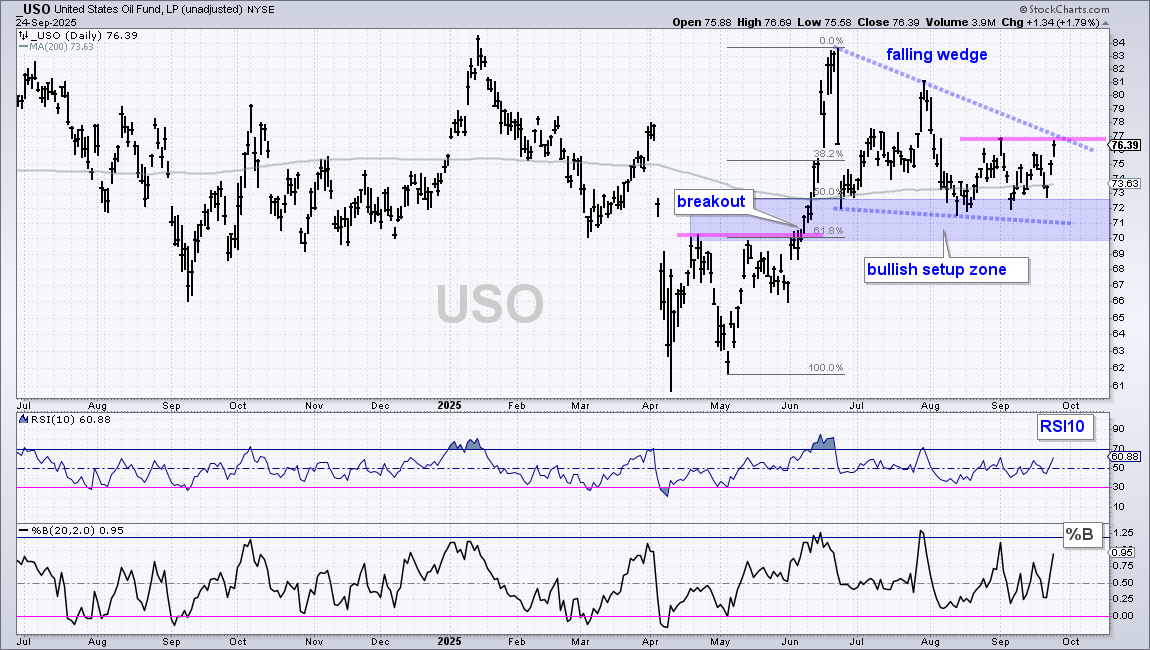
The next chart shows daily bars for USO with a bullish setup in the making. USO surged from May to June and then fell back with a falling wedge the last three months. This decline retraced 50-61.8% of the surge and firmed just above the breakout level. The blue shading marks a bullish setup zone in the 70-72 area, which is an area to watch for firming and a trend reversal. After an advance, it is normal to retrace half and return to the resistance breakout. The falling wedge defines the downtrend with resistance at 77. A breakout would signal an end to the correction and argue for a move to the mid 80s.
Energy ETFs Breaking above their 200-day SMAs
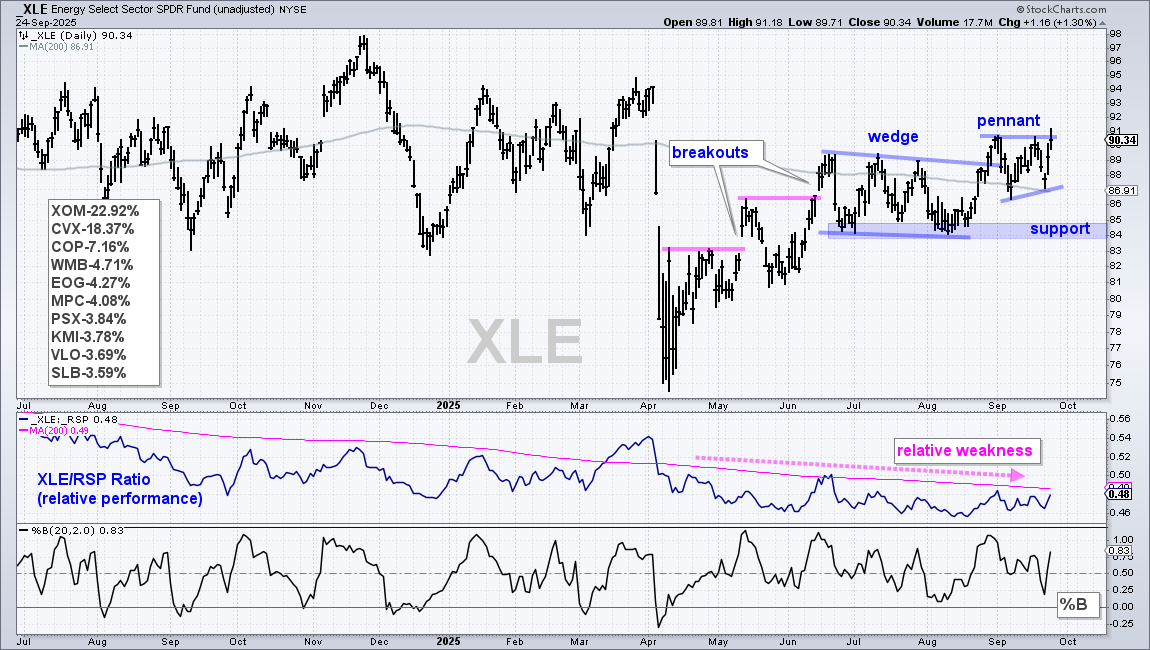
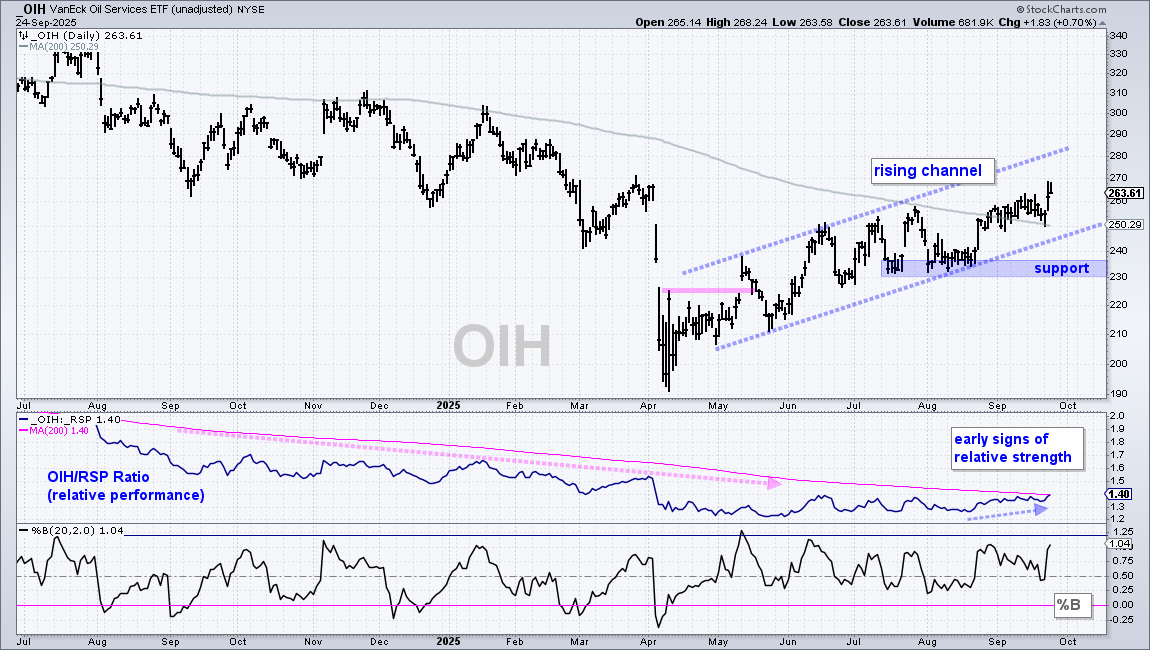
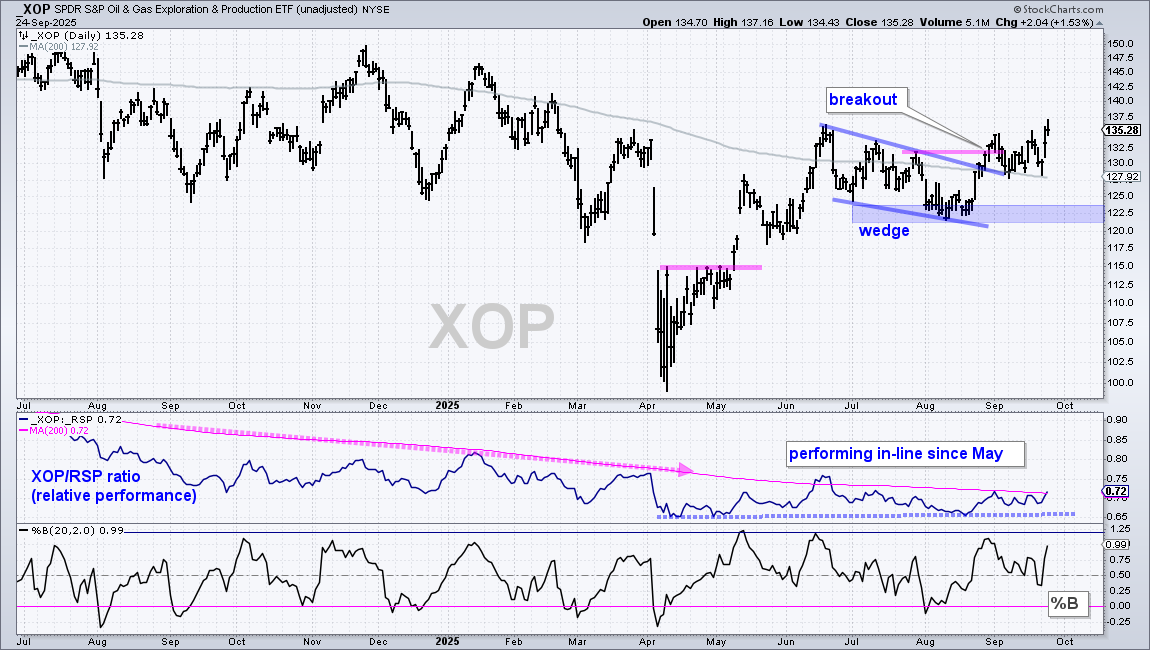
The next charts show four energy-related ETFs breaking above their 200-day SMAs over the last few weeks. These 200-day SMAs are still falling and their price-relatives are also in long-term downtrends (relative weakness). However, positive signs are emerging for this beleaguered group. There is pretty much no diversification benefit from owning more than one name because they are positively correlated. All four tend to move in the same direction.
The next chart shows the Energy SPDR (XLE), which is dominated by the major integrated energy names. XOM 22.92%, CVX 18.37% and COP 7.16% account for 48.5% of the ETF. XLE surged with the market from early April to early June and then worked its way higher the last three months. There is an uptrend with the successful breakouts (higher highs), but XLE does not show relative strength. The middle window shows the price-relative (XLE/RSP ratio) falling since April. Nevertheless, the price chart sports an uptrend with support marked in the 84-85 area.
The next chart shows the Oil Services ETF (OIH) with a rising channel defining the higher highs and higher lows since the mid May breakout (uptrend). OIH extended higher and broke above the 200-day SMA in September. The July-August lows mark support in the 230-236 area. A close below this level would reverse the uptrend. The middle window shows the price-relative falling into May, flattening out for a few months and turning up in late August. This is perhaps the start of relative strength for the beaten down group.
The next chart shows the Oil & Gas Exploration & Production ETF (XOP) with a wedge breakout in late August and price holding above the 200-day SMA in September. XOP is perhaps the strongest of the four. The July-August lows mark support in the 121-123 area. A close below support would call for a re-evaluation.
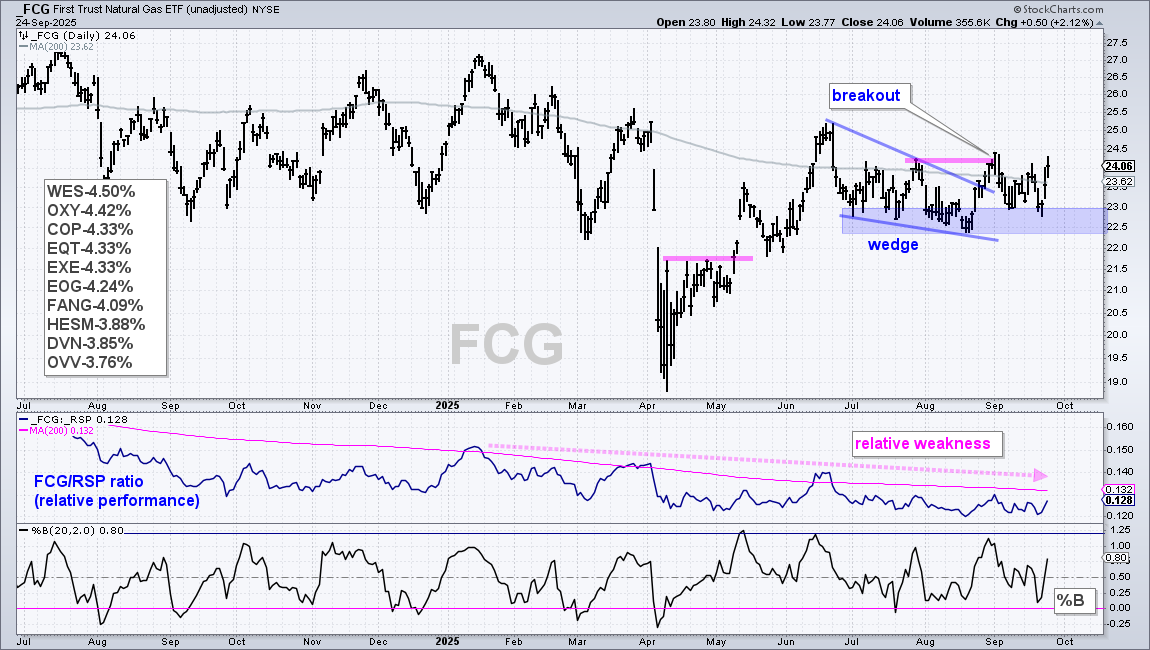
The next chart shows the Natural Gas ETF (FCG) with a surge into mid June, a falling wedge into August and a wedge breakout in early September. FCG did not follow through on the wedge breakout, but is holding just above the August low and in an uptrend overall. The July-September lows mark support in the 22.3-23 area. A close below the August low would call for a re-evaluation.
DISCLAIMER: This content provided strictly for informational and educational purposes. It should not be interpreted as an offer to buy or sell any security, nor as a solicitation to engage in any investment activity. Nothing here constitutes a recommendation regarding any specific security, portfolio, transaction, or investment strategy.
At times, the author or affiliates may hold positions or interests in securities discussed. Any stocks or examples mentioned are not endorsements or suggestions to purchase. This material does not consider your individual financial goals or circumstances, and you should seek guidance from a qualified financial or investment adviser before making any trading or investment decisions.
Past performance does not guarantee future results.
Send feedback to support(at)trendinvestorpro.com or use the contact form.