")
As its name implies, the Zweig Breadth Thrust quantifies bullish breadth thrusts using a setup level and a signal level. The setup occurs when the 10-day EMA of Advances / (Advances + Declines) dips below .40 and the bullish signal triggers when this indicators surges above .615 within 10 days of the setup. Marty Zweig, creator of the indicator, used NYSE breadth data because that was the best breadth data at the time.
There are two tweaks to my version. First, I am using breadth data from the S&P 500 because one third of its components are from the Nasdaq. Using only NYSE breadth data means you are not playing with a full deck. Second, I am relaxing the 10-day requirement between the setup and the signal. A setup and signal is enough reason to turn bullish.
Amibroker is my main charting platform and Norgate is my data provider. Norgate has some excellent breadth data going back over 20 years. This data covers the S&P 500, S&P MidCap 400, S&P SmallCap 600, Nasdaq 100, Russell 2000, Russell 1000 and Russell 3000. Amibroker is great for building and testing strategies, but their charts are not the prettiest. Can’t have it all!
Zweig Breadth Thrust - Raw Readings
The setup occurs when the 10-day EMA of Advances / (Advances + Declines) dips below .40 (40%). A move below 40% means the percentage of advances is quite low and the market experienced broad selling pressure. This is also similar to a bearish breadth thrust. The red arrows on the price chart and red indicator bars show when the Zweig Breadth Thrust is below .40.
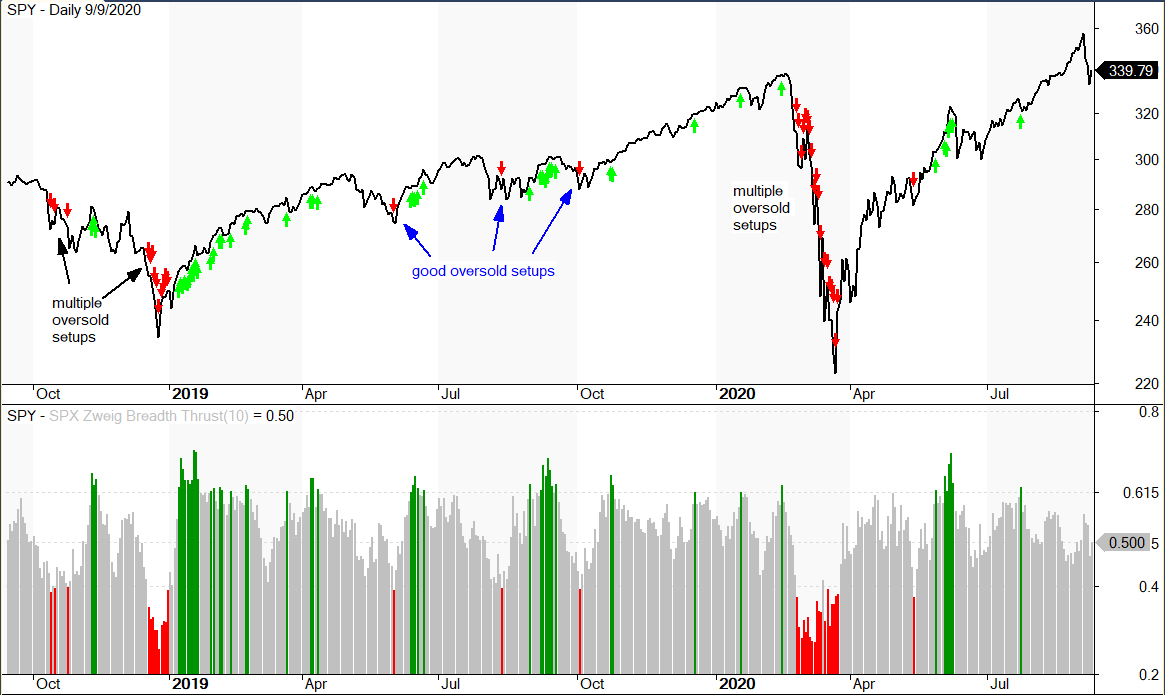
The chart above extends from September 2018 to September 2020. We can see three single oversold setups in the middle that marked lows after short pullbacks. We can also see multiple oversold setups in the third quarter of 2019 (left side) and during the covid crash. This is when stocks became oversold and remained oversold. The plunge below .40 shows strong selling pressure that needs to be countered with a bullish breadth thrust. The inability to counter this selling pressure shows underlying weakness that could lead to lower prices, be it a correction or more.
Zweig Breadth Thrust - Setups to Signals
The next chart shows the setup/signal pairs. First there is the setup with a move below .40 (red arrows/lines) and then there is the signal with a move above .615 (green arrows/lines). Successive setup and signal arrows are not shown. The Zweig Breadth Thrust dipped below .40 three days in mid September and remains well below the bullish signal threshold, which is .615. The bounce over the last four days seems strong, but it has yet to affect the Zweig Breadth Thrust and this means we need to see follow through before taking this bounce seriously.
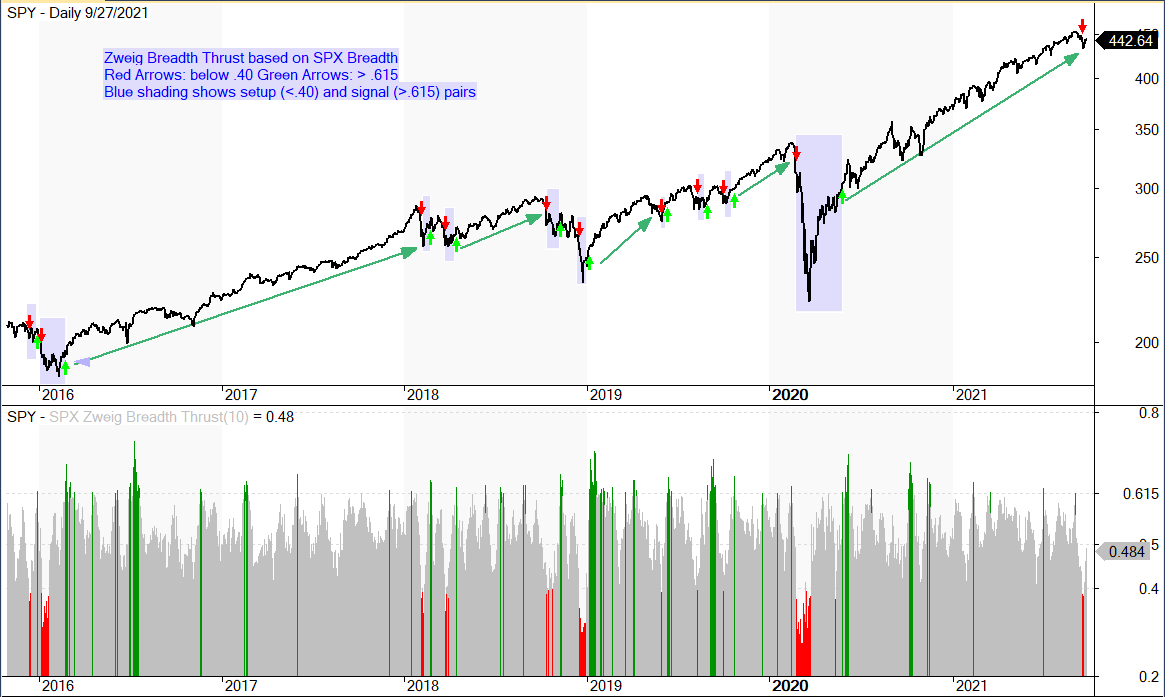
The blue shadings on the chart above highlight setup/signal pairs since late 2015. There were some whipsaws, but the S&P 500 Zweig Breadth Thrust caught five good trends (green lines). Note that Zweig did not suggest that a move below .40 represents a sell signal and instead used the indicator purely for bullish breadth thrusts. Nevertheless, a move below .40 shows serious weakness in upside participation (advances) and can also act as a bearish breadth thrust. As such, I used a move below .40 as an exit signal in backtesting and it worked fairly well.
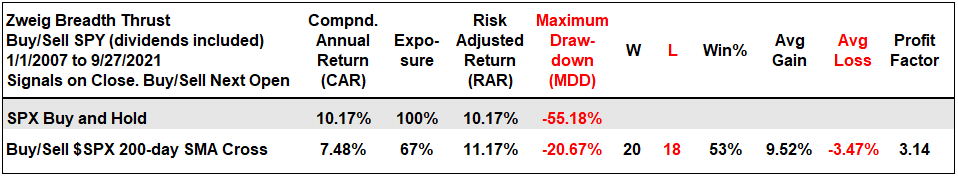
The image above shows backtest results since 2007. Exposure was just 67% so the strategy was inactive 33% of the time. When active, 53% of signals were winners and the Average Gain was more than three times the Average Loss. Even thought the Compound Annual Return did not beat buy-and-hold, the Risk-Adjusted Return for the Zweig Breadth Thrust was higher and the Maximum Drawdown was much lower.
At this point, I think the bears hit the market with a pretty hard right hook in mid September. It was not enough to derail the bull market, but it was enough to pushed the Zweig Breadth Thrust below .40 for the first time since May 2020. Even though the market got an oversold bounce, I do not think the corrective process is finished just yet. At the very least, we need to see the bearish Zweig Breadth Thrust reversed with a surge above .615