")
The Fed has yet to actually start tapering, but dropped some hints that it would if the economy continues to strengthen. The bond market, which tends to lead the Fed, reacted violently as the 20+ Yr Treasury Bond ETF fell over 2% and the 10-yr Treasury Yield broke above its summer highs. Even though it is a bit early to call for another rotation, the surge in the 10-yr Treasury Yield carried over to small-caps, mid-caps and banks, which led the market on Thursday.
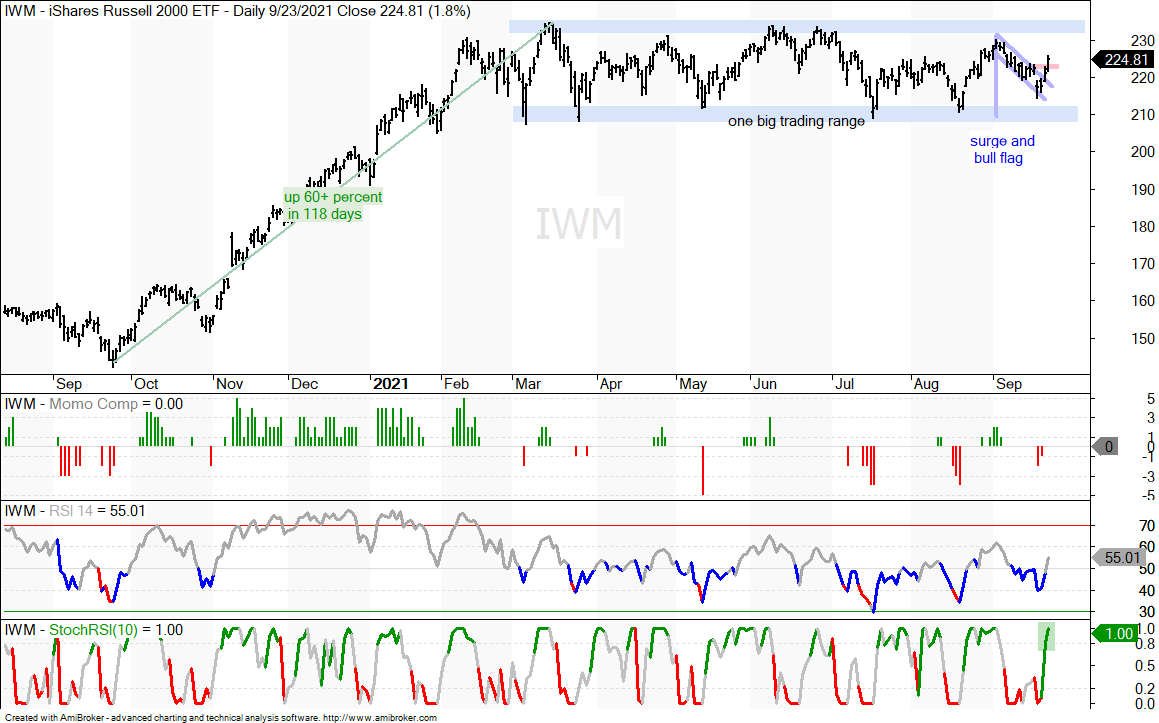
IWM Surges
As noted in Thursday’s commentary, trend indicators are not much help when there is an extended trading range because the signals whipsaw. One signal will eventually lead to a sustained trend, but it can be painful absorbing those whipsaws. IWM has been in a trading range since March (six months) and we have seen three trend signals in as many months. Ugh! Ignoring the trend signals, note that the swing within this trading range turned up as IWM broke out of a bull flag and StochRSI surged above .80 this week. This is the first step to a possibly bigger breakout.
%Above SMA Indicators Surge
Breadth improved sharply over the last two days as the percentage of S&P 500 stocks above the 100, 150 and 200 day SMAs jumped around 10%, in absolute terms. For example, SPX %Above 200-day SMA surged from 62.5% to 72%. These jumps are comparable to the jumps seen in September-October 2020 (green shading). This is the early sign that we may see a shift into small and mid-caps. We also saw similar pops in June (blue rectangles). In both cases, June and Sep-Oct, there were double dips as breadth and the S&P 500 pulled back after the first pop.
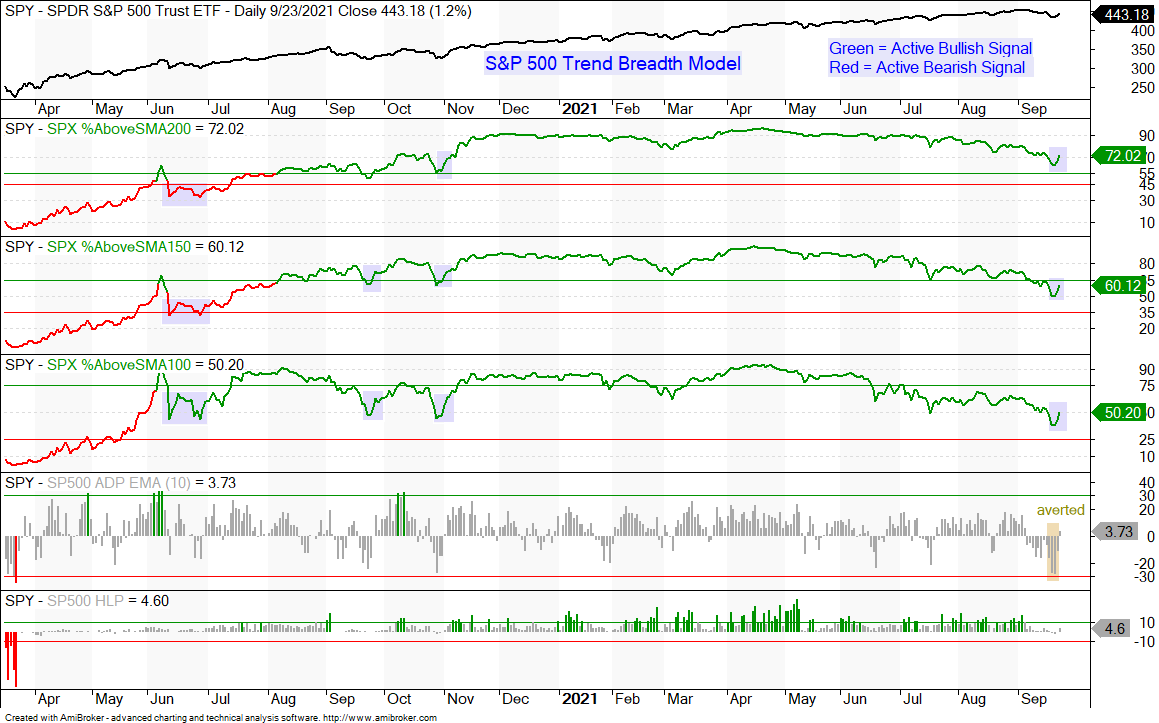
Selling pressure was quite intense from September 7th to 21st (12 trading days), but not enough to trigger a bearish breadth thrust. The 10-day EMA of SPX Advance-Decline Percent triggers a bullish breadth thrust with a move above +30% and a bearish breadth thrust with a move below -30%. The indicator plunged to -27.8% on Monday and -28.5% on Tuesday (yellow shading). This fell short of triggering a bearish breadth thrust.
Other Notes
The Composite Breadth Model (CBM) remains bullish and has been bullish since May 2020 (see Market Regime page for charts covering the CBM, yield spreads and Fed balance sheet).
Investment grade and junk grade corporate bond spreads flattened at low levels since July and there are no signs of stress in the credit markets.
The Fed balance sheet expanded by $41 billion and hit another all time high. No signs of tapering here.
The 10-yr Treasury Yield surged after the Fed meeting and broke its summer highs. This means TLT could be peaking near its 50% retracement.
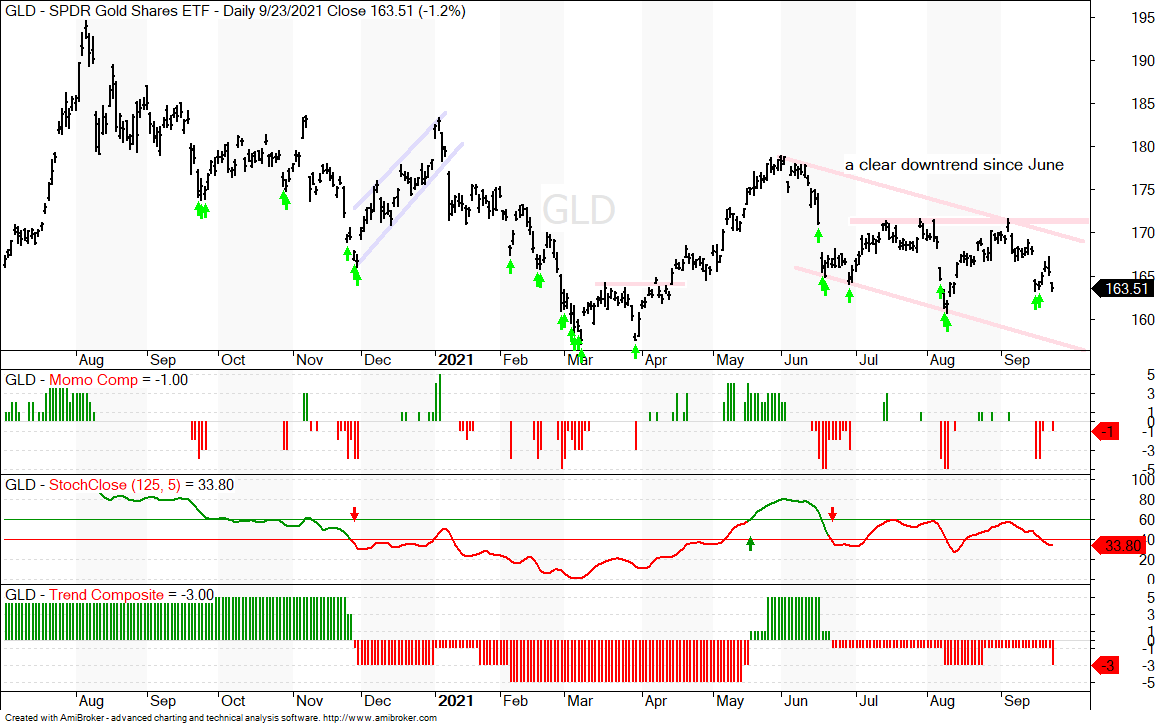
The Gold SPDR (GLD) is in a long-term downtrend.
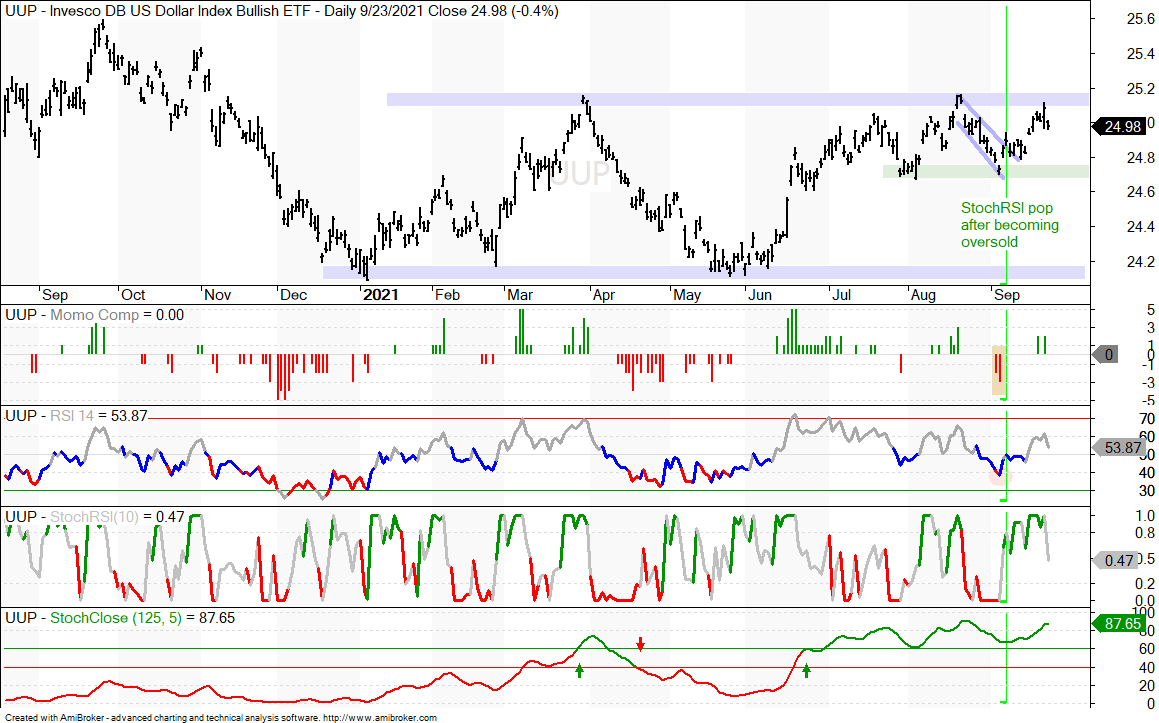
The Dollar Bullish ETF (UUP) is in a long-term uptrend and near the upper end of its 2021 range.
Oil is in a long-term uptrend and extending on a channel breakout.
10-Yr Yield Breaks Out as TLT Falls Hard
I was working under the assumption that the 20+ Yr Treasury Bond ETF (TLT) is in an uptrend because StochClose turned bullish on July 8th (green line). TLT formed a consolidation from mid July to early September and broke out of this consolidation on September 14th. Well, this breakout was turned on its head as TLT fell 2.26% on Thursday. Technically, TLT is still in a support zone from the July-August consolidation, but note that the ETF could be reversing after a 50% retracement of the prior decline (August 2020 to March 2021). This implies that the recent advance (March to September) is a counter-trend move within a larger downtrend. A support break at 145 would be bearish and argue for lower bond prices, and higher yields.
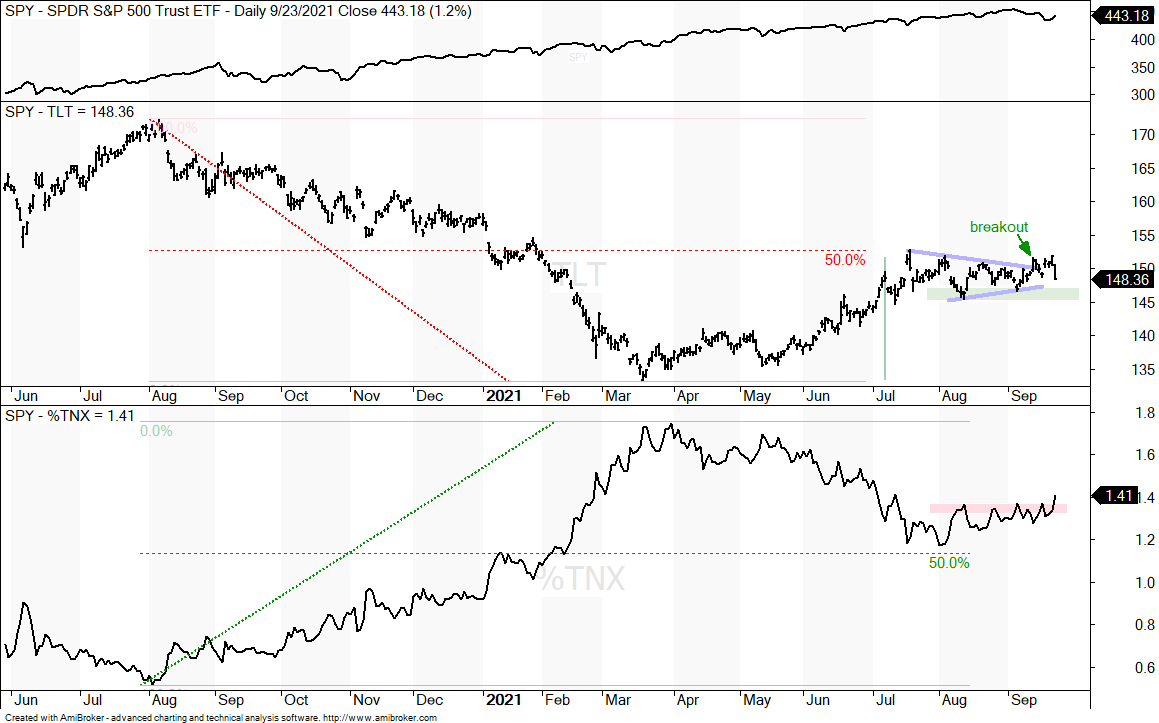
The bottom window shows the 10-yr Treasury Yield reversing near the 50% retracement in early August and breaking above its summer highs this week. Thus, it looks like the advance from August 2020 to March 2021 was an impulse move (primary trend) and the decline into July was a corrective move (secondary decline). This week’s breakout is bullish and argues for higher yields.
Regional Bank ETF Follows 10-yr Yield
The Regional Bank ETF (KRE) surged 1.9% on Wednesday and followed the 10-yr Treasury Yield higher. Note that the six month trend is still down for KRE (StochClose and Trend Composite). The price chart also shows a falling channel since the March high. This is one of these “chart” situations where the extended correction could be due to the size of the prior advance (112%). Such an absurd advance deserves an extended correction. Moreover, notice that the channel retraced one third of the prior advance, which is at the shallow end for a correction within a bigger uptrend. The pattern (falling channel) is also typical for corrections within bigger uptrends. The green shading shows KRE gapping down on Monday and filling this gap with a strong move on Thursday. This reverses the downswing within the falling channel, but is not enough to reverse the overall downtrend.
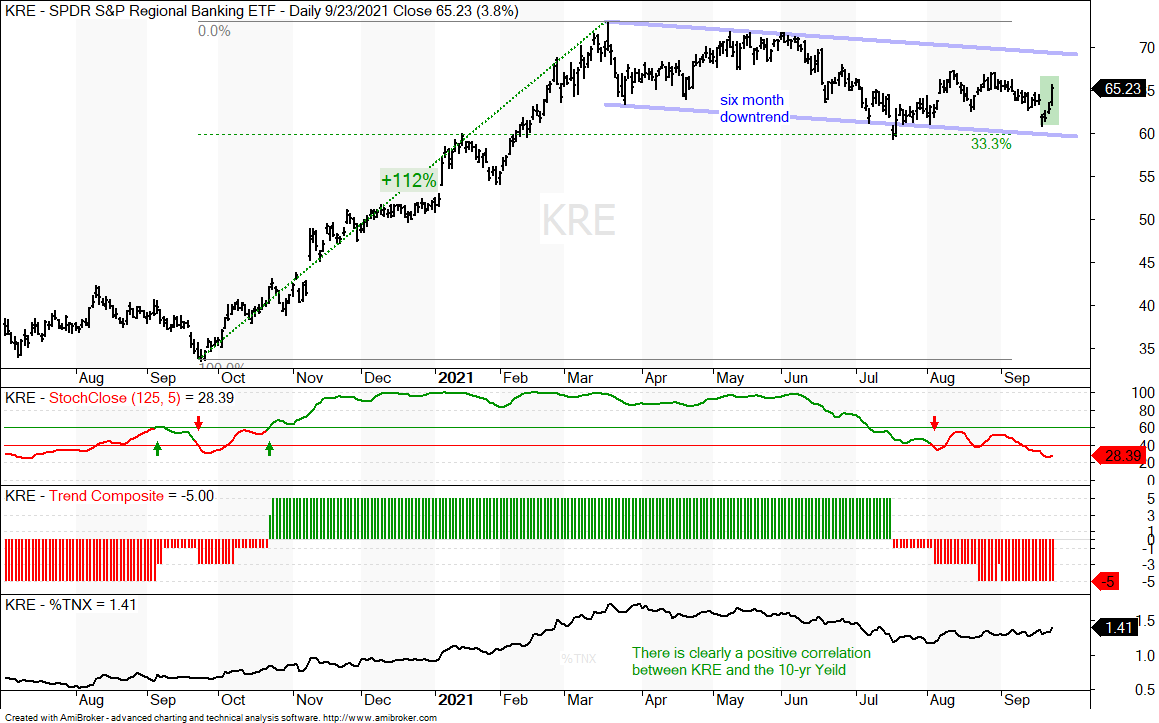
Rules are rules, but I will be the first to admit that sometimes intuition is enough to bend a rule. This makes my discretionary trading 80% systematic and 20% intuitive. Overall, my strategy is to take uptrend signals and look for pullbacks within uptrends. An uptrend has yet to trigger for KRE so it is off my radar right now. Note that there are more than 79 ETFs in the Core list (129) with uptrends right now and these are deemed stronger than KRE. This week’s pop in KRE is short-term bullish, as is the upturn in the 10-yr Treasury Yield, which is positively correlated to KRE. My intuition also tells me that KRE is often more trouble than it is worth and Fintech is the future.
Gold Extends Downtrend
The Gold SPDR (GLD) fell sharply on Thursday as bonds plunged and Treasury yields surged. The Dollar also fell sharply on Thursday, but this did not put a bid in bullion. The trend is down with StochClose and the Trend Composite turning bearish around June 23rd. The price chart also sports a clear falling channel since June and a downtrend since the August 2020 high. The green arrows show when the Momentum Composite dips to -3 or lower.
Dollar Hits Top of Range
The cup is still half full for the Dollar Bullish ETF (UUP) because StochClose is bullish and price is near the top of the 2021 range. UUP became oversold on September 3rd as the Momentum Composite dipped to -3 (yellow shading) and RSI dipped below 40 (red shading). UUP then broke out of a channel and StochRSI popped above .80 for a short-term momentum thrust (green vertical line). The Dollar and TLT both fell sharply on Thursday, as Treasury yields rose. The August-September lows mark a support zone and a close below these lows would argue for a re-evaluation.
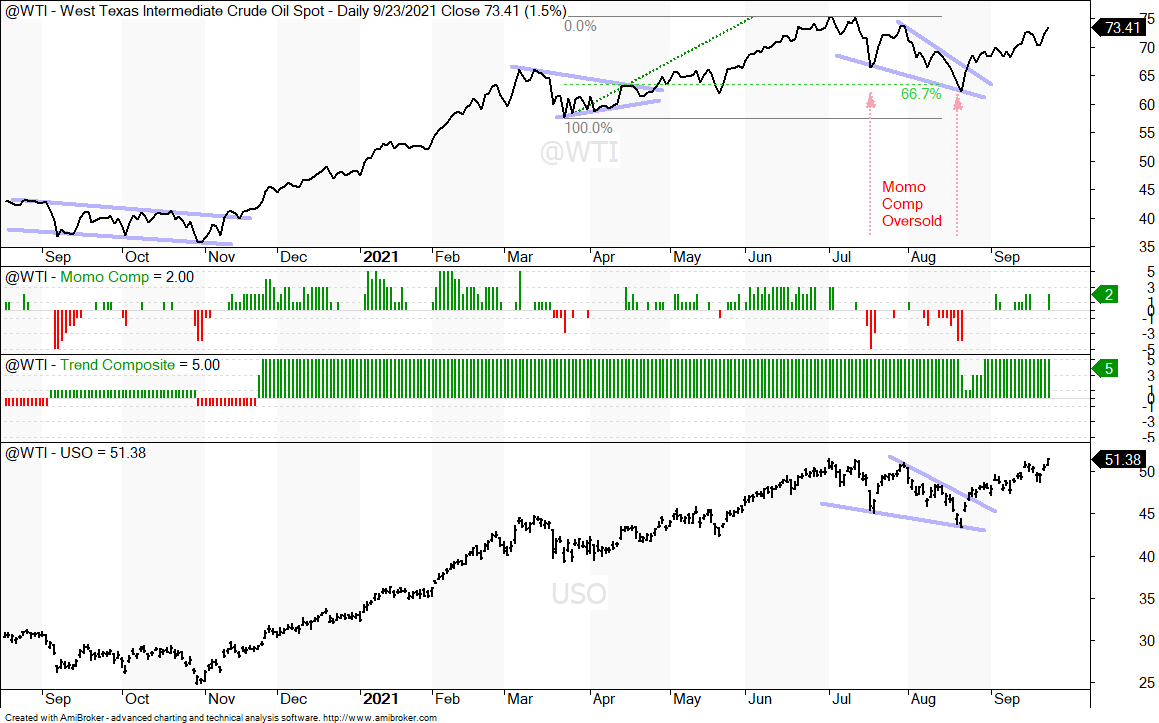
Oil Extends after Channel Breakout
Oil remains strong as Spot Crude ($WTIC) broke out of a wedge in late August and moved above $70 in September. The top window shows spot crude and the windows below show the Trend Composite and Momentum Composite for spot crude. Overall, the Trend Composite has been net bullish since November 20th, and the Momentum Composite became oversold in mid July and mid August. The wedge retraced around 2/3 of the prior advance and the breakout signals a continuation of the bigger uptrend. The lower window shows the US Oil Fund (USO) with a strong surge in late August and wedge breakout.