ETF Trends, Patterns and Setups – Surge in Yields Drives Rotations, Techs Suffer, Banks Benefit, Energy ETFs Break Out (Premium)

ETF Ranking and Trend Table Highlights

After a dozen new uptrend signals in late August and early September, the tide changed as the S&P 500 experienced its first 4-5 percent pullback since May. This pullback was enough to reverse some of the new uptrend signals and there were 14 new downtrend signals over the last five days. I am referring only to the 113 equity-related ETFs. All told, there are 67 uptrends (59%) and 46 downtrends (41%). The majority of equity-related ETFs are in uptrends, but we are seeing some new downtrends in some key groups, such as Industrials, Infrastructure, Housing, Banks and Insurance.

On the bearish side, there were new downtrend signals in the ARK 3D Printing ETF (PRNT), Emerging Markets Bond ETF (EMB) and Muni Bond ETF (MUB). Also notice that the Telecom ETF (IYZ) and Utilities SPDR (XLU) triggered bearish signals. Bond proxies (Utilities, REITs, Telecom) and fixed income ETFs are under pressure with rising Treasury yields. The 20+ Yr Treasury Bond ETF (TLT) remains with a StochClose bullish signal, but I highlighted the recent breakdown on the price chart. TLT is the main driver in the bond market and most bond-related ETFs will follow TLT.

Of the 113 equity-related ETFs, 65 (57.5%) are in uptrends and 48 (42.5%) are in downtrends. The bulls still have the edge overall, but there are quite a few downtrends out there over the last three to six months.

The next image shows the top 20 ETFs, as ranked by their StochClose values. There are a few energy-related names (DBE, RSX, FCG, XOP) and some commodity-related names (BDRY, DBB, LIT, DBA). A few tech names remain on the list as well, but SOXX and SMH dropped out of the top ten this week (SOXX, SMH, IGV, CLOU, BOTZ). The Dollar Bullish ETF (UUP) stands at number five with a three month uptrend signal in play.

Strong Uptrends, New Highs and Leading

BDRY, DBE, KRBN

The Dry Bulk Shipping ETF (BDRY), Global Carbon ETF (KRBN) and DB Energy ETF (DBE) are three of the strongest ETFs in the market right now because they hit new highs this week. BDRY broke out of an Ascending Triangle in mid September and surged the last six days. It is short-term overbought, but in a clear and strong uptrend. KRBN pulled back in July with a small wedge and was barely oversold (Momentum Composite = -1). The ETF broke out in the mid 30s and advanced above 40.

You will likely notice some different, and more focused charts. These charts were created using Amibroker. While not as slick as Optuma, these charts cover the major bases and I can select the indicators I want to show for each chart, as well as place signal arrows on the price bars. Several charts show green arrows for when the Momentum Composite is at -3 or lower (oversold).

Wedge Breakout after 33-50 Percent Retracement

XLE, XES, XOP, FCG, AMLP

The energy-related ETFs are leading the market in September with big moves and wedge breakouts. The Natural Gas ETF (FCG) kicked it off, followed by the Oil & Gas Exploration & Production ETF (XOP) and Energy SPDR (XLE). The chart below shows XLE hitting a new high in June and then falling some 20% into the mid August low. A falling wedge formed as the ETF retraced 33-50 percent of the Oct-June advance. Even though StochClose triggered bearish in mid August, the wedge and retracement amount are typical for corrections within a bigger uptrend. XLE broke out with a 10+ percent move the last six days and StochClose is on the verge of turning bullish again (cross above 60).

You can learn more about falling wedge patterns in this video.

Triangle Breakout, Leading in September

KBE, KRE

The Bank SPDR (KBE) and Regional Bank ETF (KRE) are making breakout bids with big moves the last six days. Both peaked in March and hit multi-month lows in mid July with declines that retraced around 33% of the prior advance. A one third retracement is relatively shallow. Both ETFs managed to hold above the July lows in September and forge higher lows. As a result, I am showing triangle consolidations and these are viewed as bullish continuation patterns. KRE and KBE broke out with big moves over the past week and these breakouts are bullish. The short red lines mark the ATR Trailing Stops set 5 x ATR(22) values below the highest close since the breakout. This wider stop is more suited for longer term signals and trend-following signals.

You can learn more about ATR Trailing stops in this post,
which includes a video and charting option for everyone.

The Finance SPDR (XLF) is a bit stronger than KRE and KBE because it tagged a new high in August. XLF broke out of a falling wedge in early August and appeared to negate this breakout in mid September, but recovered with a strong bounce the last six days. The overall trend is up and I will keep a bullish bias as long as the September low holds.

There are three ETFs with corrective patterns of varying degrees since May-June. All three moved sharply higher from October to May or June and then consolidated. The deepest decline during these pullbacks retraced 25 to 33 percent of the prior advance, which is quite shallow. I view these consolidations as corrective patterns within bigger uptrends, which makes them bullish continuation patterns. The first chart shows the Food & Beverage ETF (PBJ) with a triangle forming and a surge to the triangle line this week. The second chart shows the Agribusiness ETF (MOO) with a triangle and the third shows the Healthcare Providers ETF (IHF) with a falling channel correction.

Small Wedge Breakout in Play

DBA

The DB Agriculture ETF (DBA) remains in a long-term uptrend and with a small wedge breakout in play.

The DB Base Metals ETF (DBB) continues to hold its triangle breakout, even as the Copper ETF (CPER) trends lower. On the price chart, DBB broke out of a triangle consolidation and this signals a continuation of the bigger uptrend. The green arrows on the price chart show when the Momentum Composite dips to -3 or lower.

You can learn more about my chart strategy in this article covering the different timeframes, chart settings, StochClose, RSI and StochRSI.

The Uranium ETF (URA) shows another example of a correction that triggered StochClose bearish and the ETF then broke out of a falling wedge and zoomed higher. StochClose triggered bearish because the decline was quite deep as URA fell some 27% from early June to late August. Even so, this decline retraced 50% of the prior advance and formed a falling wedge, both of which are typical for corrections within a bigger uptrend. After a wedge breakout and massive surge, URA retraced 50% with a decline back to 23 and firmed. A break above Monday’s high would be short-term bullish for this high risk ETF.

The S&P 500 SPDR (SPY) remains in an uptrend overall with a new high in early September. The ETF pulled back rather hard in mid September with a move below the 50-day SMA. This pullback pushed the Momentum Composite to -5 for an oversold reading. -3 or lower is considered oversold and these setups are marked with the green arrows on the price chart and yellow shading on the indicator. SPY got a bounce last week and then fell sharply on Tuesday as techs weighed. SPY is back below the 50-day and needs to reclaim this SMA to reverse the short-term pullback.

The Momentum Composite aggregates signals in five momentum indicators. RSI(10) is oversold below 30 and overbought above 70. 20-day StochClose is oversold below 5 and overbought above 95. CCI Close (20) is oversold below -200 and overbought above +200. %B (20,2) is oversold below 0 and overbought above 1. Normalized ROC (10) is oversold below -3 and overbought above +3. Normalized ROC is the 10-day absolute price change divided by ATR(10). -3 means three of the five indicators are oversold and +3 means three of the five are overbought.

The Momentum Composite and StochClose are part of the TIP Indicator Edge Plugin for StockCharts ACP. Click here for more details.

The Russell 2000 ETF (IWM) came to life last week with a flag breakout, but remains largely dormant since March (trading range). This is one of these instances when StochClose is not much help because trend-following indicators whipsaw in trading ranges. As such, we must focus on the swings within the trading range. IWM forged a higher high with the surge into early September, fell back with a bull flag and broke out of the flag last week. The short red line marks the ATR Trailing Stop (2 x ATR(22)) for reference.

QQQ remains in an uptrend, but the ETF became quite extended after a 20% advance and pulled back in September. While SPY held its mid September low and IWM held well above its mid September low, QQQ exceeded its mid September low and is lagging the other two. The Momentum Composite moved to -4 the last two days (yellow shading) and this is the third oversold cluster since February-March. Relatively steep falling flags formed during the last two oversold clusters and flag breakouts signaled an end to the pullbacks. QQQ is currently in the pullback phase with no signs of firming just yet.

There are quite a few ETFs experiencing pullbacks after new highs and leading the market from mid May to early September. Some have been leading the market even longer. The Technology SPDR (XLK) represents the tech-related ETFs and this group is in the midst of a pullback. The Healthcare SPDR (XLV) and Water Resources ETF (PHO) are also pulling back, even though they are less related to techs. The chart below shows XLV with a sharp pullback and a few oversold readings in the Momentum Composite (green arrows). The May consolidation and 50% retracement zone mark a possible support area for this pullback. The falling flag defines the downtrend and a break above Monday’s high is needed for a short-term reversal.

A number of tech-related ETFs hit new highs in early September and then pulled back with falling flag patterns into mid September. They broke out with surges last week, but these breakouts failed and they fell below their mid September lows. ETFs with lower lows from mid September to late September are lagging this month. And therein lies the issue with tech-related ETFs. They are some of the weakest ETFs here in September and money is rotating into other areas of the market. The September decline is still viewed as a correction within a bigger uptrend, but I think this correction has yet to run its course.

The chart below shows the Software ETF (IGV) failing to hold the flag breakout and falling sharply the last three days. The Momentum Composite dipped to -3 on Tuesday and the ETF was short-term oversold. The green arrows show when the Momentum Composite dips below -3 or lower and such oversold conditions do not always mark the exact low. The prior resistance zone turns into support and this area may lead to some stabilization.

The semiconductor ETFs were not immune to broad selling within the tech sector and they also fell quite sharply the last two days. Semis may have great long-term prospects, but they are not immune to short-term fluctuations and market rotations. Most tech-related ETFs are highly correlated and this means most will come under pressure should money rotate into other areas. Such was the same from mid February to mid May (yellow shading). The chart below shows SOXX within a rising channel and the ETF is short-term oversold the last two days. However, we have yet to see signs of short-term stabilization and SOXX is also lagging here in September.

There are quite a few ETFs experiencing pullbacks after new highs and leading the market from mid May to early September. Some have been leading the market even longer. The Technology SPDR (XLK) represents the tech-related ETFs and this group is in the midst of a pullback. The Healthcare SPDR (XLV) and Water Resources ETF (PHO) are also pulling back, even though they are less related to techs. The chart below shows XLV with a sharp pullback and a few oversold readings in the Momentum Composite (green arrows). The May consolidation and 50% retracement zone mark a possible support area for this pullback. The falling flag defines the downtrend and a break above Monday’s high is needed for a short-term reversal.

The Biotech ETF (IBB) is one of the most short-term oversold ETFs in the core list with a Momentum Composite reading of -5. This means all five oscillators are oversold. While this makes IBB ripe for a bounce, I am concerned with the speed and depth of the recent decline (four days and 7%). Such sharp declines, even in uptrends, are destabilizing and it sometimes takes a few days or weeks to stabilize. Note that IBB fell 15% in 17 days in February-March.

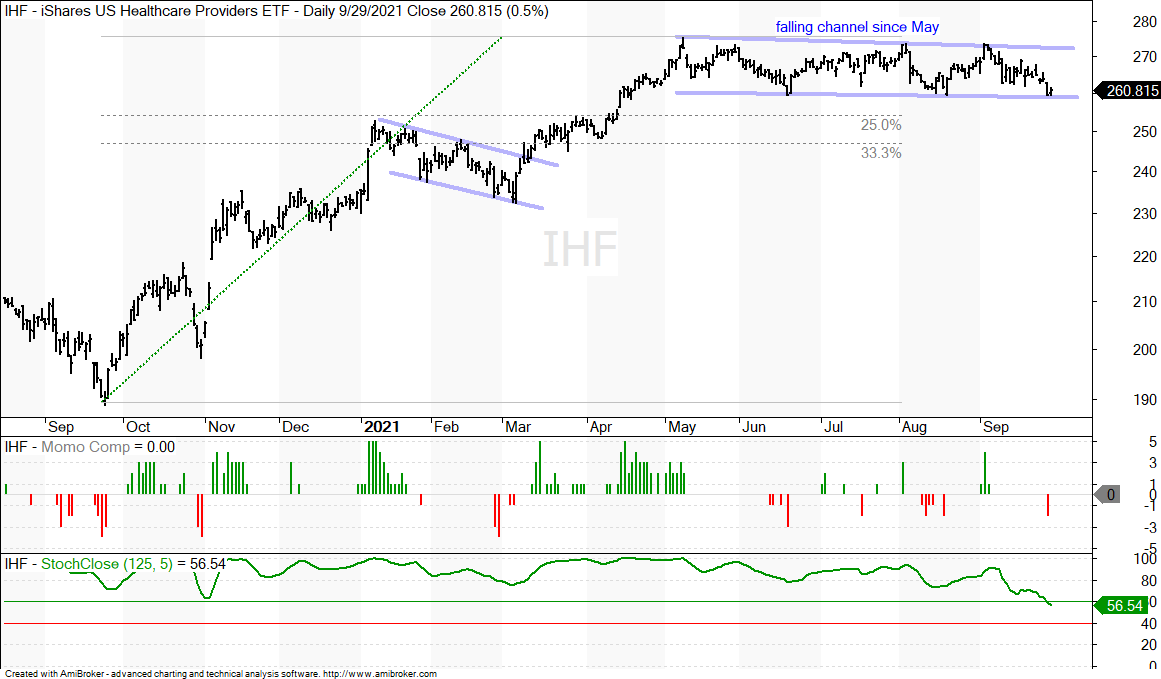
Falling Channel Since May: XLI, IFRA, ITA, XAR, IYT, ITB

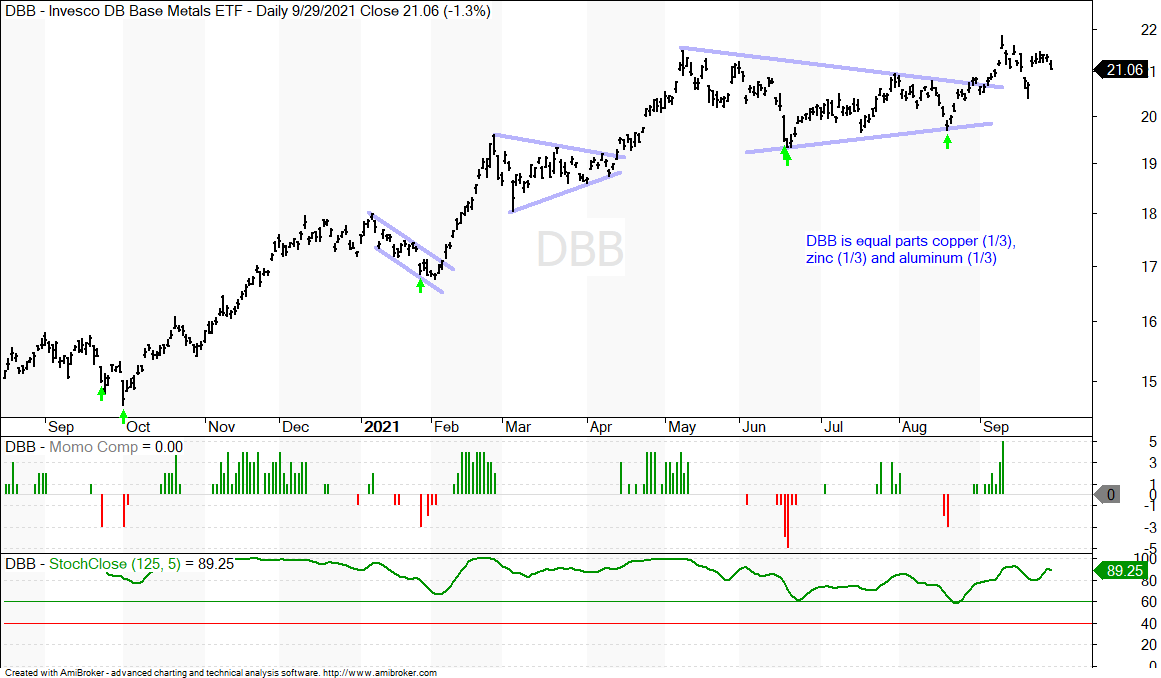
Falling Channel Since May: XLB, COPX, CPER, SLX, XME, CUT, WOOD

Rate Sensitive and Under Pressure: XLU, XLRE, IYR, REZ, IYZ

Asian Downtrends: EWA, EWY, ASHR, FXI, KWEB, CQQQ, EEM, IEMG, EMQQ

Clean Energy Downtrends: PBW, ICLN, FAN

Cannabis Downtrends: YOLO, MJ

Vid Games eSports Downtrends:  ESPO, HERO, GAMR

Thanks for tuning in and have a great day!

-Arthur Hill, CMT
Choose a Strategy, Develop a Plan and Follow a Process

Scroll to Top