The Market Regime remains bullish and the S&P 500 is just 4% below its recent high, but breadth has been waning for months and many groups are already in corrective mode. The 4% decline in the S&P 500 over the last 11 days is the biggest since May and marks the third pullback in the 4-5% range since the early November breakout. Prior pullbacks were opportunities because they did not last long and the uptrend continued soon there after.
The chart below shows SPY with a bull flag in February-March and a pennant in May. The Momentum Composite dipped to -3 both times to mark an oversold condition (yellow shading) and RSI dipped into the 40-50 zone (turned blue). This decline is a bit different because SPY gapped down on Monday, the Momentum Composite hit -5 and RSI dipped below 40 for the first time since October (turned red). SPY is clearly short-term oversold and ripe for a bounce in the next few days, but there are no signs of a bounce just yet. Watch for StochRSI (bottom indicator) to pop above .80 for the first signs.
The Million Dollar Question? Is this just another short pullback and buying opportunity? Or, is this decline the start of a bigger correction? While nobody really knows, I would suggest that we will see a more extended corrective period for the following reasons. Breadth has been waning for months, many groups have been correcting for months, September is the weakest month of the year and this advance is long overdue for a decent correction. Perhaps a falling wedge or zigzag to the 420 area in the coming weeks is possible.
A number of high-beta ETFs triggered bullish trend signals between August 1st and September 19th. Most of these ETFs were the high-flyers and market leaders from the March 2020 low to the February 2021 high. All told, there were 21 new uptrend signals since August 1st (out of 129 ETFs in the core list). As of Monday’s close, two of these signals were reversed as StochClose turned bearish, four signals show a profit and fifteen show a loss. The number of trading days ranges from 3 to 31.
The image below shows a section from the ETF Ranking and Trend Signals table with the 19 active Uptrend signals since August 1st. It is sorted by the “Bars” column to show the most recent signals at the top, this also puts the most recent date at the top. “NewUp” means an uptrend signaled within the last five trading days. Currently, BOTZ, ROBO, IPO and EWJ show a positive percentage change (green outline), while the others show a negative percentage change.
Note that all of these ETFs are equity ETFs and most are high-beta ETFs, which means they typically move more then the S&P 500. If an ETF has a beta of 2 and the S&P 500 declines 1%, then the ETF typically declines twice as much (2%). The Core ChartList is stacked with equity ETFs because 113 (87.5%) of the 129 ETFs are equity-related. Only 16 are non-equity ETFs (bond, commodity, currency related).
Let’s look at the two whipsaws (losses) first. The chart below shows the Australia ETF (EWA) with the last four signals (green/red arrows). The red arrows mark the bearish trend signal when StochClose crosses below 40, while the green arrows mark the bullish trend signals when StochClose crosses above 60. EWA triggered bearish in late February 2020 and avoided the covid crash. The ETF then triggered bullish in early June 2020 and rode a nice uptrend until mid August 2021 (+25%). An uptrend signaled on September 7th but this signal was quickly reversed with a bearish signal on Monday. As far as patterns are concerned, a triangle formed after the June-July decline and the triangle break signals a continuation of this decline.
The next chart shows the Video Games eSports ETF (ESPO) with a whipsaw over the last two weeks (-8% loss). This also brings up the “one last hope strategy” for an exit. All of my signals are based on closing prices and the entries/exits are based on the next open. A sell signal triggered for ESPO on September 20th (Monday) and the exit would be the open on Tuesday. Chartists can consider placing a stop just below the low in an attempt to avoid a short-term shake out. Tuesday’s low was 64.50. Adding a little buffer below a round number puts the stop at 63.90. Yeah, that sounds logical, but logic does not always work and this clearly is one last hope!
One Big Trend
The Robotics & Artificial Intelligence ETF (BOTZ) is the only big gainer (+11.4%) and it is also the ETF with the longest signal (since August 6th). The chart below shows a monster gain after the signal in late April 2020 (+57%), a whipsaw in June-July (yellow shading) and the early August signal (green arrow). BOTZ also broke out of a big triangle in mid August.
StochClose signals are trend-following signals and the usual performance metrics apply. Based on backtest results using the All Weather List since 2007. Trend signals result in profits 40% of the time and losses 60% of the time. This means there will be more whipsaws than big trends. The average gain is typically three times the average loss. Past performance does not guarantee future results and results may vary! See this article for recent test results.
The list below singles out the 13 high-beta ETFs with recent StochClose signals (bullish). These ETFs have above average volatility and above average risk. Of note, there are three clean energy ETFs and six ARK ETFs.
Solar Energy ETF (TAN)
Clean Edge Green Energy ETF (QCLN)
Wind Energy ETF (FAN)
ARK 3D Printing ETF (PRNT)
Space Procurement ETF (UFO)
Uranium ETF (URA)
ARK Genomic Revolution ETF (ARKG)
ARK Autonomous Tech Robotics ETF (ARKQ)
ARK Innovation ETF (ARKK)
ARK Fintech Innovation ETF (ARKF)
ARK Next Gen Internet ETF (ARKW)
Sports Betting iGaming ETF (BETZ)
IPO ETF (IPO)
Most of these ETFs sport similar looking charts. There were massive advances from the March 2020 low to the February 2021 high and then big declines that formed falling wedges (February to May 2021). StochClose trend signals did not catch the low or the high, but generated massive profits with these exceptional advances.
The chart below shows the Clean Edge Green Energy ETF (QCLN) with StochClose turning bullish on 21-May-2020 (move above 60) and bearish on 5-May-2021 (move below 40). This bearish signal triggered well after the peak, but the percentage gain was still 130%.
The next chart focuses on price action since StochClose turned bullish with a move above 60 on August 31st (green arrow on bar chart). QCLN moved higher for two days and then lower the last 11 days. SPY is down 4% the last 11 days and QCLN is down 7.3%, which confirms it as a high beta stock. With this decline, the Momentum Composite dipped to -3 and RSI dipped below 40. This means there is a mean-reversion setup at work and a StochRSI pop above .80 would signal an upside momentum thrust.
Overall, QCLN and several ETFs are at a moment of truth. They triggered bullish trend signals with StochClose recently and are now short-term oversold. Further weakness could reverse these trend signals, but we must work with present signals and conditions. The current trend signal is bullish and the present condition is oversold. The odds favor a mean-reversion bounce sooner rather than later. The more extended market correction is the big wild card here.
Mean-Reversion Setups
Mean-reversion setups are the alternative to trend-following, and also a compliment. Trend-following signals lag and trigger after a significant move in either direction. Mean-reversion setups materialize when there is a pullback after the trend has turned up (StochClose bullish). Such a strategy can be used to partake in uptrends that are already underway.
There are three degrees when it comes to pullbacks within an uptrend. First, RSI becomes mildly oversold when it dips into the 40-50 zone (turns blue). Second, RSI becomes modestly oversold when it dips into the 30-40 zone (turns red). Third, the Momentum Composite dips to -3 or lower when three of the five inputs are oversold. Once an indicator becomes oversold, chartists can watch StochClose for a pop above .80 or look for a short-term bullish catalyst on the price chart.
The next charts show ETFs with recent StochClose trend signals (green arrow) and oversold conditions of some degree. Here is a link to a CandleGlance chart.
You can learn more about my chart strategy in this article covering the different timeframes, chart settings, StochClose, RSI and StochRSI.
The Momentum Composite aggregates signals in five momentum indicators. RSI(10) is oversold below 30 and overbought above 70. 20-day StochClose is oversold below 5 and overbought above 95. CCI Close (20) is oversold below -200 and overbought above +200. %B (20,2) is oversold below 0 and overbought above 1. Normalized ROC (20) is oversold below -3 and overbought above +3. Normalized ROC is the 20-day absolute price change divided by ATR(20). -3 means three of the five indicators are oversold and +3 means three of the five are overbought.
The Momentum Composite and StochClose are part of the TIP Indicator Edge Plugin for StockCharts ACP. Click here for more details.
Uptrend and Oversold Momentum Composite
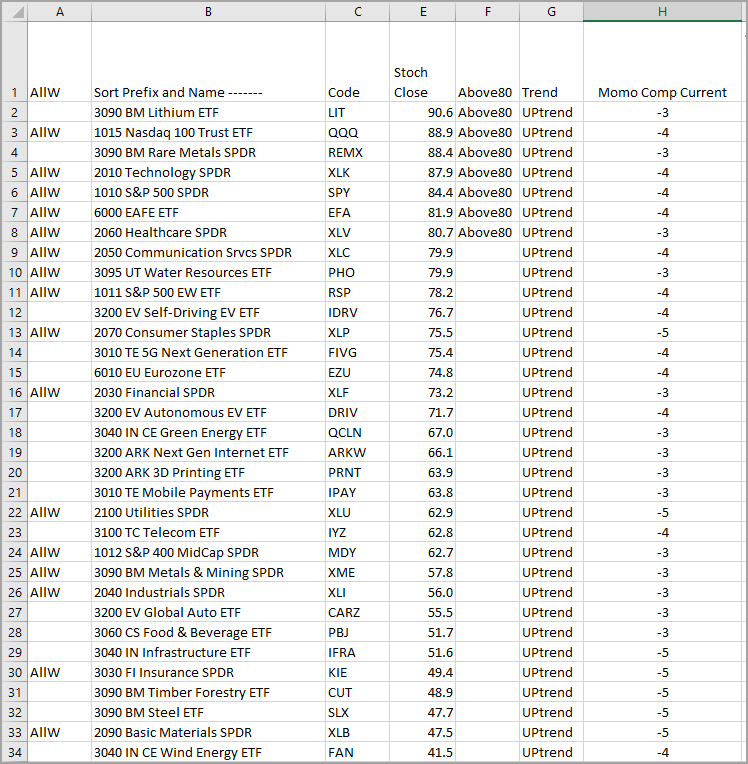
The table below was created in Excel and shows ETFs with uptrends and the Momentum Composite at -3 or lower (oversold). Column F shows ETFs with StochClose above 80 and these ETFs are still leading. Column H shows the current value for the Momentum Composite. Notice that several are quite oversold with values of -5.
")