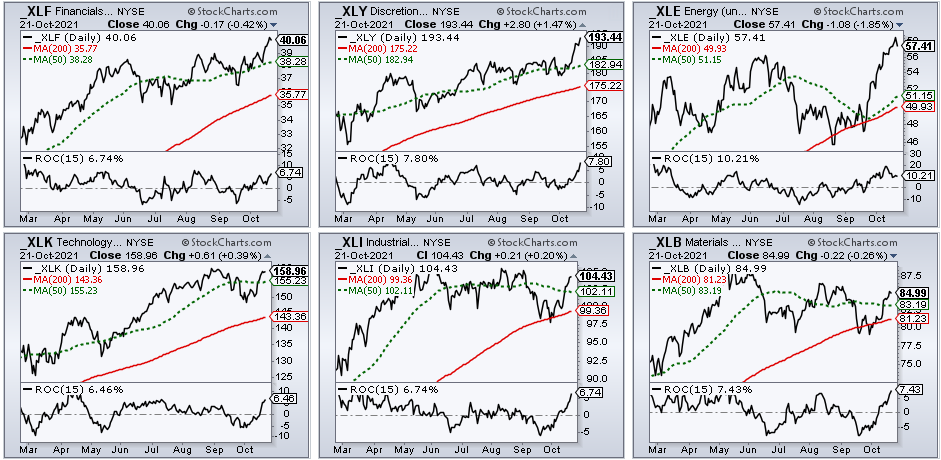
The Market Regime remains bullish and participation broadened here in October. The Finance SPDR and Consumer Discretionary SPDR hit new highs in October, and the Technology SPDR ended its correction with a breakout. Broadening participation comes from the Industrials SPDR and Materials SPDR, which are up over 6% here in October and breaking out within big corrective patterns (see Thursday’s commentary for details). There are 15 trading days so far in October and the indicator window shows the 15-day Rate-of-Change for the selected sectors. All are up more than 6%.
Seasonal Patterns are Bullish
Historically, seasonal patterns are also bullish for stocks in the second half of October and November is the second strongest month of the year. April gets top honors. As the chart below shows, the S&P 500 closed higher 79% of the time in November over the last twenty years.
SPX %Above SMA Indicators Turn Up
Breadth continues to improve with the percentage of SPX stocks above SMA indicators breaking above their September peaks. The percentage of stocks above the 200, 150 and 100 day SMAs peaked in April and fell into September as participation narrowed. These indicators stabilized from mid September to early October and turned up the last week or so. Note that all three exceeded their red lines, which mark the September peaks. This shows expanding participation and this is more bullish than bearish. Broadening participation stems from strength stocks related to finance, industrials and materials.
Other Notes
The Composite Breadth Model (CBM) remains bullish and has been bullish since May 2020 (see Market Regime page for charts covering the CBM, yield spreads and Fed balance sheet).
Investment grade and junk grade corporate bond spreads remain at low levels overall (since July) and there are no signs of stress in the credit markets.
The Fed balance sheet expanded by $84 billion and hit another new high this week.
The 20+ Yr Treasury Bond ETF (TLT) remains in a long-term downtrend. Short-term, TLT hit resistance from broken support and fell this week.
The Gold SPDR (GLD) turned back at its falling 200-day and a big triangle consolidation is taking shape.
The Dollar Bullish ETF (UUP) remains in a long-term uptrend, but fell back to the breakout zone this week.
Oil hit another 52-week high and remains one of the strongest commodities.
TLT Fails at Support Break
The 20+ Yr Treasury Bond ETF (TLT) remains in a downtrend overall. TLT retraced 50% of the prior 22% decline and this represents a 2 steps down & 1 step up sequence (downtrend). After hitting resistance in the low 150s, price broke support and the falling 200-day with a sharp decline in late September. This breakdown signals a continuation of the larger downtrend. Last week’s oversold bounce returned to broken support, which turns resistance (classic technical analysis). TLT fell this week and this affirms resistance in the 145-147 area. I would expect lower bond prices and higher Treasury yields going forward.
Gold Fails at Falling 200-day
The Gold SPDR (GLD) remains in a downtrend overall and is one of the weakest assets right now. Price is below the falling 200-day SMA. GLD could be forming a large triangle since March-May with higher lows and lower highs (contracting range). A triangle within a downtrend is typically a bearish continuation pattern because is represents a rest within that downtrend. A break below the September low would argue for a continuation of that downtrend. Large triangles, however, can break either way and a break above 169 would be bullish. The swing within the triangle is up (blue dashed lines). A break below 165 would reverse this short-term upswing and increase the chances for a bearish resolution to this triangle.
Dollar Falls back to Breakout Zone
The Dollar Bullish ETF (UUP) remains in an uptrend overall. Price exceeded the spring high for a higher high and price is above the rising 200-day SMA. The greenback fell back to the breakout zone this week, but is not oversold yet and I do not see a bullish continuation pattern (falling flag, wedge or triangle).
Oil Hits Another New High
There is no change in oil as West Texas Intermediate extended on its channel breakout and hit another new high this week. Spot crude is up some 30% since mid August and one of the strongest commodities out there. There is no setup on this chart, just a strong and leading uptrend. The lower window shows the DB Energy ETF (DBE), which is around 92.3% oil complex and 7.6% natural gas. The price charts are pretty similar with consolidation breakouts in April and August, and a new high this week.
")