
")


Don’t like the current rotations in the stock market? Wait a week and it will change. Tech stocks led the market higher immediately after the election with big moves last Wednesday, Thursday and Friday. The reflation trade then took over this week as some of the worst performing groups surged (finance, defense, banks, energy). Money moved out of tech and lockdown related ETFs to fund this rotation.

New highs and a fast growing industry group make for a powerful combination. Today’s article will focus on two ETFs that capture two fast growing industries, video gaming and esports. We will show why these two ETFs are leading, why a consolidation within an uptrend is bullish and why a 50-day SMA is better suited for mean-reversion trading.
Two ETFs with Market Leading Charts and Fast Growing Industries Read More »

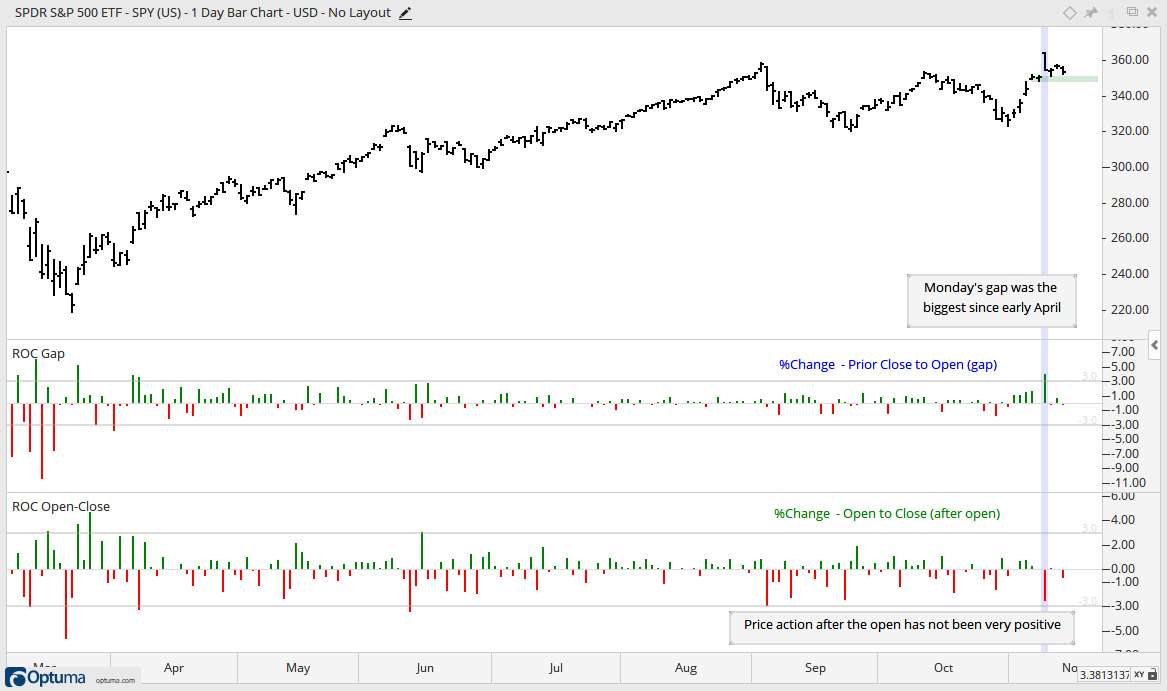
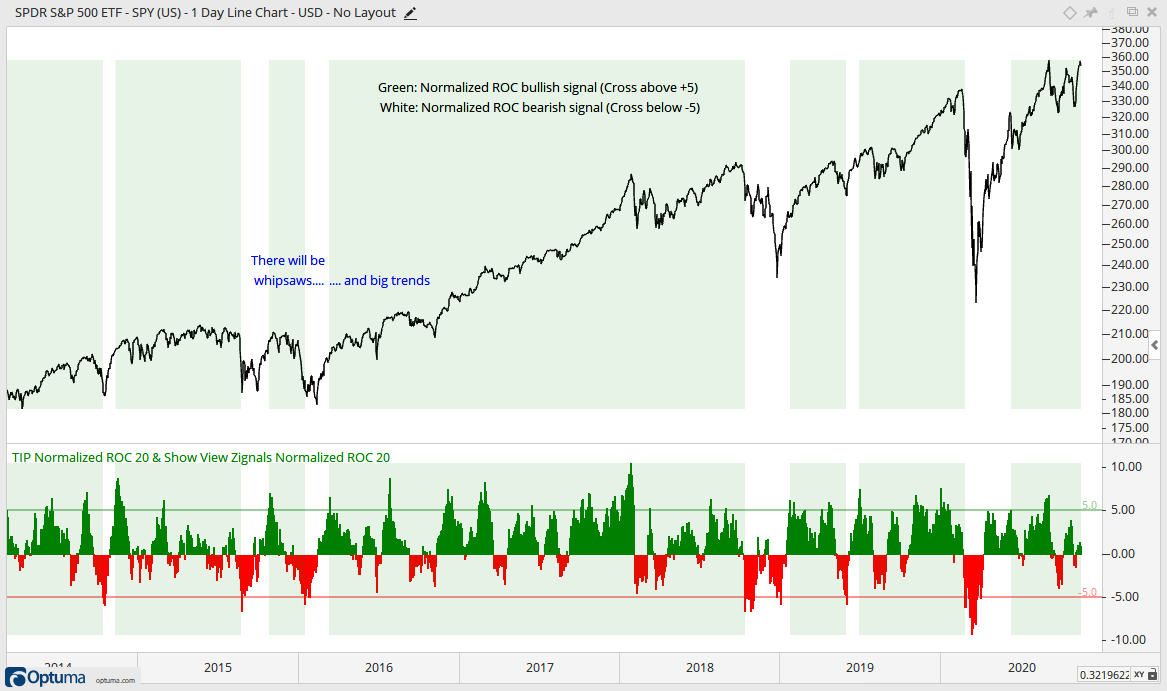
Today’s video starts with a broad market overview. The swings in SPY could widen further with another ROC shock this past week. Volatility is increasing, but the trends are up and price action remains bullish. We then look at the breakdown in the Dollar, the breakout in gold and the downtrend in Treasury Bonds. BBB yield spreads narrowed significantly over the last week or so and the Fed balance
Weekend Video/Chartbook – Another ROC Shock, Lots of Continuation Patterns, Gold Goes… Read More »

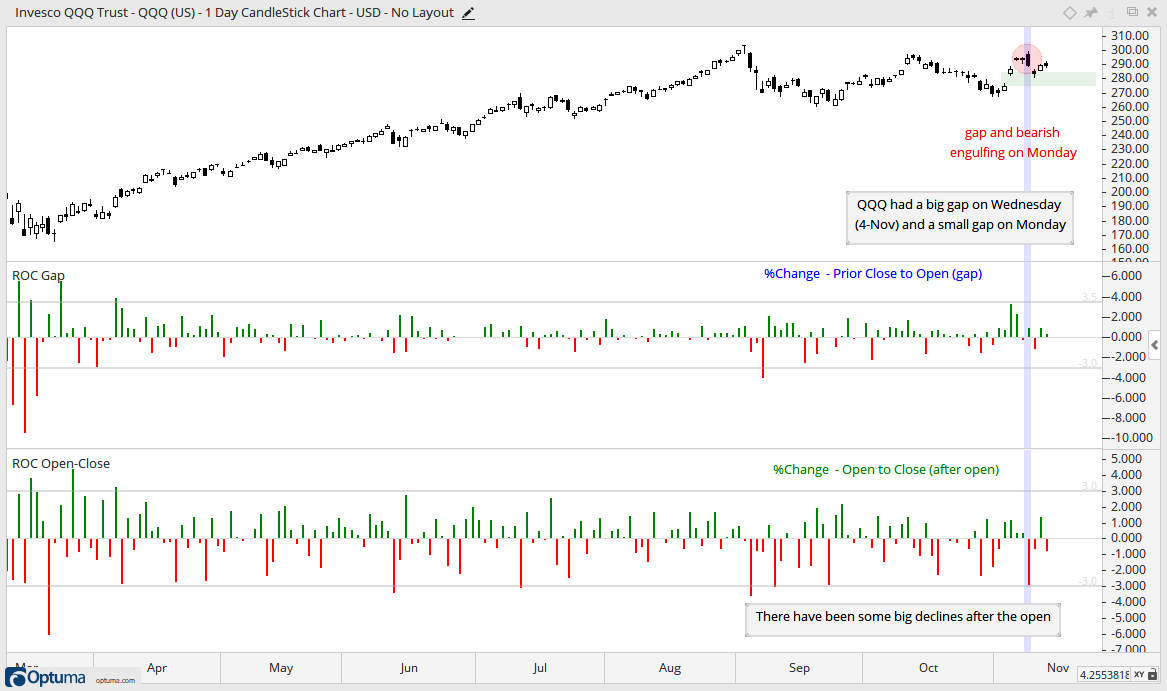
Pretty much everything moved higher the last four days. Well, everything but the Dollar. Stocks surged with QQQ leading the charge. Money did not rotate out of safe-haven bonds as the 20+ Yr Treasury Bond ETF and Corporate Bond ETF gained over 2%. Oil was up over 7%, copper was up around 2% and the Gold SPDR took advantage of Dollar weakness
Timing Models – A Tide that Lifts All Boats (Stocks, Bonds, Gold, Commodities) Read More »
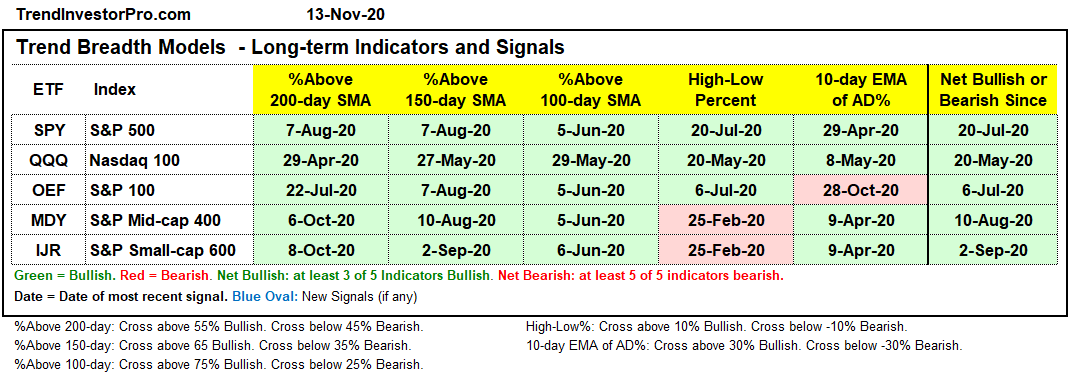
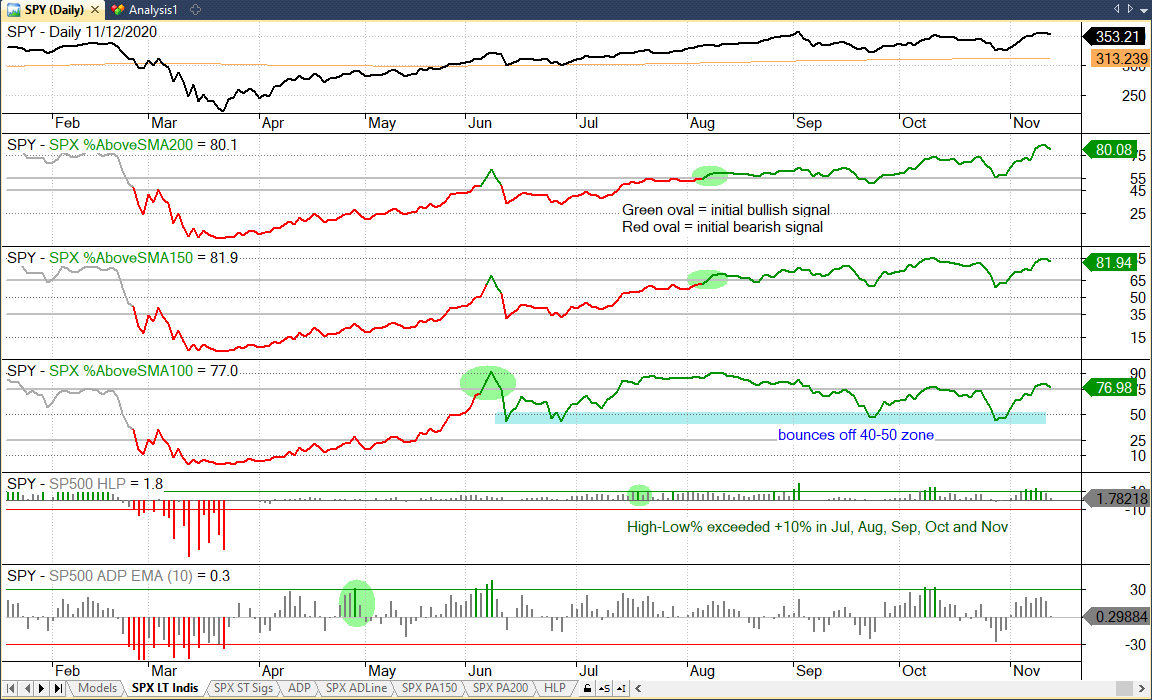
The charts are full of bullish consolidation patterns over the last one to two months. There are triangles, flat consolidations and falling channels. These patterns, when forming after a big advance, represent a correction and a bullish resolution is expected. Why? Because the path of least resistance is up when the bigger trends are up and the breadth models are bullish.

Breadth indicators, such as Advance-Decline Percent, measure the participation behind a move in the underlying index. Sometimes participation is so strong that it tips the scales and signals the start of an extended move. For example, 10-day EMA of SPX AD% triggered a bearish breadth thrust on February 25th and the S&P 500 extended lower.
Broad Selling Pressure, but Not Enough to Tip the Scales Read More »
Today’s video starts with the S&P 500 SPDR to put the four week reversal and outsized decline into perspective. We will look at performance since the early September ROC shock, weigh the long-term evidence and compare the current setup with November 2016. Bank ETFs stood out this week as they bucked broad selling pressure and small-caps are holding up better than large-caps.
The S&P 500 SPDR shows a reversal in the making when we focus on the candlesticks the last four weeks, but the overall trend remains up and the Trend Breadth Models have yet to flip. The chart below shows SPY with a long white candlestick four weeks ago, two indecisive candlesticks and a long black candlestick this week. Despite the extra candlestick, these four clearly capture the essence
Timing Models – Noise or A Reversal in the Making? Read More »
Last week I wrote about a possible changing of the guard, and Wednesday I had to rein in the bulls as small-caps and banks got cold feet. While the sudden change of heart over the last three days is not quite as dramatic as the rise from the ashes in late September, it is a warning shot across the bow for the stock market. Small-caps, mid-caps and banks are simply not performing that well this year.

Small-caps and banks went from potential leaders to potential failures over the past week. Basically, the markets got cold feet on the reflation/value trade and bailed the last two days. I do not know if this is just pre-election jitters, but there are a lot of BIG unknowns out there right now. These include the uneven rebound in stocks, election, covid,
Not So Fast There, Cowboy – The Reflation/Value Trade Gets Cold Feet Read More »

This article updates the ATR Trailing Stop and show how anyone can chart it. As noted in the first part, the Chandelier Exit and Parabolic SAR are lacking as far as I am concerned. The Chandelier Exit is fixed to the high based on a lookback period, which may or may not fit the current trade. Parabolic SAR is too volatile and complicated.
Where to Chart the ATR Trailing Stop, the Trigger in SPY and the Developing Flag Read More »
Today’s video starts with a weekly chart of the S&P 500 SPDR to show how stocks are digesting the gains from the prior two weeks. This two week digestion formed small flags on many charts and the leaders are already breaking out. Leadership, however, is changing as techs sag a little. Small-caps, mid-caps, banks and utilities
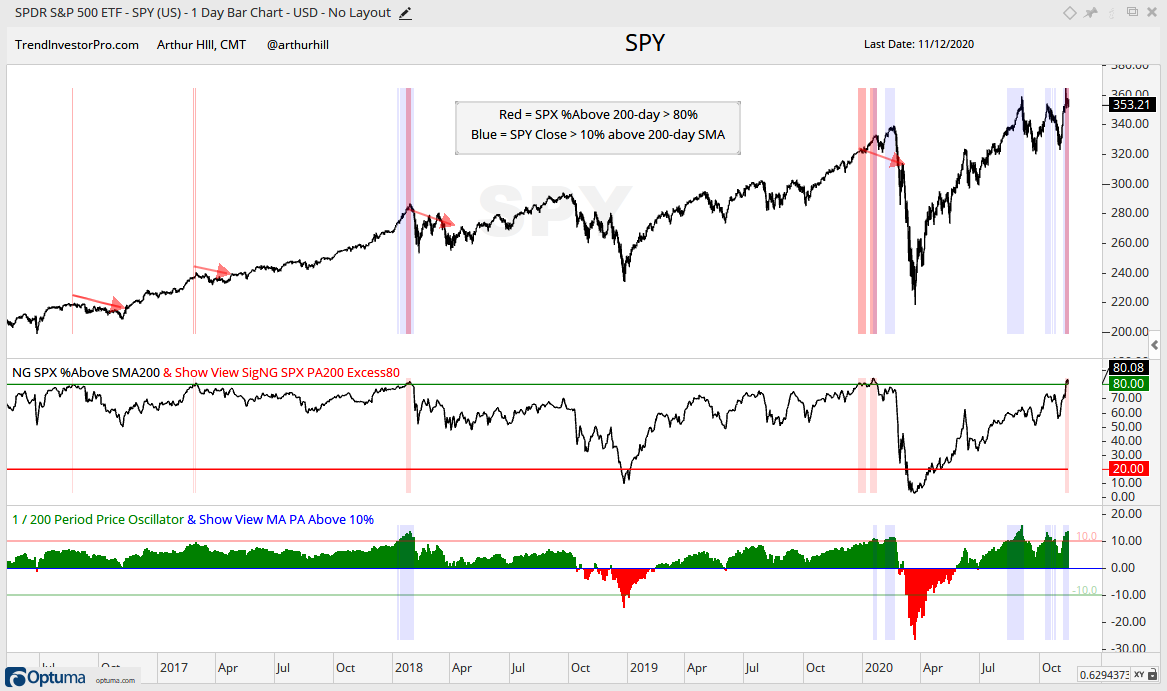
Today’s report will focus on the breadth models, the breadth indicators for the S&P 500 and the long-term trend for the S&P 500. All are in bull mode right now and the broad market environment is bullish. I am also updating the backtest for the Trend Breadth Model and then adding a twist by trading QQQ with signals from the S&P 500 Trend Breadth Model.
Timing Models – Breadth Model/Indicator Review, Testing Model Signals with SPY and QQQ Read More »

Stocks remain strong overall with small-caps starting to outperform. Moreover, the small-cap ETFs worked off their short-term overbought conditions with bullish continuation patterns. Not to be totally left behind, SPY and QQQ also formed short-term bullish continuation patterns.
A changing of the guard may be in the works as small-caps, banks and utilities take the lead short-term. It all started on 25-Sept when the small-cap and banking ETFs surged from their lagging positions. Large-caps and large-cap techs participated in this surge, but many did not exceed their early September highs. IWM, KRE and XLU exceeded these highs and showed short-term leadership. Can it continue?

There is some curious activity in the intermarket arena. Namely, we are seeing continued weakness in Treasury bonds, relative strength in inflation-indexed bonds, weakness in the Dollar and strength in several commodity groups. I do not trade off intermarket relationships, but I do trade specific patterns and there are several commodity related ETFs with bullish breakouts working. Today’s commentary will focus on the DB commodity ETFs:
Today’s video starts with a review and outlook for the broader market. SPY formed a weekly spinning top to show indecision, but the falling wedge breakouts and follow through still dominate the charts. Small-caps are making a bid to outperform as a key ratio broke above its 200-day for the first time in two years. The rally continues to broaden with two more bullish breadth thrusts. Many ETFs are in the trend monitoring phase
Today we will start with small-caps, industrials and banks, because these three could be turning the corner. The IWM:SPY ratio moved above its 40-week SMA for the first time in 2 years, XLI is above the 200-day and KRE rose from the ashes the last four weeks. GLD may be parting ways with TLT and hooking up with SPY again. The breadth models remain bullish and there were two new signals in the short-term breadth models. The sector breadth model also remains firmly bullish with the newest signals coming
Some discrepancies are starting to build in the stock market. We witnessed a bullish breadth thrust last week because mid-caps and small-caps led from 24-Sept to 12-October. The Russell 2000 ETF exceeded its September high and produced a market leading gain during this time period.

There are 11 sectors in the S&P 500, but the big six are the only ones we need to be concerned with when making a broad market assessment. The big six account for a whopping 82.5% of the S&P 500, which leaves the other 5 with just 17.5%. Consumer Staples is the seventh
Taking Breadth Thrusts to the Sector Level Read More »