
Visual chart analysis is prone to subjectivity and biases. While we cannot completely remove subjectivity, we can approach chart analysis in a systematic fashion and increase objectivity. This commentary will show an example using the Home Construction ETF (ITB) because the ETF has traded flat since mid October. Is this a top or merely a correction?

First things first. What is the direction of the bigger trend? Three indications point to an uptrend. First, the ETF exceeded its February high in July and recorded 52-week highs into October. Second, ITB is above the 200-day SMA and the 200-day SMA is rising. Third, the RSI Trend-Range (65,5) indicator turned bullish in late May and remains bullish. This is the 5-day SMA of 65-day RSI and this indicator is part of the TIP Indicator Edge Plugin for StockCharts ACP. It turns bullish with a move above 51 (green) and bearish with a move below 49 (red).
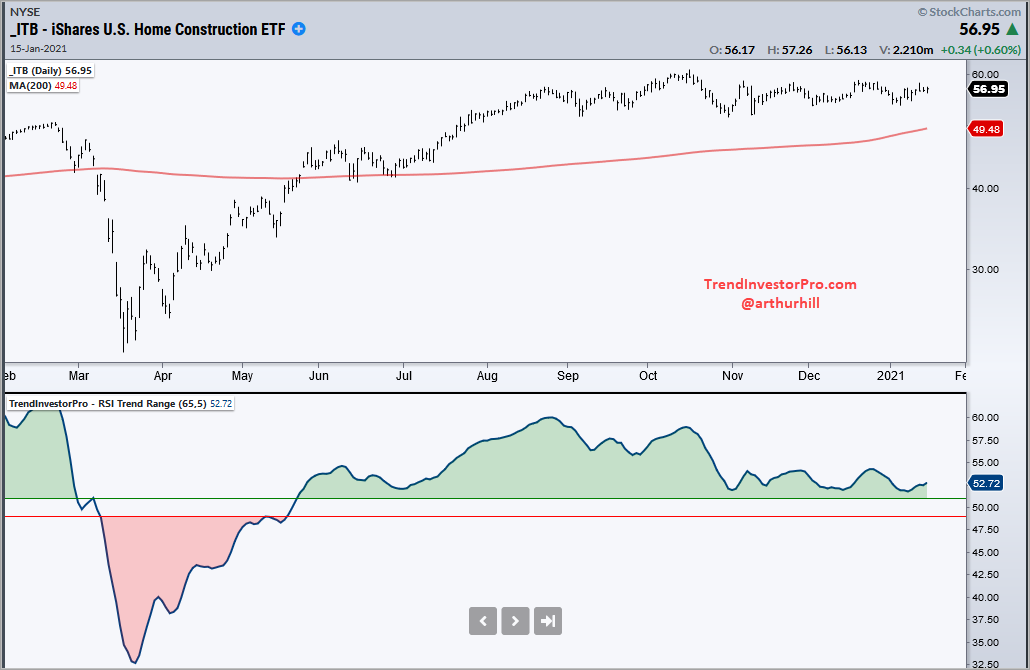
Now that we have established that the bigger trend is up, we can set our trading bias as bullish. This means I will focus on bullish setups and expect bullish outcomes because the odds favor a move in the direction of the bigger trend. Consolidations are considered mere pauses within the uptrend and pullbacks are viewed as opportunities, not threats.

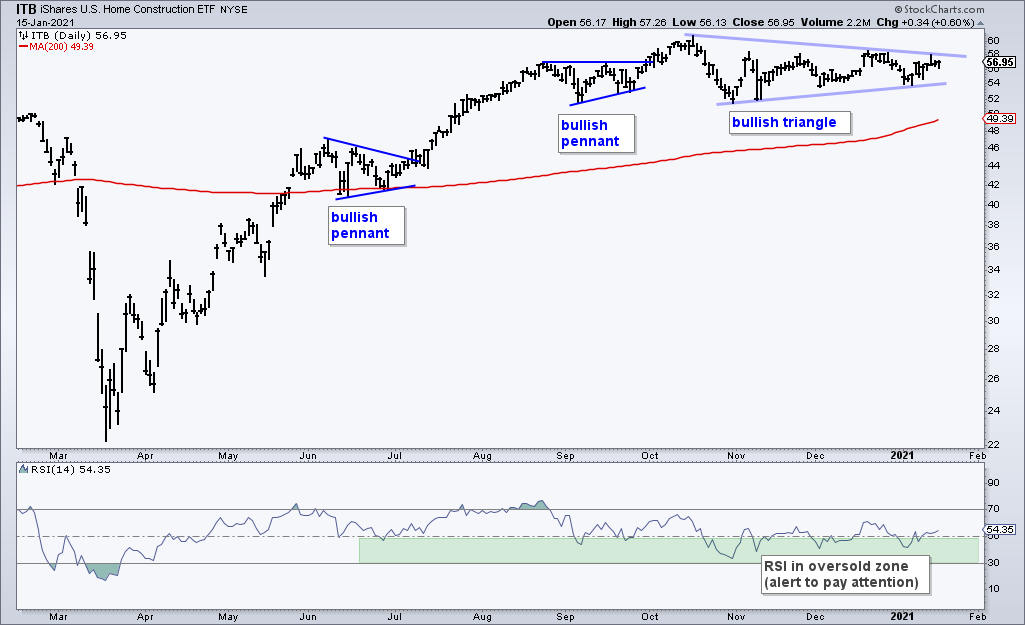
The next chart shows ITB with bullish continuation patterns marked in blue and oversold RSI marked with green shading. An RSI move into the 30-50 zone denotes an oversold condition of varying degrees and alerts chartists to be on guard for a bullish setup. RSI has been flirting with this zone for several months as ITB consolidates with a long and narrowing triangle. Prices are winding up and the expectation is for an upside breakout. Why? I think you can figure that one out! A breakout would signal an end to the pause (correction) and a continuation of the bigger uptrend.  
Looking for a systematic approach to quantify trends and be alerted to bullish setups within uptrends? TrendInvestorPro tracks trends strength, trend signals and oversold setups for 118 ETFs. The table below shows a subset with six oversold setups. This week we highlighted the Residential REIT ETF (REZ) and Utilities SPDR (XLU). Click here to subscribe and get immediate access to this table, the weekend video and premium commentary.


Weekend Video and Chartbook – Holding the Uptrend as RSI Gets Frothy, Bonds and Dollar Get Oversold as Utes Firm

Today’s video starts with the weekly charts showing a pretty normal post-breakout extension for SPY, but an overextended advance for IWM. We are also seeing signs of excess in the number of ETFs with RSI readings above 80 this year. Despite overbought conditions, two medium-term breadth indicators are holding strong and have yet to show any deterioration within the S&P 500. We then turn to the ETF

Weekend Video and Chartbook – Holding the Uptrend as RSI Gets Frothy, Bonds and Dollar Get Oversold as Utes Firm Read More »

Timing Models – Weight of Evidence, Not Everything is Overextended, Yield Spreads Narrow Further

Stocks are in the middle of a strong advance with small-caps leading the charge. The middle, in this instance, refers to a point after the beginning because I do not know where the end will be. IWM appears quite extended after a 39% advance the last eleven weeks, but the price charts for SPY and QQQ do not look that extended. The latter two broke out in early November and continue to work their way higher. Even though small-caps, micro-caps and mid-caps are getting most of the attention right now, SPY and QQQ are holding their own just fine.

Timing Models – Weight of Evidence, Not Everything is Overextended, Yield Spreads Narrow Further Read More »

ETF Trends, Patterns and Setups – Breakouts Hold and Uptrends Extend as RSI Reaches New Extremes

There are not a lot of setups this week because most equity-related ETFs moved higher the last two to three weeks. Most, but not all. There are still some setups working in XLU, REZ and ITB, but these three are lagging over the last few months. We are also seeing some relatively fresh breakouts in XLI and XAR, as well as hard throwbacks in GLD and SLV. These four are still in setup territory. All charts are covered below.

ETF Trends, Patterns and Setups – Breakouts Hold and Uptrends Extend as RSI Reaches New Extremes Read More »

Treasury Yields, Inflation, Real Yields and Gold – Setting Stops to Filter Out Noise

Bonds and gold were spooked last week as the 20+ Yr Treasury Bond ETF (TLT) fell 4% and the Gold SPDR (GLD) fell 2.81%. Note that GLD surged over 2% on Monday’s open and then fell over 5% the last three days of the week. Wow! Today we will look at the 10-yr Yield, Inflation, the Real Yield and gold. There is an interesting narrative at work, as always, but we are usually better off focusing on the chart of the underlying and ignoring the narrative.

Treasury Yields, Inflation, Real Yields and Gold – Setting Stops to Filter Out Noise Read More »

Weekend Video and Chartbook – Breakouts and New Highs Proliferate, Bonds and Gold Get Slammed, ETF Ranking Table

The post-breakout moves in SPY and QQQ look pretty normal, but the 10-week surge in the Russell 2000 ETF looks downright frothy. What else is new. Even so, two S&P 500 medium-term breadth indicators are holding strong and show no signs of deterioration that would suggest a correction. In the ETF Chartbook, we saw lots of consolidation breakouts this week and new highs (closing prices) in seven of the nine sector SPDRs. Bonds took it personal this week as the TLT fell 4%,

Weekend Video and Chartbook – Breakouts and New Highs Proliferate, Bonds and Gold Get Slammed, ETF Ranking Table Read More »

Timing Models – Small-caps continue to Lead, Leadership Broadens, Junk Yields Narrow Further

The rally is gaining steam (momentum), the leadership circle is broadening (new highs) and the riskiest stocks are leading (small-caps). We are also starting to see stories suggesting that this rally is unstoppable. Maybe it is, maybe it isn’t. There will be a pullback at some point, but it is much harder to time “overbought” pullbacks than oversold bounces. The big trend and bull market are the dominant forces at work in the

Timing Models – Small-caps continue to Lead, Leadership Broadens, Junk Yields Narrow Further Read More »

Exit Indicators – Trend Reversal, Chandelier, Parabolic SAR and ATR Trailing Stop – Resources

Chartists trading oversold bounces and short-term bullish continuation patterns have two basic choices when it comes to an exit: trailing stop or trend reversal. Trailing stops are used initially as stop-losses and then trail price if/when it moves higher. Trend reversal exits are used to accumulate during an uptrend and exit when the longer-term trend reverses. This article will cover the trend reversal exit and three trailing stop alternatives.

Exit Indicators – Trend Reversal, Chandelier, Parabolic SAR and ATR Trailing Stop – Resources Read More »

ETF Trends, Patterns and Setups – Reopening ETFs Resume the Lead, Healthcare Stays Strong, GLD Breaks Out

Stocks are on the march again with the re-open trade leading the way here in 2021. The year ended with small-caps, retail, banks and energy leading the last two months of the year and this theme picked up again this week. A new year and a new month translates into money ready to go to work and this money found its way into the momentum leaders of the last three months.

ETF Trends, Patterns and Setups – Reopening ETFs Resume the Lead, Healthcare Stays Strong, GLD Breaks Out Read More »

ETF Trends, Patterns and Setups – Bull Market, Recent Breakouts, Current Consolidations, Inflationary Pressures

The bull market in stocks remains intact as we start 2021. The S&P 500 SPDR and Nasdaq 100 ETF finished the year at new closing highs, while the Russell 2000 ETF finished less than 2% from its December 23rd closing high, which was a 52-week high. For the year, IWM was up 18.34%, QQQ rose 47.57% and SPY gained 16.16% (sans dividends). Note the Silver ETF kept pace with QQQ in 2020.

ETF Trends, Patterns and Setups – Bull Market, Recent Breakouts, Current Consolidations, Inflationary Pressures Read More »

ETF Trends, Patterns and Setups – Tech ETFs End 2020 with the Lead – Lots of Consolidations within Uptrends

We have an interesting mix of overbought ETFs and ETFs that are consolidating. ETFs that are overbought are not outright bearish, but they do not have tradable setups. The overbought ETFs are the current leaders because they are the ones with the biggest gains and the ones trading at 52-week highs. ETFs that are consolidating within uptrends have tradable setups, such as bullish flags, pennants

ETF Trends, Patterns and Setups – Tech ETFs End 2020 with the Lead – Lots of Consolidations within Uptrends Read More »

Timing Models – Bulls in Control, but Short-term Participation Narrows

The broad market environment remains bullish, but the picture is turning mixed as fewer stocks follow the major indexes higher. The S&P 500 SPDR, Nasdaq 100 ETF and Russell 2000 ETF moved to new highs this week and are positive the last 16 trading days, but the S&P 500 Equal-weight ETF did not hit a new high this week is down around 1% the last 16 days. The equal-weight S&P 500 represents performance for the “average” stock in the S&P 500. I am also seeing some underlying weakness in short-term breadth for the S&P 500 and the technology sector.

Timing Models – Bulls in Control, but Short-term Participation Narrows Read More »

ETF Trends, Patterns and Setups – Techs Extend and Lead, Banks and Energy Stall, Gold Hits Resistance

The bulls remain in the driver’s seat when it comes to stocks. Strength within the stock market is broad with the S&P 500, Nasdaq 100 and Russell 2000 recording new highs here in December. There is also broad strength within the stock-related ETFs with dozens of new highs. Tech-related ETFs reasserted themselves as the true leaders with breakouts in late November and new highs throughout December. Keep in mind that these ETFs also recorded new highs

ETF Trends, Patterns and Setups – Techs Extend and Lead, Banks and Energy Stall, Gold Hits Resistance Read More »

Finding Next Generation Growth Stocks (QQQJ) and Understanding the Momentum Effect

There is a new ETF in town that promises big potential. The Invesco Next Generation Nasdaq 100 ETF (QQQJ) is based on an index with the same name. As the Invesco web site explains, 90% of its total assets will come from the underlying index and this index is based on the 101st to 200th largest stocks in the Nasdaq. This makes it a small and mid cap version of the Nasdaq 100. The ETF is

Finding Next Generation Growth Stocks (QQQJ) and Understanding the Momentum Effect Read More »

Weekend Video and Chartbook – Post Breakout Moves, Strong Participation, Tech Retakes the Lead, Short-term Consolidation Breakouts

Today’s video starts with the long-term picture for the big three: SPY, QQQ and IWM. All three are holding their breakouts with IWM extending the furthest and QQQ perking up this past week. We continue to see strong participation in the breadth indicators. Yield spreads remain at normal levels with the junk spreads narrowing even more in December. We will then turn to the new ETF ranking table to show how it can be sorted and viewed. Attention then turns to the ETF ChartBook. The Home Construction ETF (ITB) finally

Weekend Video and Chartbook – Post Breakout Moves, Strong Participation, Tech Retakes the Lead, Short-term Consolidation Breakouts Read More »

Timing Models – Breakouts Hold, Breadth Reflects Broad Participation, Fed Balance Sheet Pops

As with many things in life, we are usually better off focusing on the present when it comes to stock market analysis. Focus on what IS happening, as opposed to what MIGHT happen. This is a game of odds and the odds favor a continuation of current conditions, as opposed to a change. The trend, especially an uptrend, is more likely to continue than reverse. There will be plenty of things concerns along the way, but trend is the single most important factor and the trends are clearly up for the major index ETFs.

Timing Models – Breakouts Hold, Breadth Reflects Broad Participation, Fed Balance Sheet Pops Read More »

ETF Trends, Patterns and Setups – Tech ETFs Lead, Signs of Strength and Froth, lntermarket Dynamics

The technology-related ETFs are coming back to life with the Technology SPDR (XLK) and Nasdaq 100 ETF (QQQ) moving to new highs this week. These two are just playing a little catchup because several other tech-related ETFs already hit new highs in late November (SOXX, IGV, SKYY, HACK, FDN, IPAY, FINX). Energy and banks are attracting a lot of attention still, but these tech-related ETFs are the ones trading at new highs.

ETF Trends, Patterns and Setups – Tech ETFs Lead, Signs of Strength and Froth, lntermarket Dynamics Read More »

Weekend Video and Chartbook – Evidence versus Excess, Breakouts are Holding (not folding) and Bullish Patterns in Several ETFs

There are some signs of excess, but the weight of the evidence remains bullish. Today’s video will shows some excesses and some performance discrepancies since November 9th. Despite these concerns, the breadth models and indicators are bullish. In fact, participation is strong overall and SPY is holding its breakout. Stock alternatives, like TLT and GLD, remain in downtrends, as is the Dollar. We are seeing medium-term breakouts

Weekend Video and Chartbook – Evidence versus Excess, Breakouts are Holding (not folding) and Bullish Patterns in Several ETFs Read More »

Timing Models – Broad Participation during Uneven Advance – Evidence Bullish with Signs of Excess

The major index ETFs notched fresh new highs this week with the Russell 2000 ETF leading the way. Despite new highs, the market advance is quite uneven. As of 10AM Friday morning, IWM was up around 1.5% for the week, while SPY was down 1.2% and QQQ was down around 1.6%. It is not often that we see such seesaw action. As we will see in detail below, there is also a significant performance discrepancy since the open on November 9th (vaccine day).

Timing Models – Broad Participation during Uneven Advance – Evidence Bullish with Signs of Excess Read More »

Scroll to Top