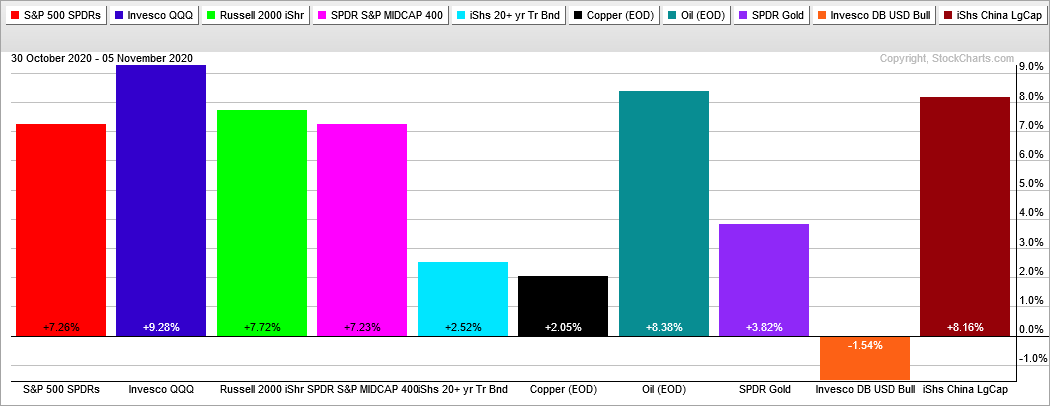
Pretty much everything moved higher the last four days. Well, everything but the Dollar. Stocks surged with QQQ leading the charge. Money did not rotate out of safe-haven bonds as the 20+ Yr Treasury Bond ETF and Corporate Bond ETF gained over 2%. Oil was up over 7%, copper was up around 2% and the Gold SPDR took advantage of Dollar weakness with a 3+ percent gain. Emerging markets also took advantage of a weak Dollar as the Emerging Markets ETF (EEM) gained over 6% and China Large-Cap ETF surged over 8%.
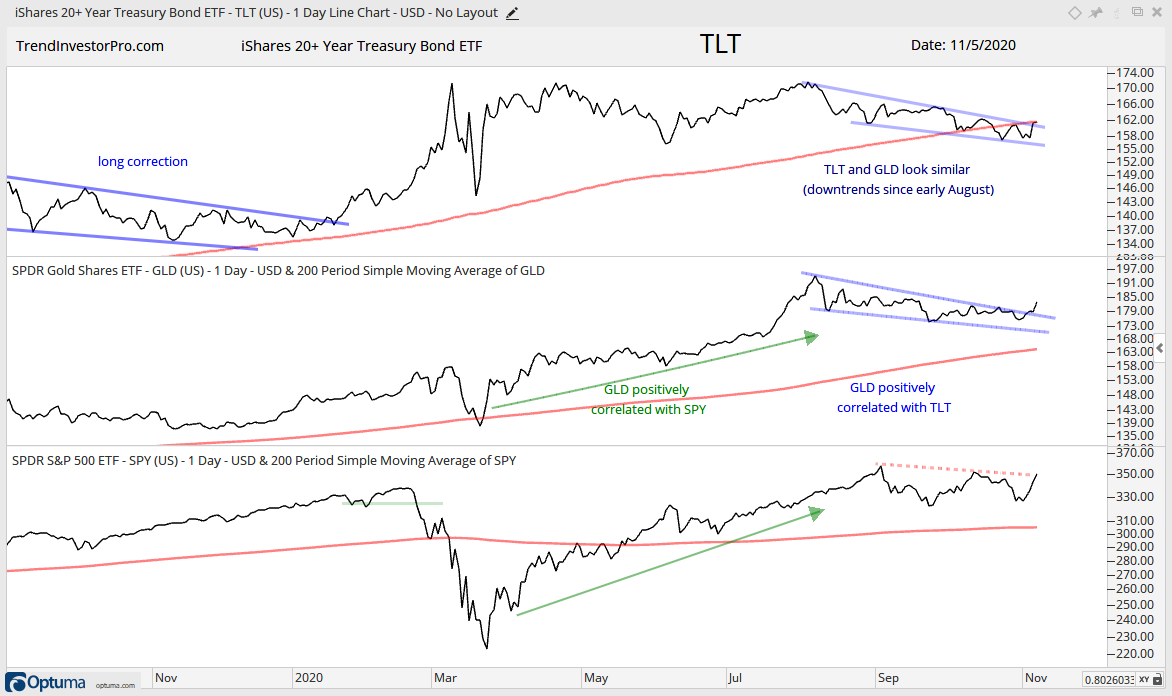
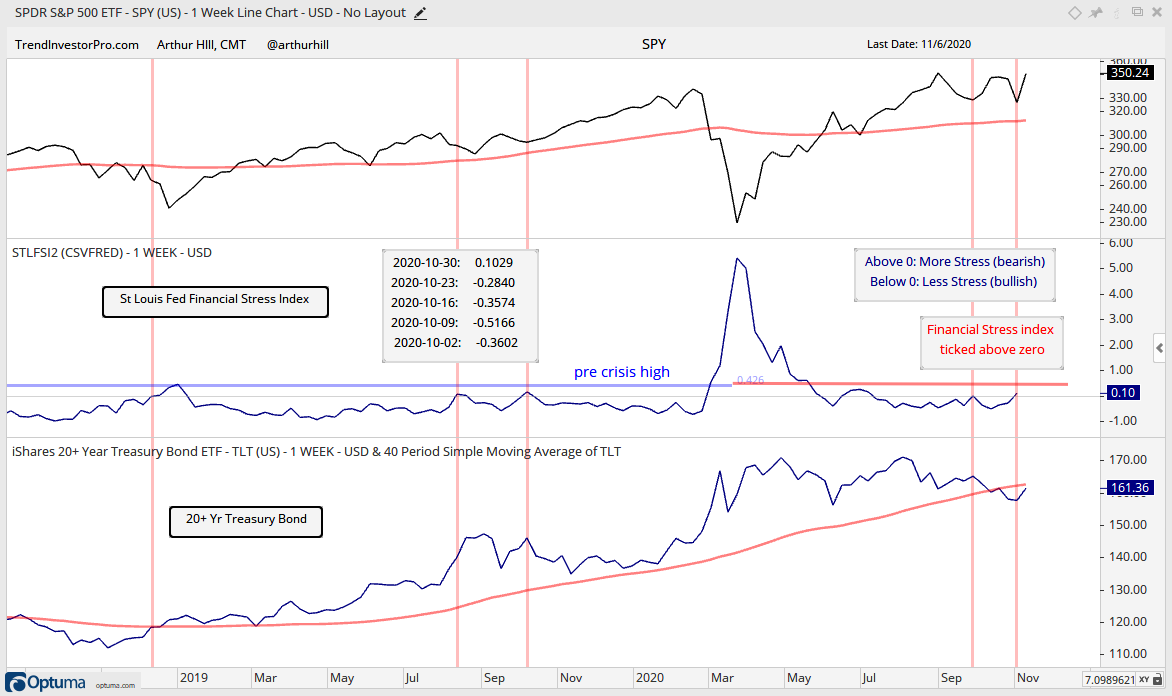
The employment report is today and this often rattles the bond market. For now, TLT is going for a wedge breakout and trying to recoup its rising 40-week SMA. As bullish as this setup seems, stocks are in bull mode right now and are likely to outperform bonds as long as they stay in bull mode. The Gold SPDR, however, is clearly divorcing itself from TLT with a wedge break and move above the October highs. This signals an end to the correction and a resumption of the bigger uptrend.
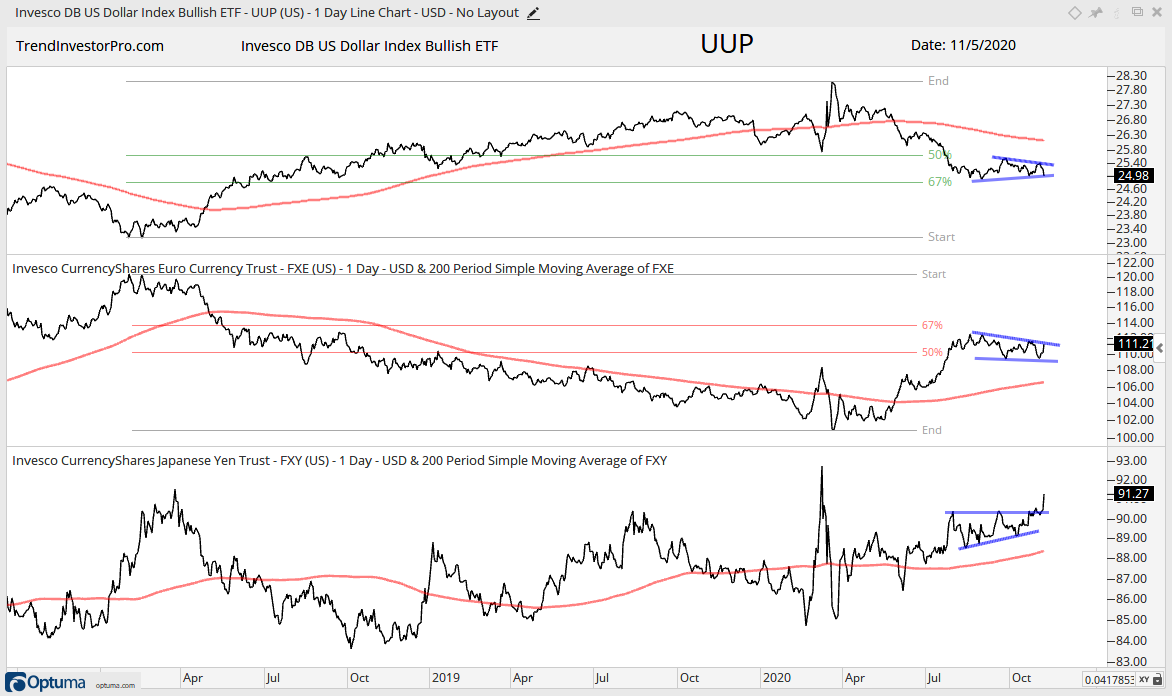
Last week, which seems like a month ago, UUP appeared to be firming in the 50-67% retracement zone and FXE hit resistance in this corresponding zone. This theory was turned on its head this week with a sharp decline in the Dollar, a surge in the Euro and a breakout in the Yen ETF (FXY). It now appears that the Dollar has a bearish continuation pattern and is breaking down, while the Euro sports a bullish continuation pattern and is poised to break out.
SPY and QQQ Establish Big Support
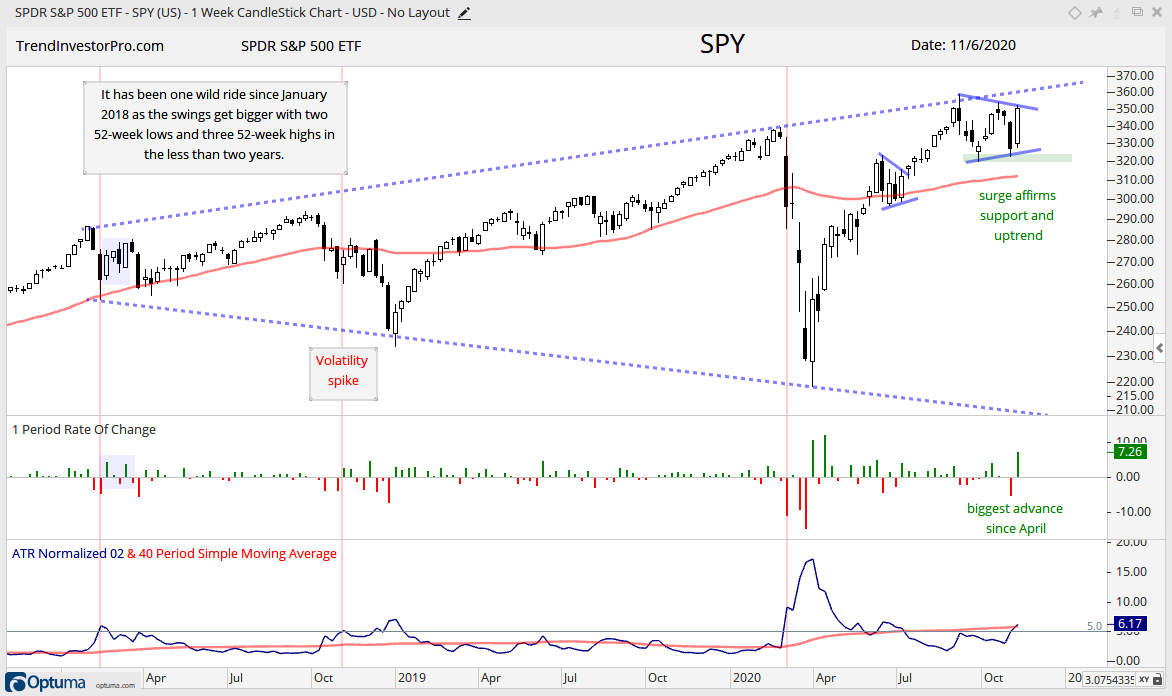
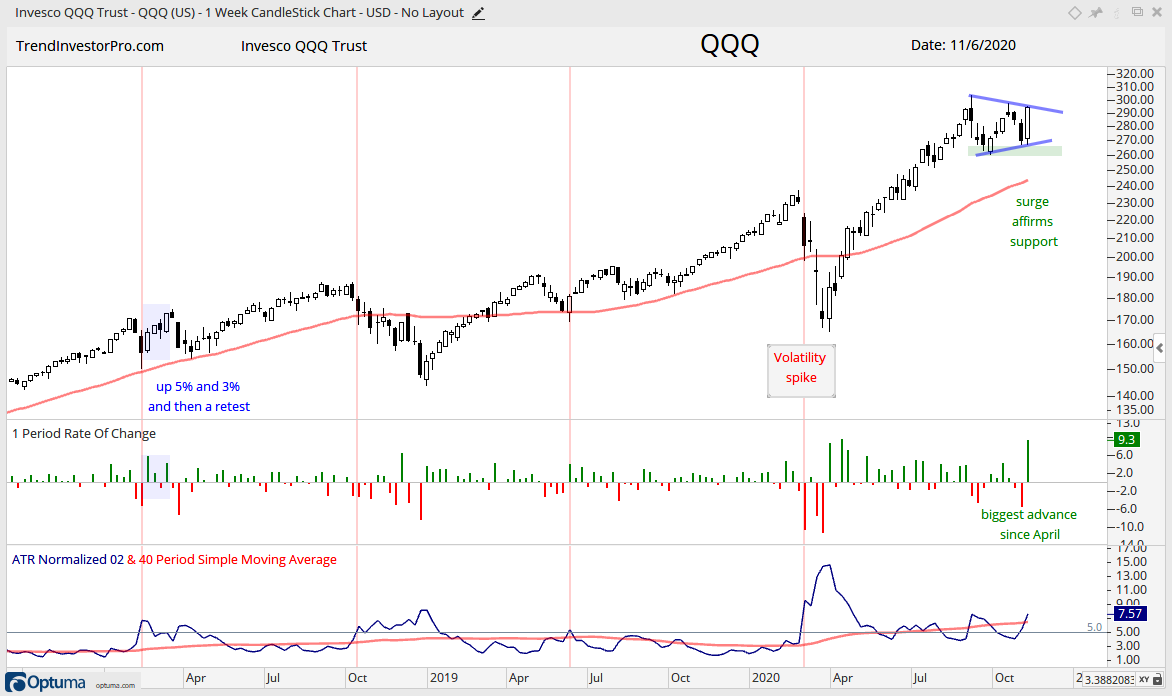
This week’s surge in the S&P 500 allows us to draw a triangle on the weekly chart and establish a clear support level to watch going forward. SPX is up over 7% so far this week and, barring a massive decline on Friday, this will be the biggest weekly advance since early April. The move establishes a pivot low and affirms support in the 320-330 area. Adding a line from the September-November lows, we now have a triangle taking shape and this is considered a consolidation within a bigger uptrend, which is a bullish continuation pattern.
While the bulls are clearly in control above 320, volatility continues to rise and reached its highest level since June. The bottom window shows Normalized ATR, which is ATR(2) divided by the close. This indicator is above 5 (horizontal line) and above its 40-week SMA, which shows volatility on the rise. The red vertical lines show the last occurrences. There was also a volatility spike during the election week in November 2016, but volatility subsided the next two weeks as the advance continued at a more reasonable pace. Despite rising volatility, I will continue to watch price and breadth for the ultimate signals.
The next chart shows the Nasdaq 100 ETF (QQQ) with similar characteristics. QQQ is up over 9% this week and a triangle formed since early September. The September-October lows mark key support and the trend is up as long as these hold. Way back in 2018, a three to five percent weekly move was considered extraordinary in QQQ. As the blue shading shows, there were two such moves in February-March 2018. These occurred after a volatility spike (red vertical line) and QQQ fell back to the February lows.
The base case is bullish for stocks. The trend is up for the major index ETFs, the breadth models are bullish and the financial indicators show no stress in the credit markets. Until proven otherwise, new highs are expected in November and/or December.
Mid-caps and Small-caps Forge Higher Highs
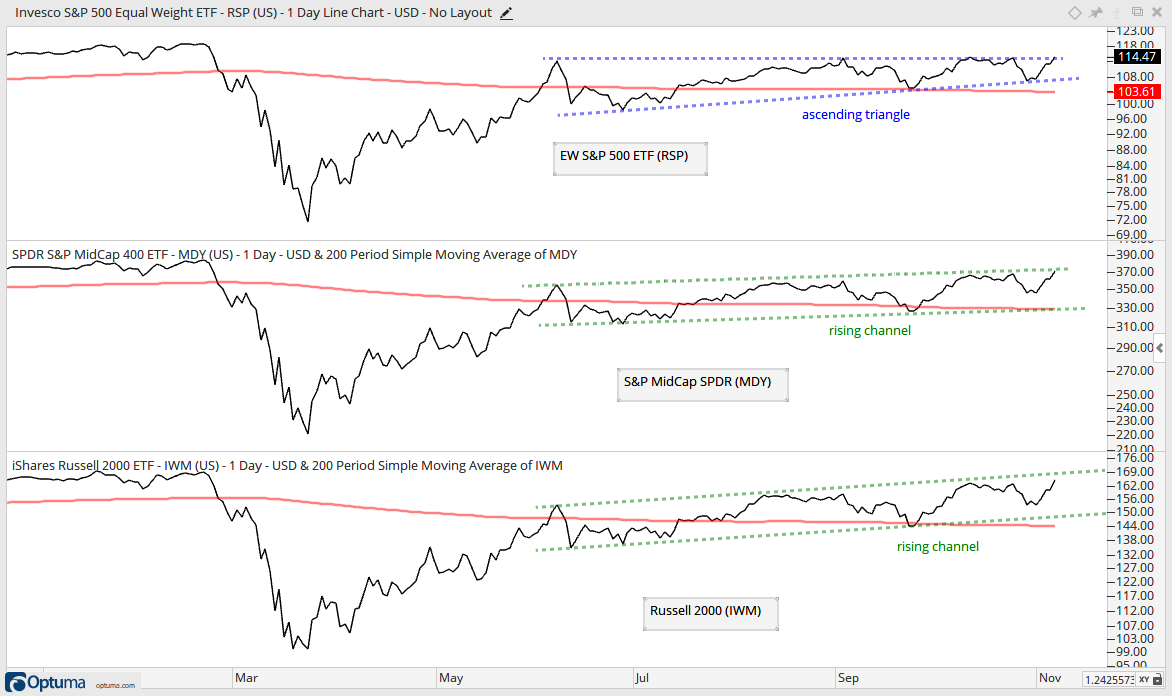
The next chart shows the S&P 500 EW ETF (RSP) with a bullish Ascending Triangle and breakout in the making. The S&P MidCap 400 SPDR (MDY) and Russell 2000 ETF (IWM) are a touch stronger with rising channels and higher highs from October to November. Note that SPY and QQQ have yet to record new highs for this cycle (since the March low), but MDY and RSP are already at new highs for the cycle. This reflects a broadening of the advance and this is bullish.
Breadth Models Remain Largely Bullish
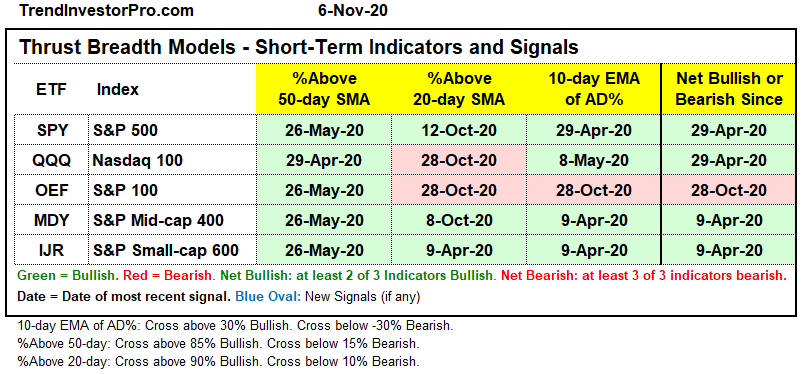
There is no change in the short-term breadth models. Four of the five remain net bullish (since April). The S&P 100 turned net bearish at the end of October and there is one bearish signal in the Nasdaq 100, but the weight of the evidence on this table is clearly bullish.
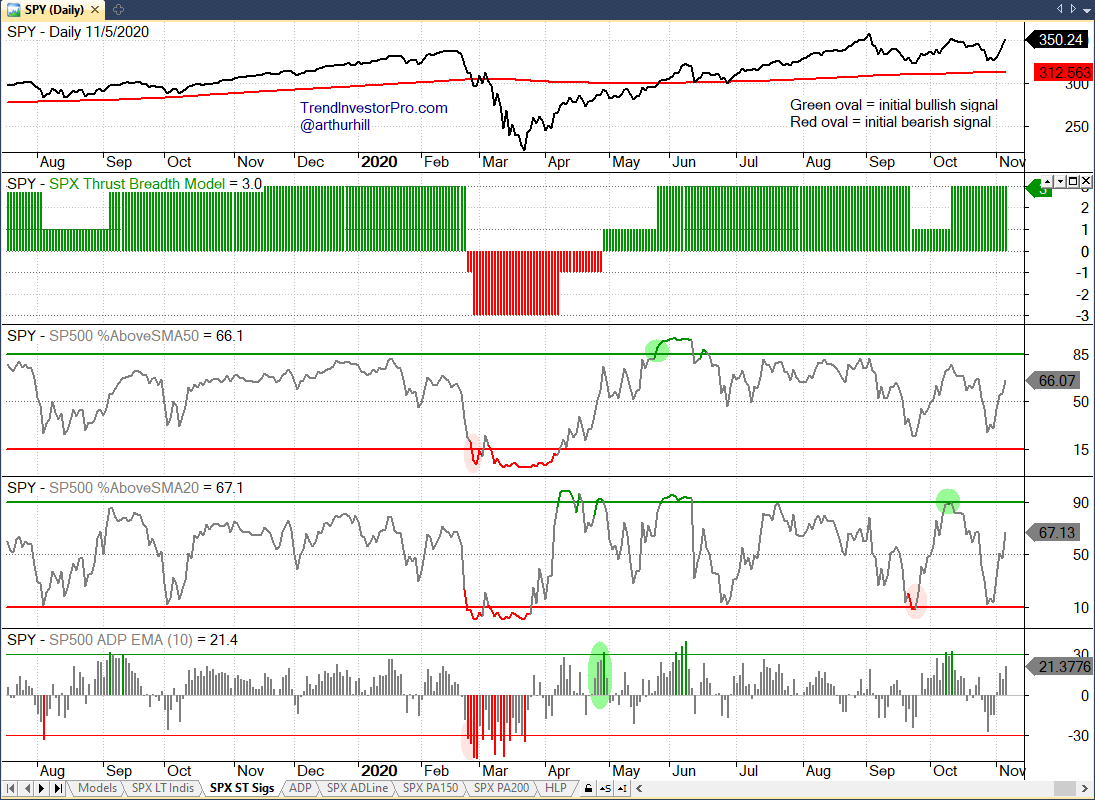
The indicators in the SPX Thrust Model turned up sharply this week. %Above 20-day SMA moved from 11.7% to 67.13% and the %Above 50-day SMA moved from 27.2% to 66.07%. Both held above their bearish thresholds in late October.
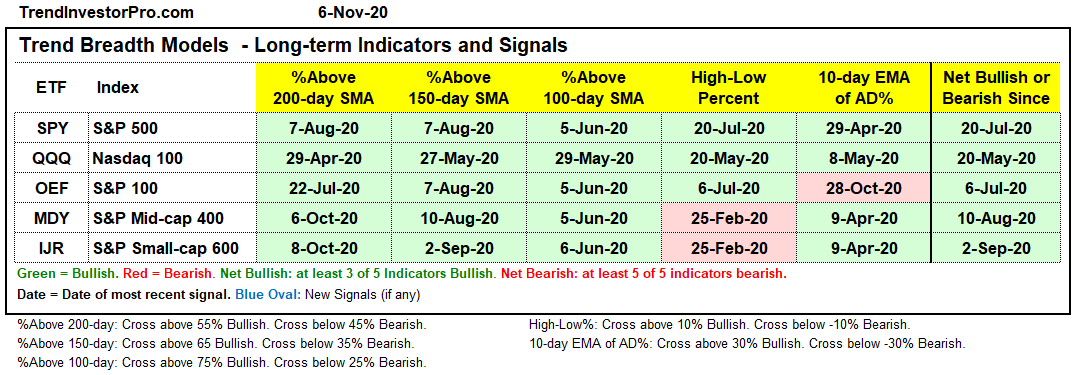
There is no change in the long-term breadth models. 22 of the 25 signals are bullish and the weight of the evidence for stocks is bullish. The High-Low Percent indicators for small-caps and mid-caps continue to lag, but could trigger bullish with moves above +10% should the market extend higher the next few weeks.
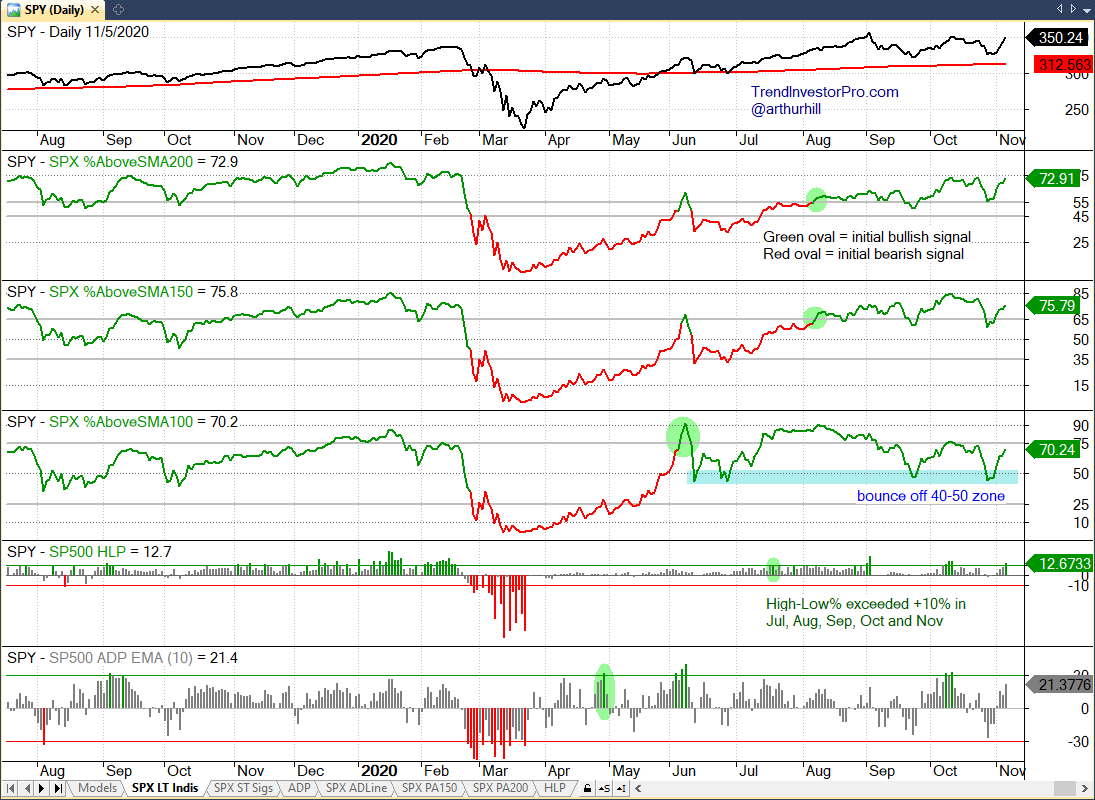
Needless to say, indicators in the SPX Trend Breadth Model improved this week. Over 70% of stocks are above the 100, 150 and 200 day SMAs. Also notice how %Above 100-day SMA bounced off the 40-50 zone for the third time since June (blue shading). High-Low Percent moved above 10% for the fifth straight month (Jul, Aug, Sep, Oct, Nov). Even though we have yet to see this indicator exceed 20%, as it did in January, regular moves above +10% show enough strength to support the uptrend.
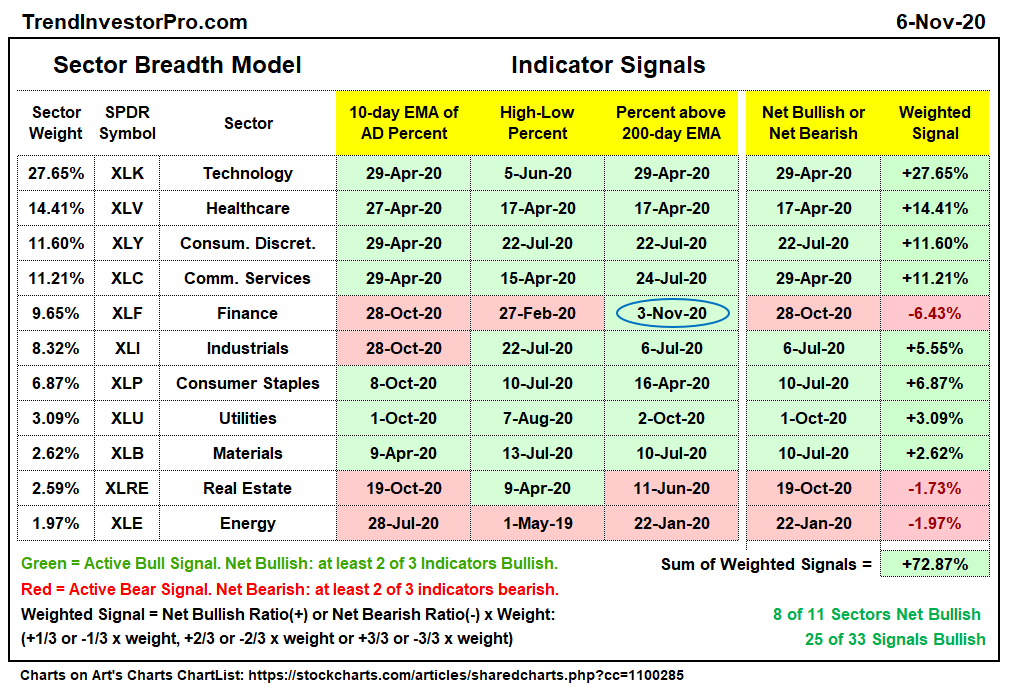
There was one new signal in the Sector Breadth Model as %Above 200-day EMA exceeded 60% for the Finance sector. This is not enough to turn the sector net bullish should and it remains one of the weakest sectors overall. Overall, four of the big six are fully bullish: Tech, Healthcare, Consumer Discretionary and Communication Services. Industrials is net bullish.
The charts used in the Sector Breadth Model can be found on the Art’s Charts ChartList. They are on page 8 if viewing 10 per page.
Yield Spreads and Fed Balance Sheet
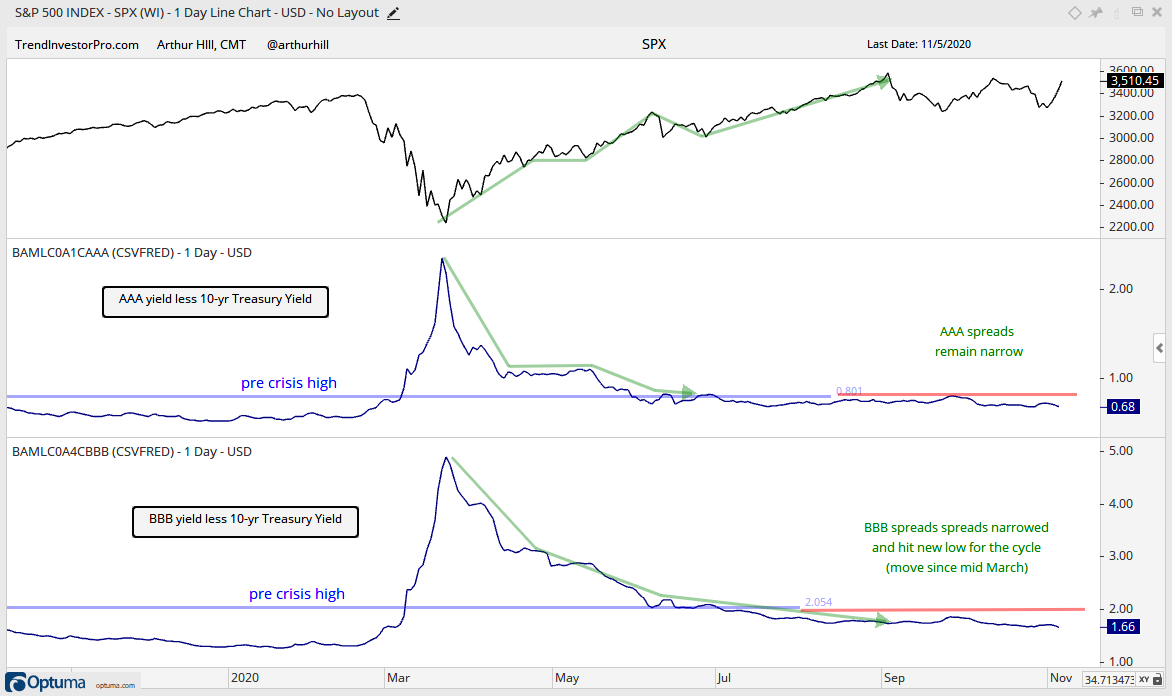
AAA bond spreads remain narrow and BBB bond spreads moved to new lows for the cycle (decline since mid March). There are no signs of stress in investment grade bonds and this is net positive for stocks.
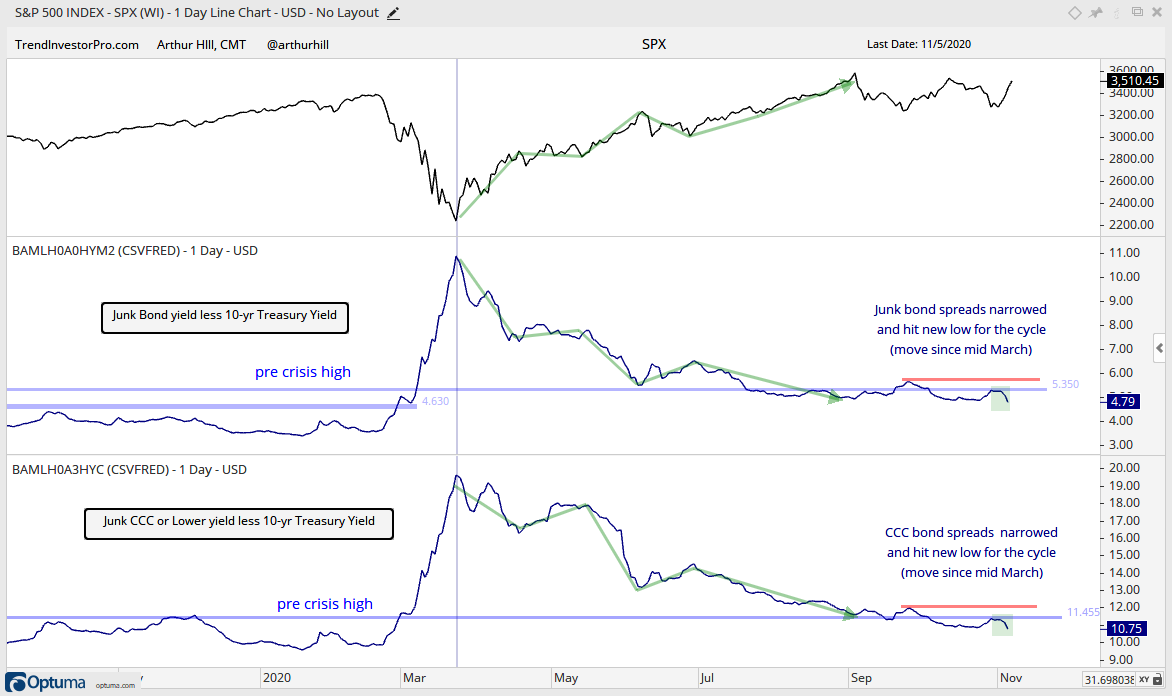
Junk and CCC bond spreads narrowed sharply over the past week and both hit new lows for the cycle. This is the most fragile part of the bond market and there are no signs of stress. The red lines mark my lines in the sand and a widening above these levels would be negative for stocks.
The St Louis Fed Financial Stress Index ticked above zero for the second time since early July. There is some lag in this weekly indicator because the last data date is 30-Oct and the Fed releases this five to six days after the last data date. It was also positive at the September low and then moved back below zero.
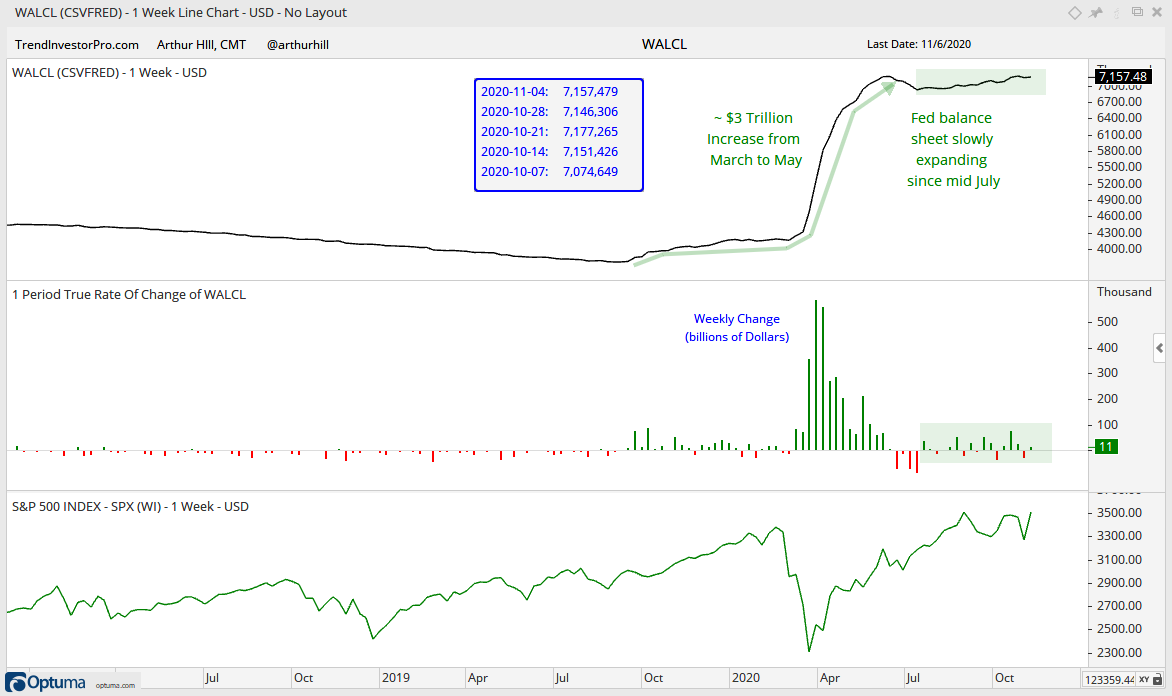
The Fed balance sheet expanded by $11 billion. Overall, the slow and steady expansion since mid July continues.
")