")
The AAII indicators make some waves this past week as AAII percent bears surged to 39.3% and percent bulls dropped to 22.40%. As a result, net bull-bear percentage plunged to -16.90%, the first negative reading since September 2020. Note that the remaining 38.3% are neutral, which is quite high. As a contrarian indicator, this bearish shift points to excessive bearishness that could give way to an advance. Let’s look at some actual signals and evidence.
On the chart below, the blue lines show when bull-bear net dips below -15% – after being above +15%. Prior to this week, there were five signals with mixed results. A six week correction followed the February 2017 dip below -15% and the market took off in late April 2017. The dip below -15% in April 2018 nailed the bottom and preceded an advance into September 2018.
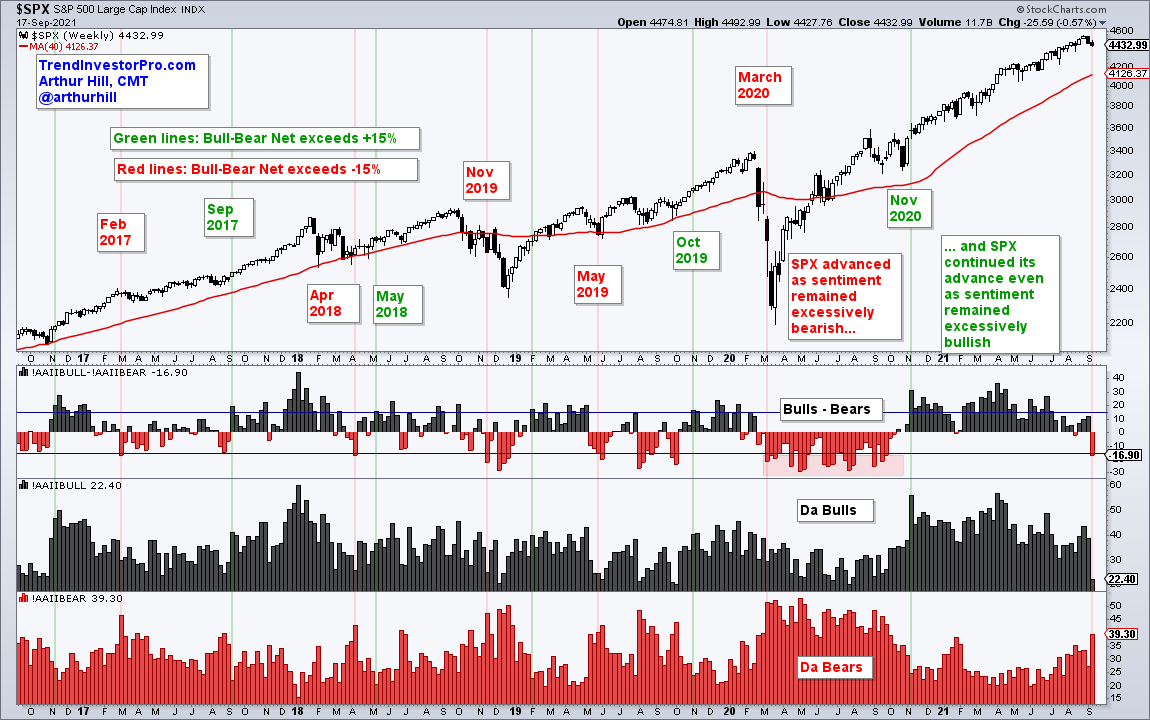
The S&P 500 bounced for one week after the dip below -15% in November 2019 and then plunged in December 2019. Not a very good signal. Signs of excessive bearishness nailed the low in May 2018 as the S&P 500 moved back above its 40-week SMA the very next week and continued higher into February 2021.
Now we get to the covid crash. Bull-bear net dipped below -15% in mid March 2021, but the S&P 500 fell sharply the very next week (~15%). This plunge marked the covid low as the S&P 500 bounced in late March and continued higher into September 2021 (and beyond). Notice how sentiment remained excessively bearish during this advance.
Of the five completed signals, the dips below -15% were very timeline in April 2019 and May 2019 (nailed the bottom). The February 2017 dip below -15% did not nail the bottom and might have been forgotten six week’s later, when the S&P 500 bottomed. The November 2019 signal was the least timely over the group, unless you sold the very next week. The signal in mid March 2020 was also not that timely as traders would have endured a 15% drawdown before turning profitable a few weeks a later. Lesson here: sentiment is interesting, but not that great for timing.