There are lots of long-term uptrends in the equity-related ETFs, but there are not many short-term bullish setups. Most of the setups materialized in early November as stocks declined in October and RSI moved into the oversold zone for dozens of ETFs. With the November surge, RSI moved above 70 within the last five days for more than half of the equity-related ETFs in the Core List.
The market surge triggered some new trend signals, which are listed below. There are very few new mean-reversion setups and playable pullbacks. I am seeing short-term bullish continuation patterns in XLV, XLU, IHI and REZ. There is also a bullish wedge in XLRE, but it remains stuck in a consolidation and is lagging almost everything else. These patterns are highlighted below.
ETF Grouping and Ranking by Trends, Patterns and Setups
Recent Trend and Mean Reversion Signals
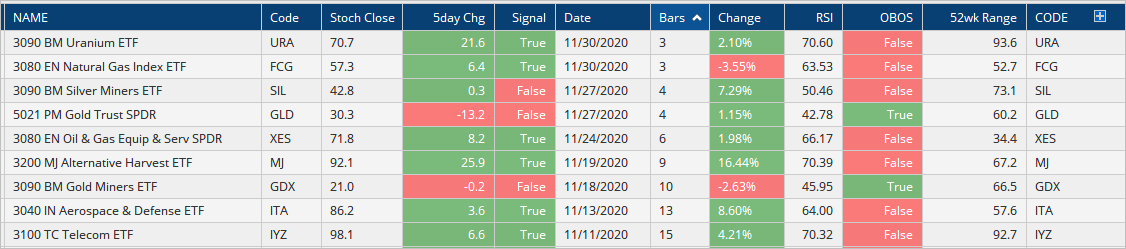
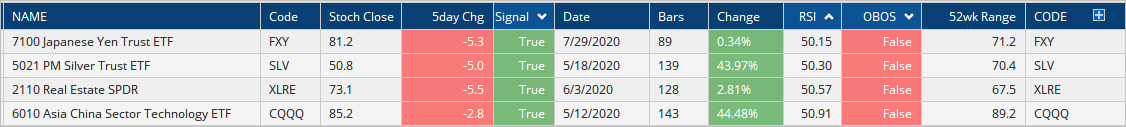
The images below are from the ranking tables using the Core ETF List, which has 117 ETFs. The first image shows the StochClose signals over the last three weeks. The Uranium ETF (URA) and Natural Gas ETF (FCG) triggered bullish trend signals three days ago, while the Silver Miners (SIL) and Gold SPDR (GLD) triggered bearish trend signals four days ago. TRUE (green) indicators a bullish signal and FALSE (red) marks a bearish signal. The Alternative Harvest ETF (MJ) triggered bullish nine days ago and is leading with a 16% gain since the signal. Trend-following is like a box of chocolates: you never know which signals will turn into winners and which will be duds.
There are four ETFs that are oversold with bullish StochClose signals. Note that I do not count oversold signals when StochClose is bearish (FALSE). StochClose is bullish and RSI is in the oversold zone for the Utilities SPDR (XLU), Homebuilders ETF (XHB) , Home Construction ETF (ITB) and China Internet ETF (KWEB). I will raise my chart awareness for these ETFs because mean-reversion setups are possible.
Steady and Strong Uptrend, New High
XLY, SOXX, FINX, PBW, TAN, PHO
ETFs in this first group have been in steady and strong uptrends since the March lows. They recently recorded fresh new highs and continue to lead. The first chart shows the Semiconductor ETF (SOXX) with a rather tight rising channel since June. Most tech-related ETFs stalled in September-October, but SOXX continued higher with new highs in each of the last three months. The ETF is getting extended because RSI is at 73 and this is short-term overbought. Keep in mind that overbought is not bearish. It just means the advance is getting extended and we could see a corrective period in the coming weeks.
The next chart shows the Clean Energy ETF (PBW) moving above the upper line of a rising channel and then falling back into the channel. PBW was up over 40% in November and RSI exceeded 80 (blue circle). Trend-followers would just ride the trend and absorb a pullback, which will come at some point. Traders playing the flag breakout and mean-reversion bounce might consider booking partial profits to lock in some gains.
You can learn more about ATR Trailing stops in this post, which includes a video and charting option for everyone.
ETFs in this next group led in November with big advances and recorded 52-week highs in the process. Some recorded their first 52-week highs since January-February (MDY, IJR, IWM), while others added to their 52-week high streak (XRT, XBI, DBB). RSI exceeded 70 for all of these ETFs over the last two weeks and they are quite extended short-term.
The first chart shows the Russell 2000 ETF (IWM) working its way higher from June to October and finally breaking out to a new high in November. The ETF was up some 20% in November and RSI exceeded 70 a few times. IWM is both bullish and extended. As such, I do not see a tradable setup and the ETF is in the monitoring stage.
The ATR Trailing Stop is shown for reference for short-term traders who took advantage of the island reversal. Note that the ATR Trailing Stop will be added to the Indicator Edge Plugin for StockCharts ACP next week.
You can learn more about ATR Trailing stops in this post, which includes a video and charting option for everyone.
The next chart shows the Retail SPDR (XRT) and the green zone shows when RSI is above 70. The first move above 70 does not often lead to a pullback or consolidation. It is usually when RSI has been flirting with the 70 area for two to four weeks. RSI has been flirting with 70 for seven days now and could have another week or two before signaling a pullback.
The next chart shows the Biotech SPDR (XBI) with a channel breakout in mid September and three pullbacks after the breakout. The RSI dip into the oversold zone and falling flag into early November provided the last playable pullback. Well, there was also a small pennant in mid November. XBI continues to move higher and hold the ATR Trailing Stop.
Long Ascending Triangle, Breakout and New High
RSP
The S&P 500 EW ETF (RSP) represents the “average” stock in the S&P 500 and the average stock is performing well since the Ascending Triangle breakout. RSP was lagging in late October and changed its lagging ways with this breakout. The ETF is benefiting from a broadening of the bull market as banks, industrials and energy come to life. The breakout zone in the 114 area turns first support to watch should we get a throwback.
The three healthcare-related ETFs in this group recorded new highs in early November and then formed short-term bullish consolidation patterns over the last few weeks. Over the last five days, RSI dipped to 40 for the Healthcare SPDR (XLV), to 45 for the Medical Devices ETF (IHI) and did not dip below 50 for the Healthcare Providers ETF (IHF). Technically, IHF held up the best of the three. Nevertheless, XLV and IHI were short-term oversold within bigger uptrends and this means mean-reversion setups in the making. The first chart shows XLV breaking out of a bull flag and the second shows IHI with a small falling wedge.
Triangle Breakout, Follow Through, New Highs
XLC, XLB
This is something I cannot stress enough: the setups and signals happen before the new highs and before the volatility expansion. Sure, an ETF can continue higher after a new high and big move, but we get the best reward-to-risk ratio during the pullback and volatility contraction. This is why we need to study the price charts and raise awareness during dull periods.
The Communication Services SPDR (XLC) presents us with a classic case in point. The ETF hit a new high and then moved into a triangle consolidation. The range narrowed and this reflected a volatility contraction. RSI also dipped into the oversold zone. XLC broke out with a gap and strong move on November 4th and followed through with another strong move the last six days. This puts XLC in the trend-monitoring phase.
Consolidation Breakout, New High and Above Breakout
SPY, SKYY, IBB
The next three ETFs broke out of consolidation patterns recently and are holding above these breakouts. The chart below shows SPY with a triangle consolidation in September-October and a breakout on November 9th (vaccine day). SPY held this breakout and worked its way higher the last few weeks. The bears do not have a leg to stand on as long as this breakout zone holds (call it 350). A move below 350 might seem short-term negative, but it would not be enough to affect the bigger uptrend and would probably lead to the next mean-reversion setup (RSI in oversold zone).
Consolidation Breakout, At or Near New High
QQQ, XLK, XLP, IGV, FDN, HACK
QQQ was a little late to the new high party in November, but it was very early to the new high party in June. Don’t forget that QQQ advanced over 80% and hit new highs in June, July, August and September. A rest is pretty normal after such an advance and the triangle consolidation represents the pause that refreshes. This is why I am not concerned with two months of relative weakness. QQQ was still in an uptrend and still leading on the 9-12 month timeframes.
On the chart above, QQQ surged with the rest of the market in early November and then stalled around the 290 area for three weeks. The ETF toyed with the upper trendline of the triangle and then continued higher the last six days, just edging above its early September high. This is a bullish configuration in a bull market. Note that APPL is breaking out of a triangle, while AMZN, MSFT and FB remain within triangle consolidation patterns.
Here is a link to video covering SPY, QQQ, GOOGL, AAPL, AMZN, MSFT, FB and WBA. These segments will also be shown on Next Level Charting (StockChartsTV).
The next chart shows the Software ETF (IGV) with an Ascending Triangle. In contrast to the lower high in the QQQ triangle, the Ascending Triangle shows equal highs from early September to early November. This means buying pressure pushed prices back to their prior highs, as opposed to slightly lower highs in QQQ. The higher lows show buying pressure coming in at higher price levels and IGV is on the verge of a breakout. In fact, the ETF hit a new high this week and is still a leader.
Some ETFs consolidated with falling channels because they formed lower highs and lower lows in September-October. Even though they did not hold up as well as ETFs that formed triangles, a 2 month falling channel after a new high is still a consolidation within an uptrend and a bullish continuation pattern. The chart below shows the Cyber Security ETF (HACK) reversing the downswing within the channel with a surge on November 4th and following through by exceeding the mid October high. Note that the Cybersecurity ETF (CIBR) is a little stronger than HACK because CIBR recorded a 52-week high this week.
Breakout, Above 200-day
LQD, HYG
There is a clear separation in the bond market. The corporate bond ETFs (LQD and HYG) are performing well with recent breakouts, but the 20+ Yr Treasury Bond ETF (TLT) remains in a downtrend since August. Nobody wants safety (Treasuries) when stocks are in bull mode. LQD and HYG are more tied to the economy and credit conditions. The Aggregate Bond ETF (AGG) is caught in the middle: weighed down by Treasuries and buoyed by investment grade corporates. The Inflation-Protected Treasury Bond ETF (TIP) is performing much better than TLT, but still positively correlated TLT.
The first chart shows the Corporate Bond ETF holding above its rising 200-day in late October and breaking out of a falling wedge. The second shows the High-Yield Bond ETF (HYG) breaking out of an Ascending Triangle and holding this breakout. Both have yet to record new highs here in Q4. Nevertheless, the rise in corporate bonds means yield spreads are narrowing and credit conditions are good.
New High in October, Stuck in Consolidation, Lagging
ITB
The Home Construction ETF (ITB) is a tough call because the long-term trend is up and the ETF recorded a 52-week high in mid October, less than two months ago. However, while SPY and IWM moved to new highs in November-December, ITB stalled and is trading closer to its September low than its October high. Even so, volatility is contracting and RSI continues to flirt with the oversold zone. A setup is in the making and we should be raising our awareness. I will keep a close eye on ITB for any signs that the correction and volatility contraction are ending.
The ETFs above are clearly leading because they notched 52-week highs over the last few months and are above their rising 200-day SMAs. ETFs below are not performing as well because they have yet to record 52-week highs or declined in recent months. Some surged in November and led the last three months, but they are still well short of 52-week highs.
November Leader, Breakout, Above June High
XLF, KRE, KIE, REM, MJ
The Regional Bank ETF (KRE) had one of the biggest moves over the last ten weeks with a 50% advance that exceeded the June high. This is a monster move that compares to the May-June surge. The trend is up with this breakout, but I am not interested in chasing after such a big move. Instead, I would rather let the dust settle and wait for a bullish setup to emerge, however long that may take.
Long Consolidation, Breakout, Short-term Consolidation
XLU, REZ
The Utilities SPDR (XLU) and the Residential REIT ETF (REZ) have short-term bullish setups working. Both broke out of long consolidation patterns (XLU first) and then consolidated above the breakouts. RSI dipped into the oversold zone for XLU, but did not for REZ. Nevertheless, both formed pennants or small falling wedges and breakouts would be bullish.
November Leader, Falling Wedge Breakout, below June High
XLE, ITA, XES, XOP, AMLP, FCG
Energy-related ETFs are in the same situation as KRE, but they are not as strong because they have yet to exceed their June highs. The chart below shows XES up some 70% since late October. The breakout is clearly bullish, but the ETF is too extended at the moment.
Even though energy ETFs are extended, the DB Energy ETF (DBE) remains with a breakout and is also in the midst of a strong move. DBE broke out of a falling channel in mid November, stalled with a pennant and broke out again on November 23rd. A very small falling flag formed the last few weeks and another mini breakout could be in the making.
Stuck in Long Consolidation Since June
XLRE
The Real Estate SPDR (XLRE) is one of the few equity-related ETFs that did not break out of a consolidation. The ETF surged to the resistance zone and fell back with a falling wedge. A short-term breakout could lead to a bigger breakout.
Falling Channel Wedge Breakout, but Tied to TLT
AGG, TIP
Downtrend Since August
TLT, GLD, SLV, GDX
The 20+ Yr Treasury Bond ETF (TLT) and Gold SPDR (GLD) have been falling together since August and remain in downtrends. The first chart shows TLT failing at resistance and RSI failing in the overbought zone, which acts as momentum resistance in a downtrend.
The second chart shows GLD closing below its 200-day for two days and bouncing back above the last two days. If you are going to pick a bottom (catch the falling knife), then this is as good a place as any. GLD is near the 61.8% retracement and back above the rising 200-day. RSI also bounced from seriously oversold levels, 27, which was the lowest RSI reading since August 2018. Personally, I am not a bottom picker and this is not my type of setup.
")