The major index ETFs notched fresh new highs this week with the Russell 2000 ETF leading the way. Despite new highs, the market advance is quite uneven. As of 10AM Friday morning, IWM was up around 1.5% for the week, while SPY was down 1.2% and QQQ was down around 1.6%. It is not often that we see such seesaw action. As we will see in detail below, there is also a significant performance discrepancy since the open on November 9th (vaccine day).
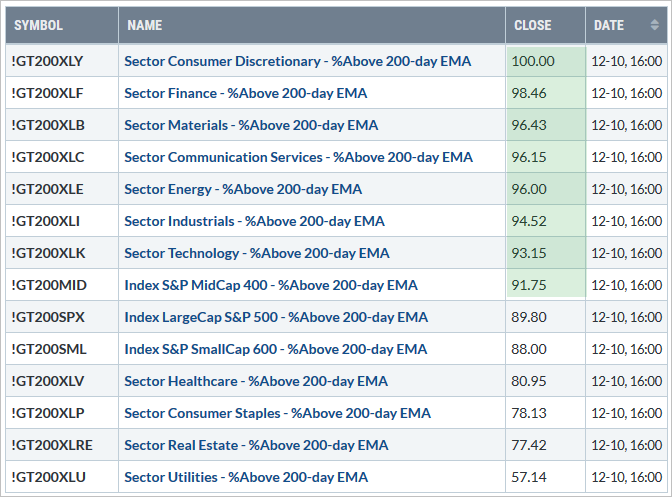
Despite uneven performance, the bulk of the evidence remains bullish and the breadth indicators reflect broad participation. SPY and QQQ are holding their triangle breakouts. Consumer Discretionary is leading the %Above 200-day EMA category with 100% and six other sectors have more than 90% of components above their 200-day EMAs (XLF, XLB, XLE, XLI, XLK). Yields spreads remain at very narrow levels that show normally functioning credit markets. The Fed balance sheet expanded a little as well this week.
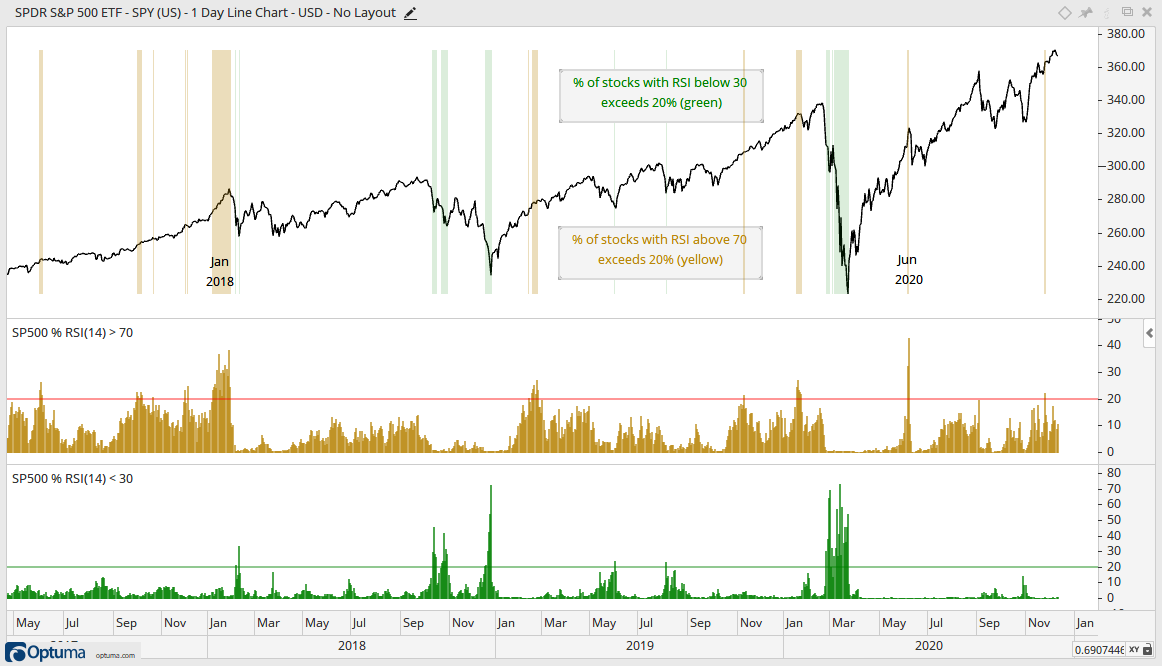
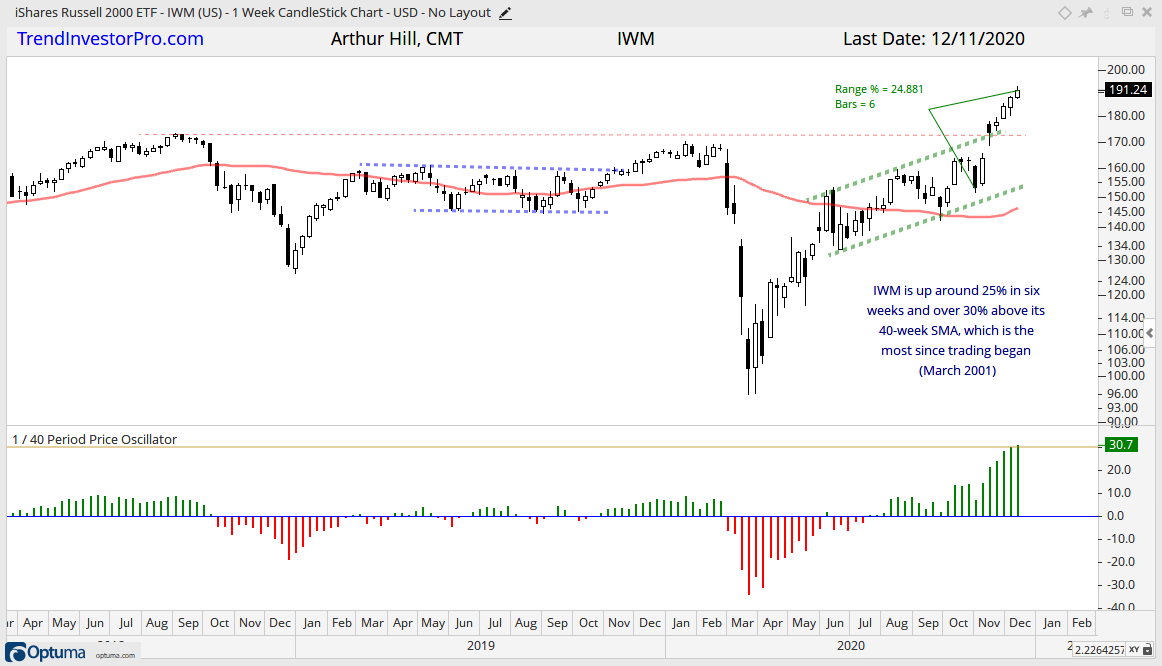
There are not any real negatives out there right now, just more signs of excess. As we will see in the charts below, IWM is over 30% above its 40-week SMA. SPY has been more than 15% above its 40-week SMA for three weeks now. The chart below shows the percentage of S&P 500 stocks with RSI(14) above 70 (yellow) and below 30 (green). More than 20% of S&P 500 stocks were “overbought” on November 24th. As with all excess and overbought indicators, they are not great for timing, but good for raising awareness. A serious excess occurs when RSI exceeds 70 for more than 30% of stocks, as occurred in January 2018 and June 2020.
Not Much to Show Since the Vaccine
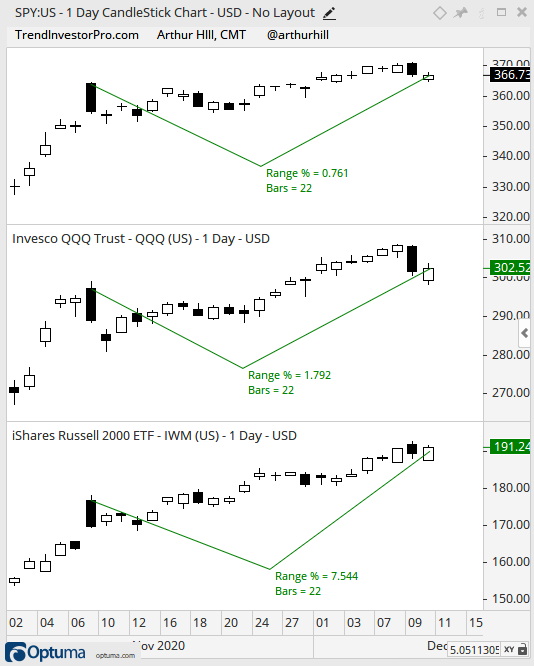
Stocks surged the first week of November (election week) and opened sharply higher the following Monday (vaccine day). SPY was up 11.5% from the close on October 30th to the open on November 9th and trading at a 52-week high (above 350). SPY is currently trading near 366 and up less than 1% since the November 9th open, which was one month ago. For the record, IWM is up around 7.6% from this open and QQQ is up less than 2% from this open. SPY and QQQ went nowhere the last 22 days.
Triangle Breakouts Hold in SPY and QQQ
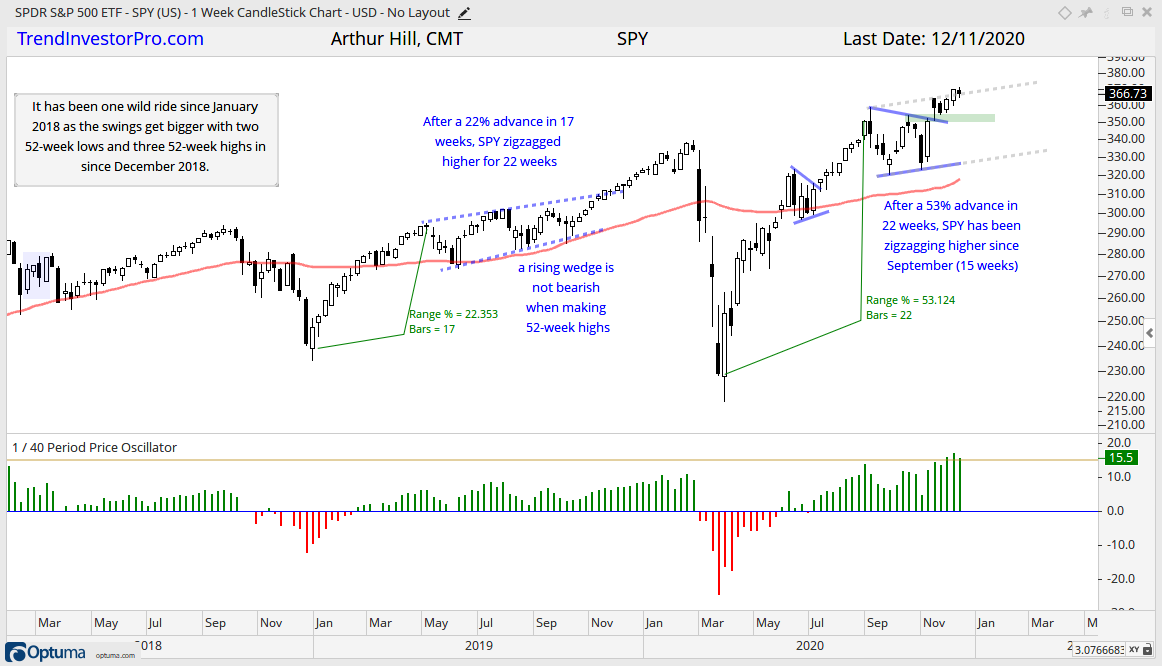
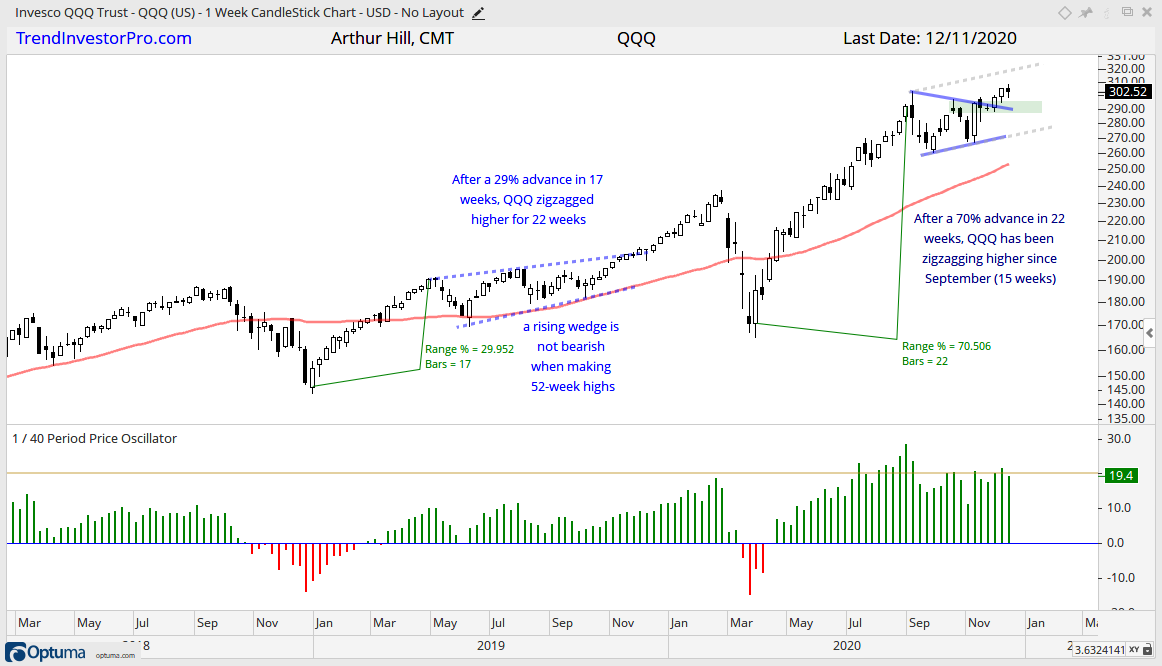
Despite no real gains to show the last 22 days, SPY and QQQ did go somewhere because they both notched new highs. In addition, both are holding above their triangle breakouts. Even though the breakout is clearly bullish, don’t be surprised if this becomes a zigzag advance (as from May to October 2019). The weekly chart shows SPY surging some 53% in 22 weeks and breaking out of the triangle consolidation. The breakout is holding and there are no signs of a “zag” lower right now. The green zone marks support from broken resistance in the 350 area and this is the first area to watch for a bounce, should we see a pullback to the breakout zone.
The next chart shows QQQ with similar characteristics and first support set in the 290-295 area.
IWM Goes Berserk
The next charts shows the Russell 2000 ETF (IWM) surging some 25% in six weeks and making up for years of underperformance with a break to new all time highs. It is a big and impressive move, but IWM is now over 30% above its 40-week SMA. This is the most EVER! Note that IWM began trading in March 2001. It is a sign of excess, but not a sign of weakness. Excess just means we need to be careful and on guard for a corrective period.
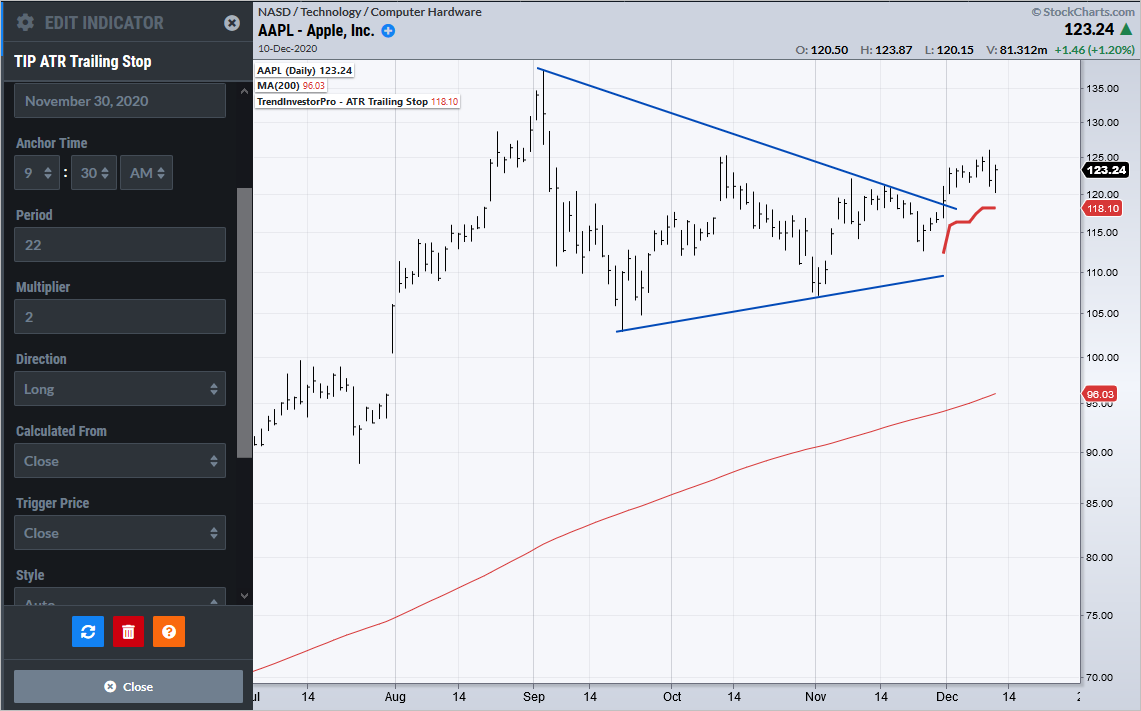
ATR Trailing Stop on StockCharts ACP
The ATR Trailing Stop and ATR Trailing Stop (SAR) are now available on the TIP Indicator Edge Plugin for StockCharts ACP. The “SAR” is for “stop and reverse” and works like the Parabolic SAR. This means the ATR Trailing Stop flips when triggered. I will put out an article and video covering this version next week.
Breadth Models Remain Bullish
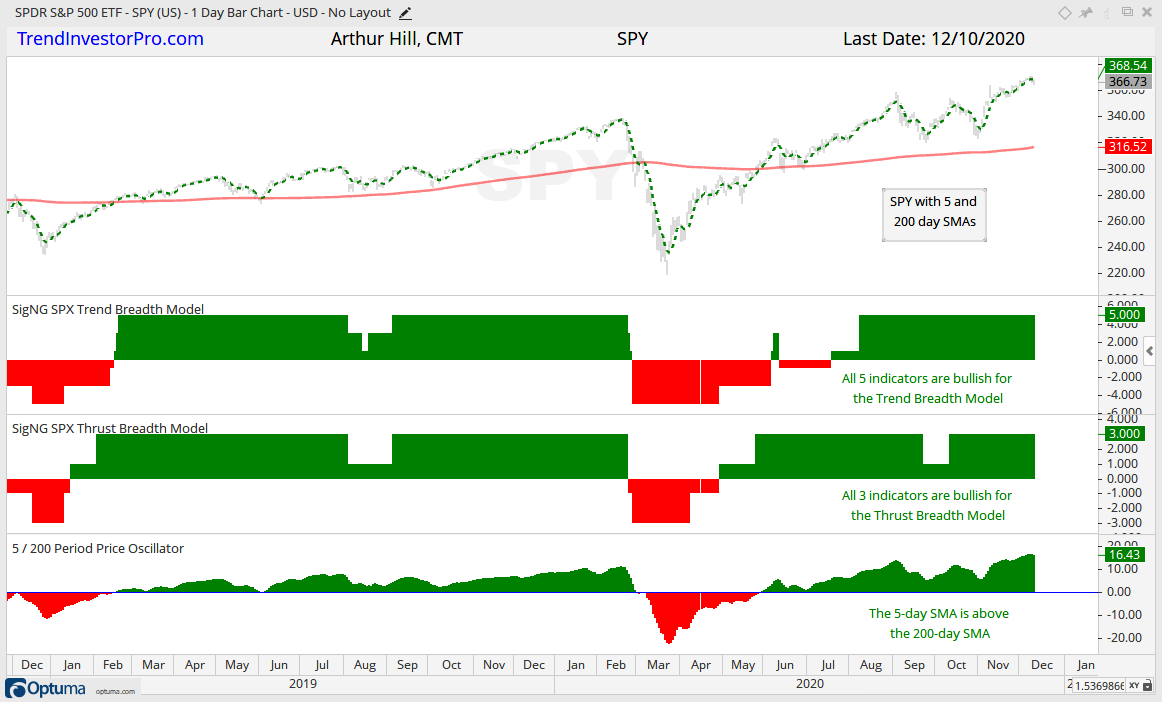
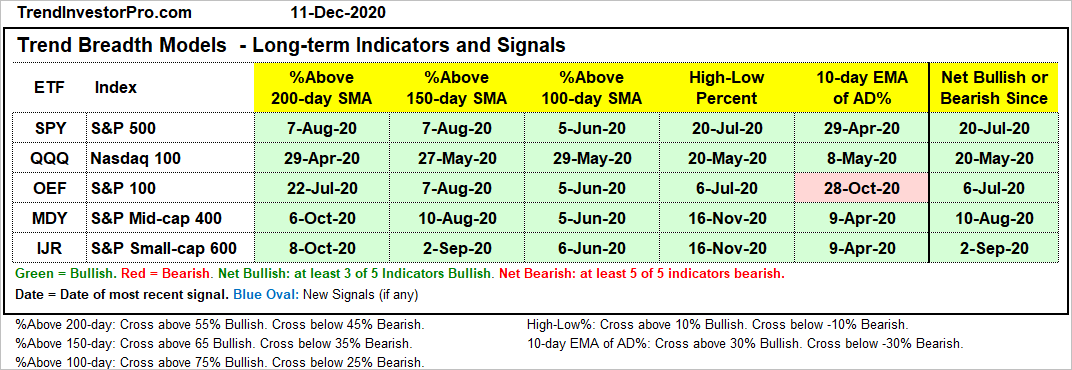
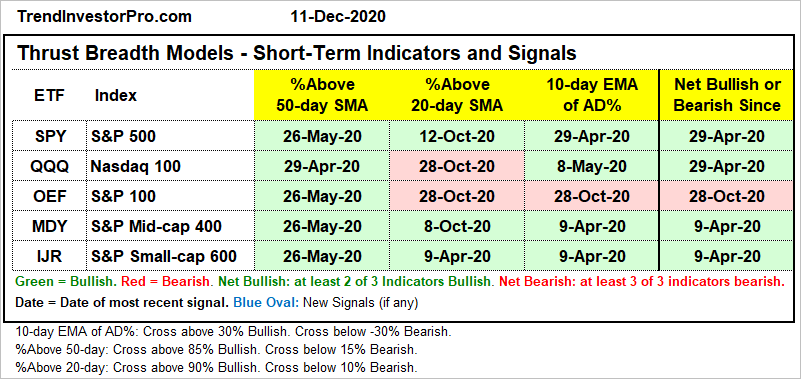
The S&P 500 breadth models remain firmly bullish and the 5-day SMA for SPY is well above the 200-day SMA. As the chart below shows, the Trend Model has been net bullish since mid July and all five indicators have been bullish since early August. The 5-day SMA crossed the 200-day SMA in late May to front run the Trend Model signal. The Thrust Model, which is more of a leading model, turned net bullish in late April. Note that the 5/200 cross is not used with the Thrust Model because it is a lagging indicator.
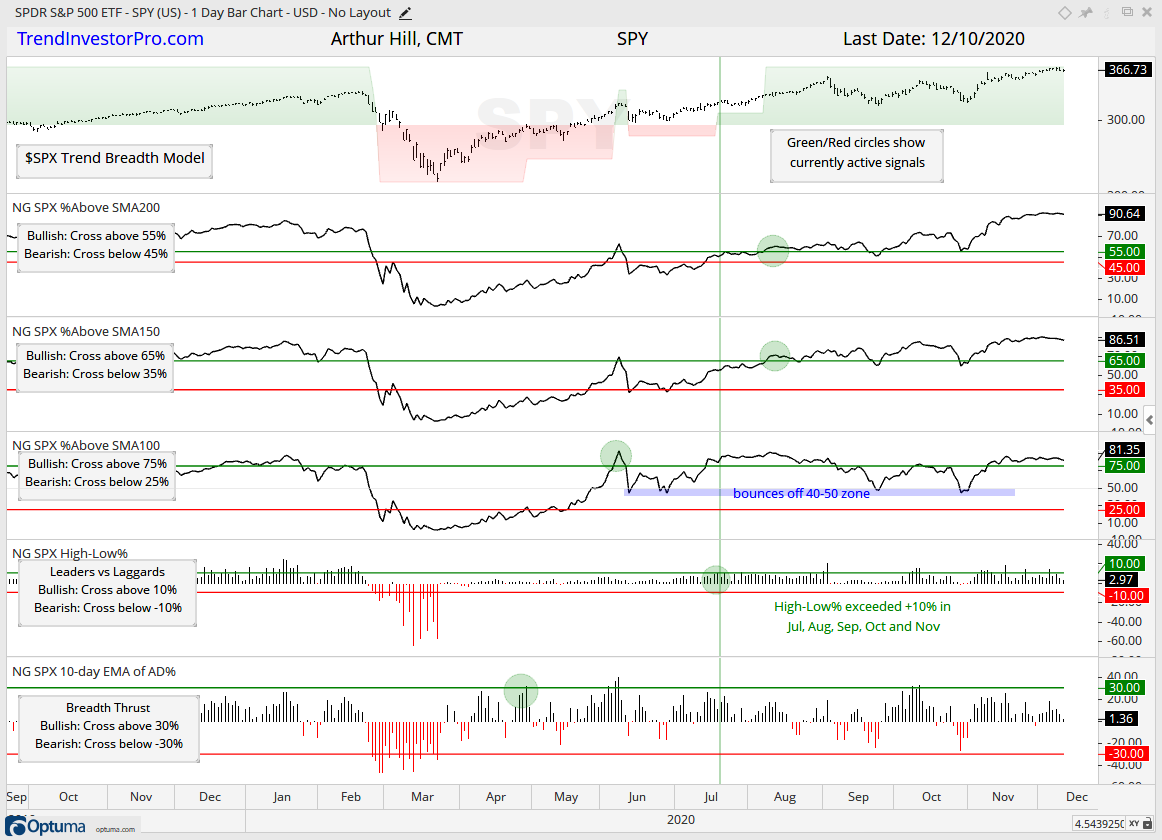
The next chart shows the Trend Model and related indicators for the S&P 500. Over 80% of stocks are above their 100, 150 and 200 day SMAs. This shows broad strength in the index. High-Low Percent exceeded +10% each of the last six months (including December). Overall, the number of new highs in the S&P 500 is not that inspiring, but there are more new highs than new lows and this is net bullish.
Overall, 24 of the 25 Trend Model indicators are on bullish signals. The 10-day EMA of S&P 100 AD% is the only bearish signal. Basically, the S&P 100 did not recover from the bearish breadth thrust in late October. The other four indexes did not trigger bearish breadth thrusts. Currently, over 80% of stocks in the S&P 500 and Nasdaq 100 are above their 100, 150 and 200 day SMAs. Over 90% of stocks in the S&P 100, S&P MidCap 400 and S&P SmallCap 600 are above their 150 and 200 day SMAs.
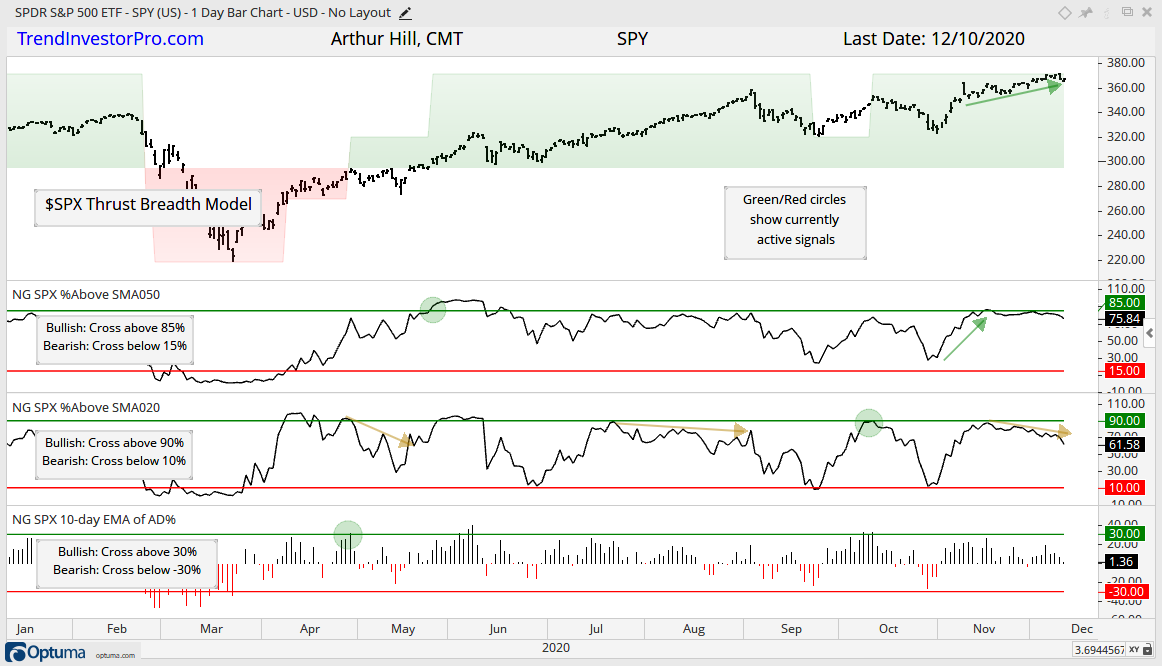
The next chart shows the Thrust Model and related indicators. The yellow arrows on the %Above 20-day SMA show deteriorating trend participation in May, August and now. This is not a major concern at the moment because well over 50% of stocks are above their 20-day SMAs. A dip below 50% could signal a correction, but this would only set up the next tradable pullback or consolidation.
Overall, 12 of the 15 Thrust Model indicators are on bullish signals. The %Above 20-day SMA for the Nasdaq 100 and S&P 100 triggered bearish in late October and did not fully recover here in November-December. Fewer stocks made it back above their 20-day SMAs on the current advance (fewer than in mid October, that is). This shows less participation on the upside, but the models are still broadly bullish. Strong downside participation is needed to trigger bearish signals and we have yet to see that.
You can learn more about the methodology and historical performance for these breadth models in this article.
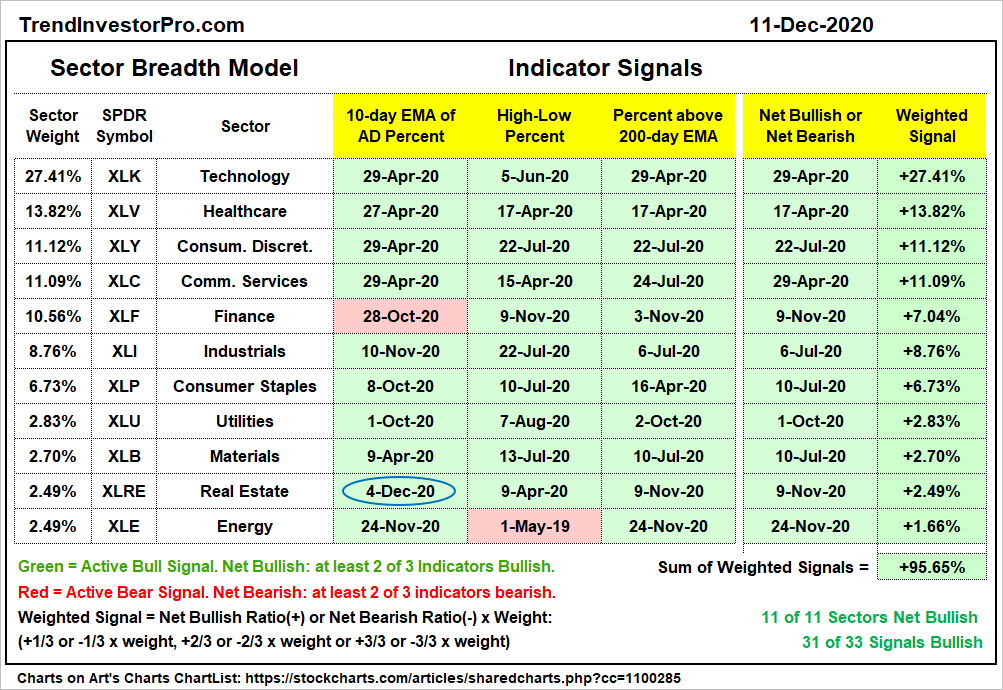
The Sector Breadth Model is broadly bullish with all 11 sectors net bullish and 31 of 33 indicators on bullish signals. The 10-day EMA of XLRE AD% surged above 30% last Friday to trigger bullish. Thus, all three REIT indicators are bullish. Even though the Finance SPDR is leading the last few months, the 10-day EMA of AD% did not exceed +30% to trigger bullish. This is why I have three indicators, just in case one is a little stubborn. XLE High-Low% ($XLEHLP) is also a laggard, but this is understandable because XLE needs to tack on another 36% to hit a new high. There was a new high in the sector though, just one (WMB).
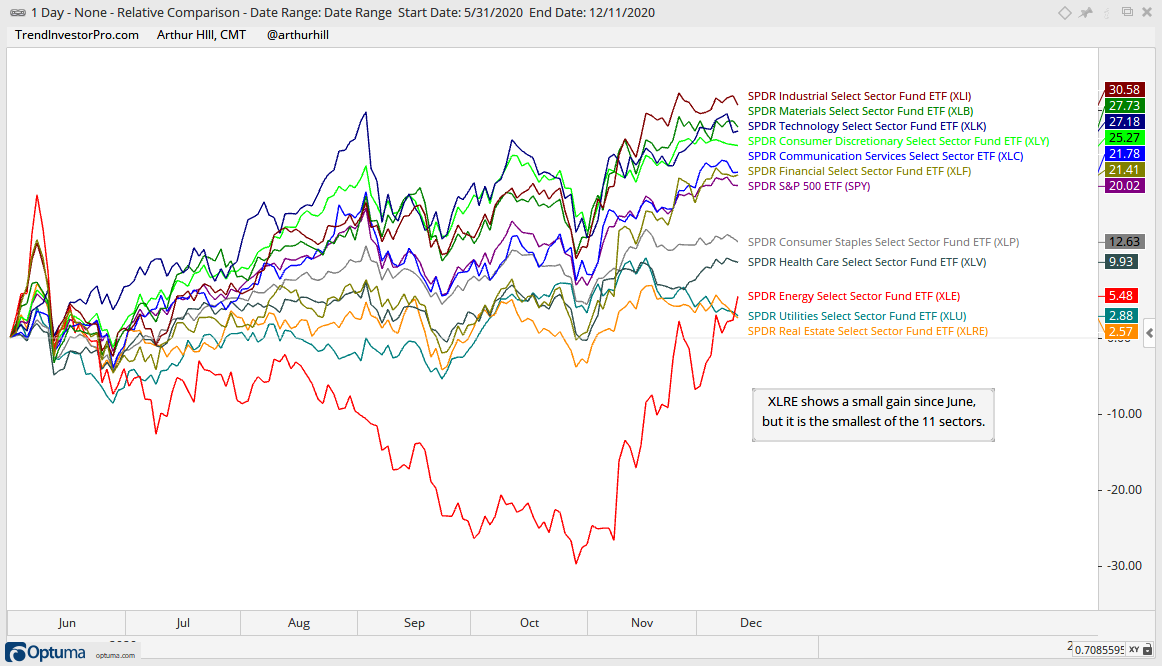
Even though XLRE is bullish on breadth, the ETF is the weakest of the 11 sectors since June and remains range bound. Notice that the Industrials SPDR (XLI), Materials SPDR (XLB) and Technology SPDR (XLK) are the top performing sectors since June (~6 months).
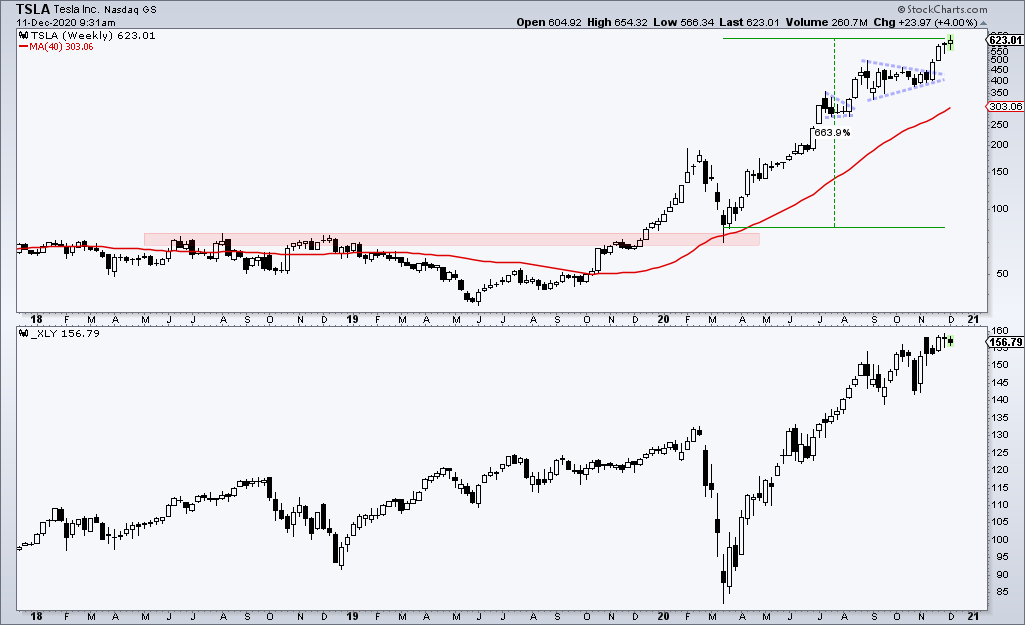
Here is a link to a video from RealVision featuring Jim Chanos, a legendary short seller. The title is: Time to Short Commercial Real Estate? Yes, I know, Chanos has also been short Tesla since 2016. Ouch! Keep in mind that his Tesla short is just one position in a portfolio that has a maximum position size of 5%. This means there are more than 20 positions.
Also note that Tesla will be added to the S&P 500 later this month and it will probably land in the Consumer Discretionary sector as an Auto Manufacturer. Amazon (21.66%) is the biggest component in XLY with a market cap of $1.55 trillion and Home Depot (10.74) is currently second with a market cap of $285 billion. Tesla has a market cap of $595 billion and will add some serious volatility to XLY. Of note General Motors accounts for 2.13% of XLY with a market cap of $60 billion, about a tenth of Tesla’s market cap.
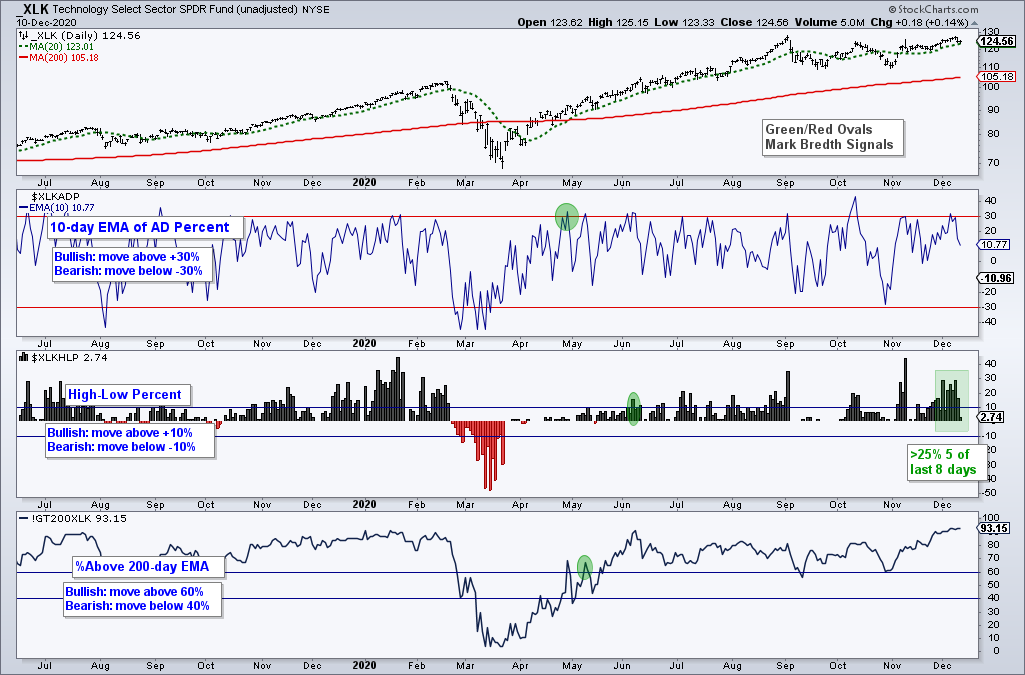
Tech Sector Leads New High List
The Technology sector continues to garner the most new highs. XLK High-Low% ($XLKHLP) exceeded 25% five of the last eight days. There are 74 stocks in XLK and High-Low Percent reached 28% twice in the last two weeks. This suggests that around 21 stocks in the sector recorded new highs. NDX High-Low% ($NDXHLP) reached 21 on December 1st and this also implies around 21 stocks hitting new highs in December.
Yield Spreads and Fed Balance Sheet
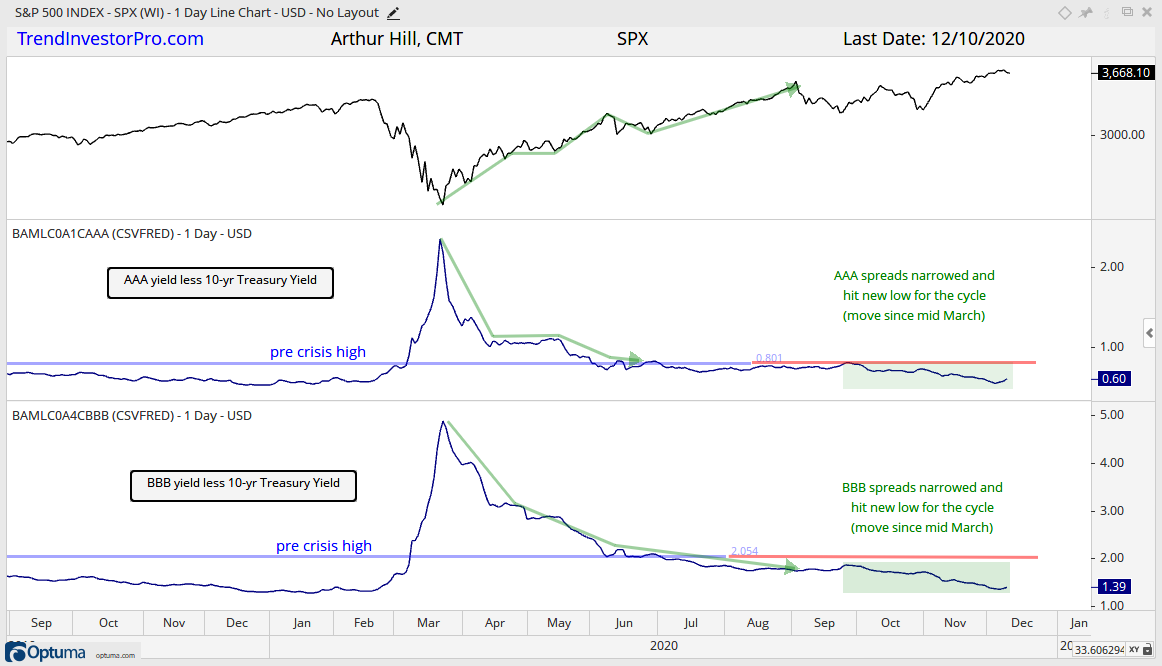
AAA and BBB yield spreads ticked up a little the last few days, but remain at low levels and indicative of normally functioning credit markets at the investment grade end of the curve.
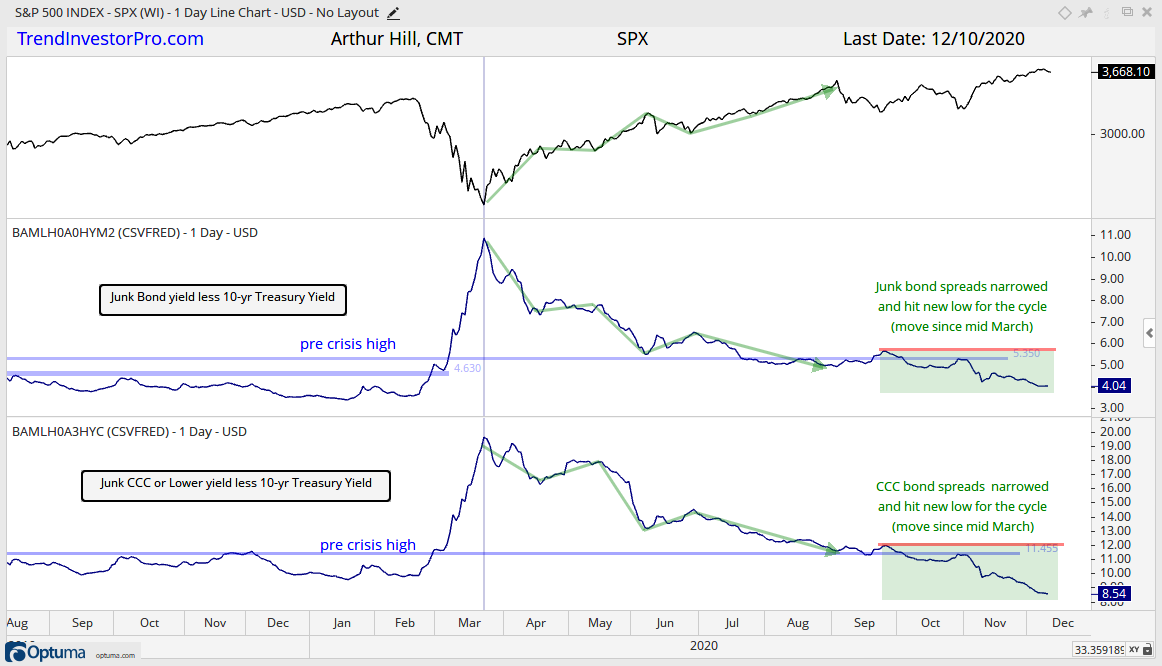
Junk bond spreads flattened over the last few weeks, while CCC spreads narrowed even further and dipped to their lowest level since May 2019. The narrowing of CCC spreads continues to be fueled by rising oil prices and energy related stocks. West Texas Intermediate is nearing $47, but this is still around $10 shy of its 2019 average. Oil is up 32% since November and CCC spreads narrowed from 11.5 to 8.54 during this time.
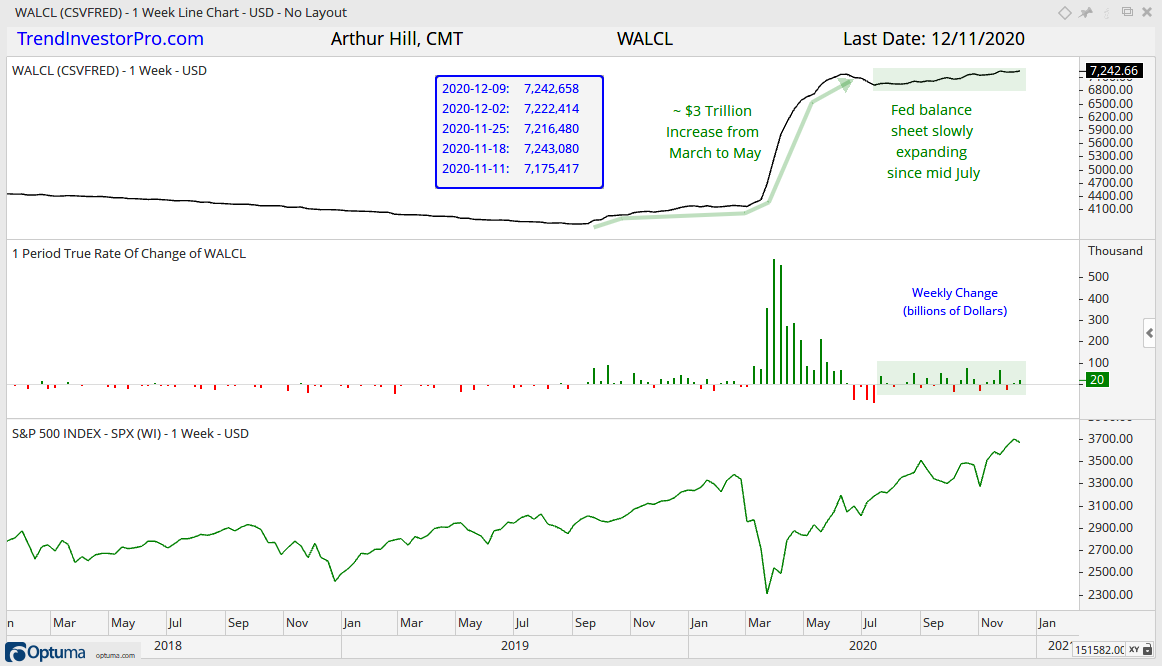
The Fed balance sheet expanded by a whopping $20 billion dollars, which is one of the smaller increases over the last few months. Nevertheless, the balance sheet continues to slowly expand since mid July and remains well above the $7 trillion mark.
")