The broad market environment remains bullish, but the short-term picture is turning mixed as fewer stocks follow the major indexes higher. The S&P 500 SPDR, Nasdaq 100 ETF and Russell 2000 ETF moved to new highs this week and are positive the last 16 trading days, but the S&P 500 Equal-weight ETF did not hit a new high this week is down around 1% the last 16 days. The equal-weight S&P 500 represents performance for the “average” stock in the S&P 500. I am also seeing some underlying weakness in short-term breadth for the S&P 500 and the technology sector.
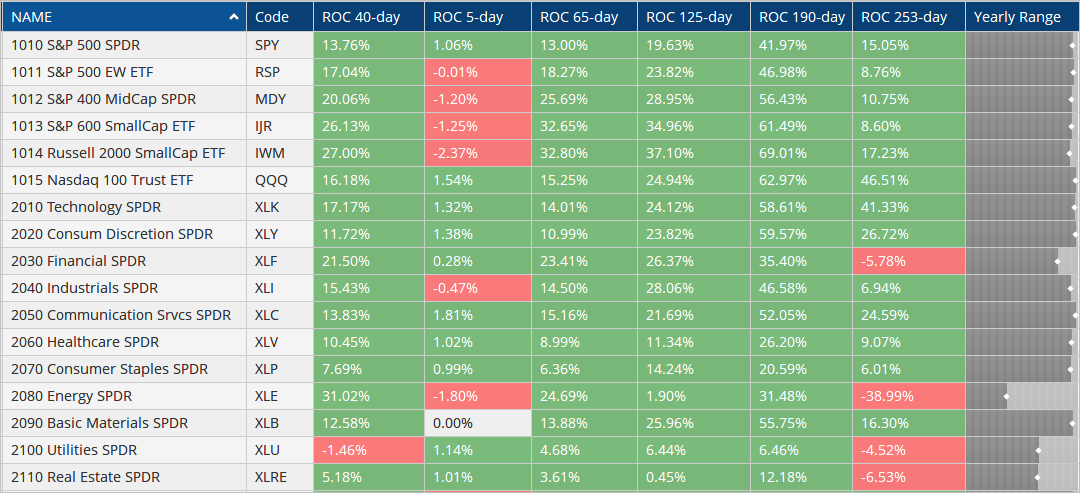
Keep in mind that stocks are up sharply since early November – 40 trading days (SPY +14%, MDY +20%, QQQ +16%, IWM +27%, XLF +21.5%, SKYY +25%, XRT +29%). Big gains are bullish long-term and show strong upside momentum, but they also create short-term overbought conditions and increase the odds for a correction in the coming weeks. The image below shows different Rate-of-Change metrics for the major index ETFs and sectors. Notice that RSP, MDY, IJR and IWM are down the last 5 days (ROC 5-day). XLU is the only sector with a loss over the last 40 days (-1.46%).
Holiday Schedule
Just a heads up on the holiday scheduling. The stock exchanges will be closed on Friday, January 1st. I am publishing the two reports today (December 30th) and the normal commentary schedule will resume next week.
Looking for more analysis? There is a lot of content with a longer shelf life available on the Premium page (here). This includes:
A six part series on trading with the StochClose indicator
My view on dividend adjustments
RSI for Trend-Following and Momentum
Testing the All Weather Portfolio
Exit Strategies: Chandelier, Parabolic SAR and ATR Trailing Stop
Triangle Breakouts Hold in SPY and QQQ
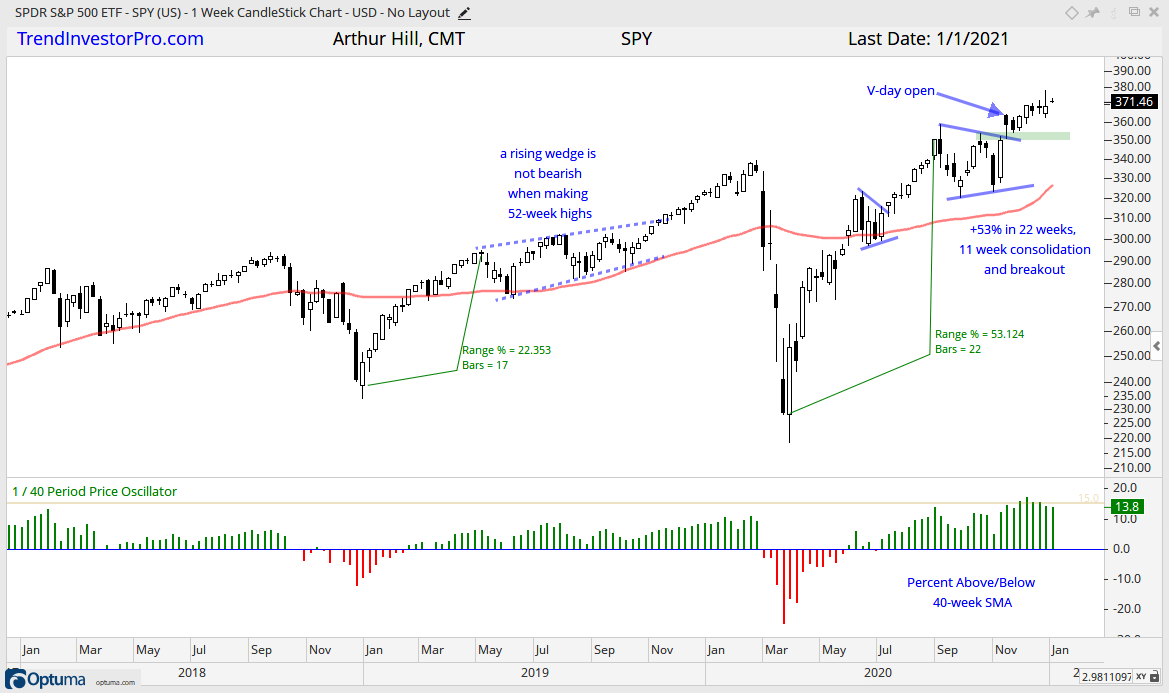
The S&P 500 SPDR remains in a long-term uptrend, but the going has gotten a little tougher since the open on November 9th, which was the Monday after the vaccine announcement (V-day). SPY surged some 53% in 22 weeks, consolidated for 11 weeks with a triangle and broke out on November 9th. The triangle represents a consolidation within an uptrend and the breakout signals a continuation higher.
SPY is currently around 2% above the open on November 9th, seven weeks ago. This may seem like a paltry return, but a 2% return in seven weeks is great on an annualized basis. At this point, the breakout is bullish until proven otherwise. The breakout zone around 350-355 turns into the first support zone to watch for a bounce should we get a pullback.
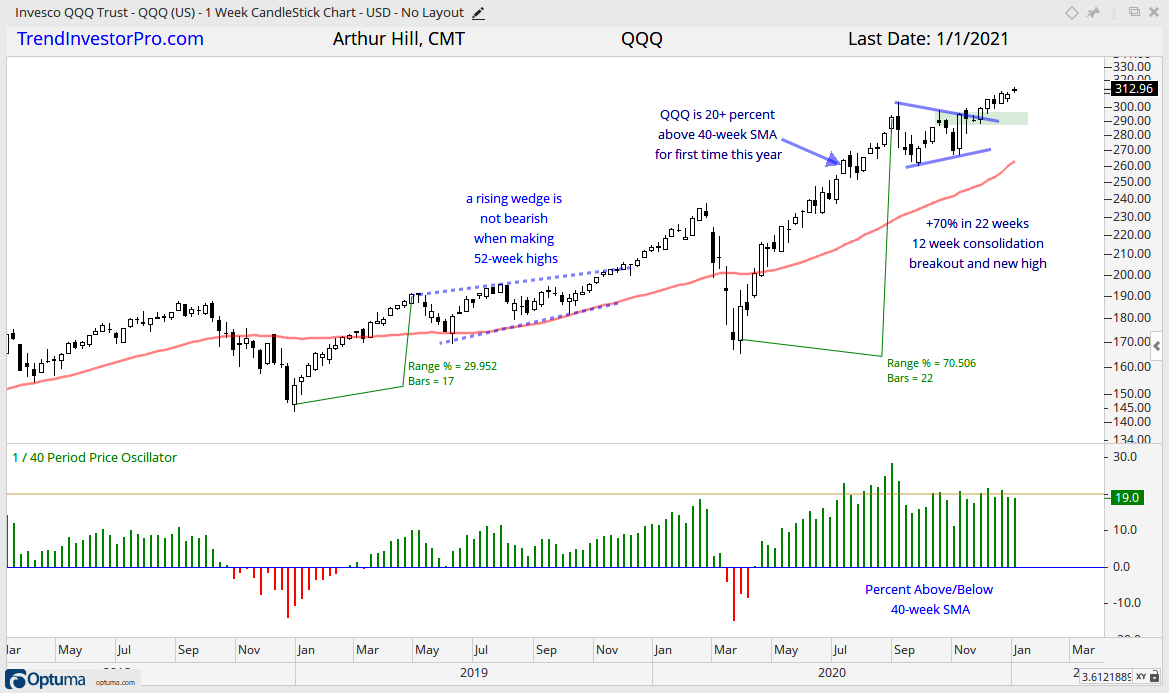
The next chart shows QQQ with similar characteristics: 70% surge, 12 week consolidation and breakout. The breakout is holding and QQQ hit a new high this week. The breakout zone in the 290 area turns first support to watch should we see a pullback.
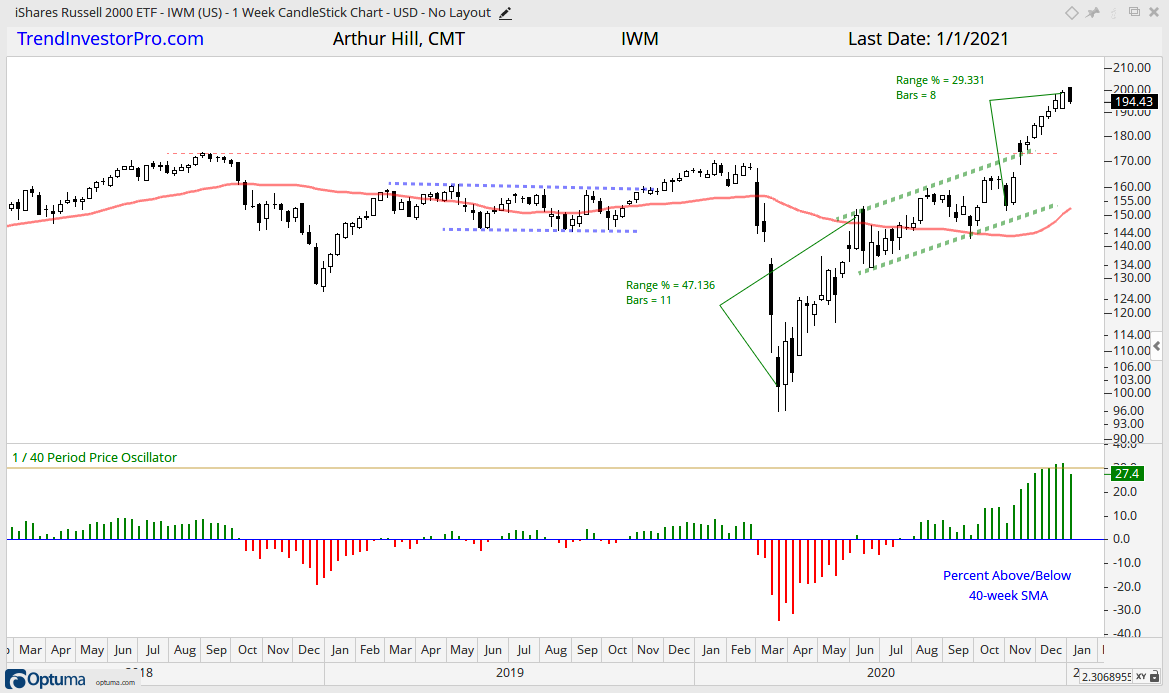
IWM Remains Very Extended
The next chart shows IWM with different characteristics. IWM led the surge off the March low (April-May), lagged when the advance slowed (June-October) and regained the lead the last two months (November-December). The surge over the last eight to nine weeks is extraordinary and IWM was over 30% above its 40-week SMA, which was a record. The ETF remains in an uptrend, but looks ripe for a corrective period.
Breadth Models Remain Bullish
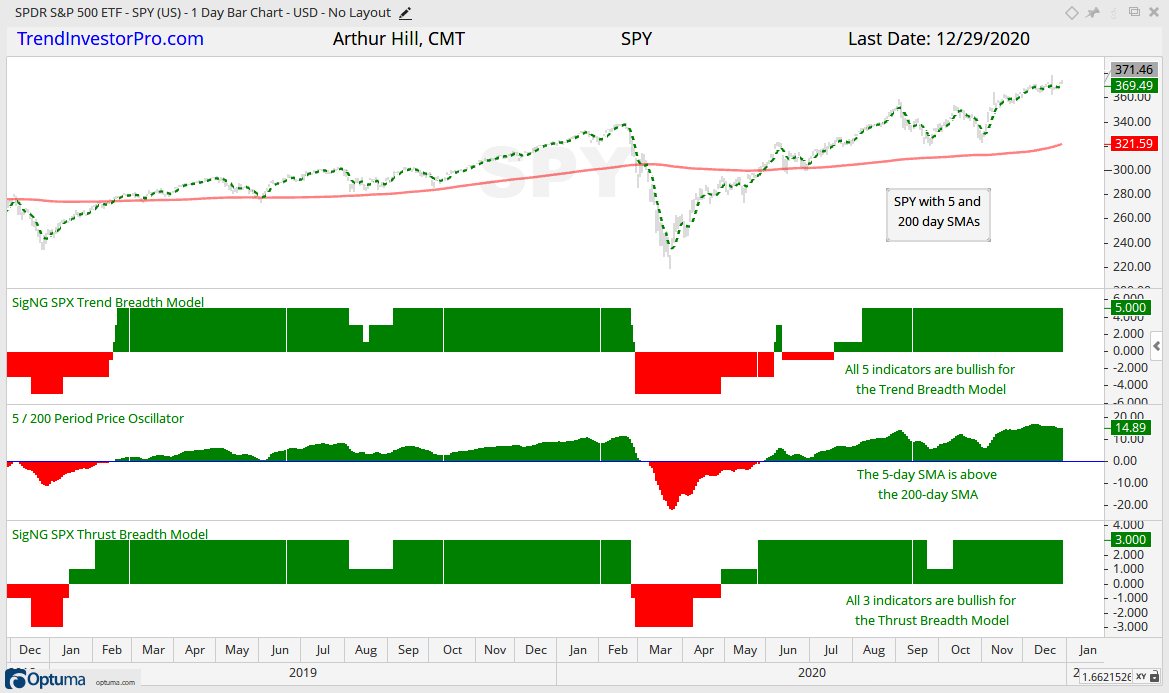
There are no changes in the breadth models. The Trend Breadth Models and Thrust Breadth Models are bullish for all five indexes ($SPX, $NDX, $OEX, $SML, $MID). The image below shows the signals for the S&P 500 over the last two years. All systems are go and the 5-day SMA for SPY is above the 200-day SMA. Corrections are still possible when the models are bullish.
Two Indicators to Watch for a Correction
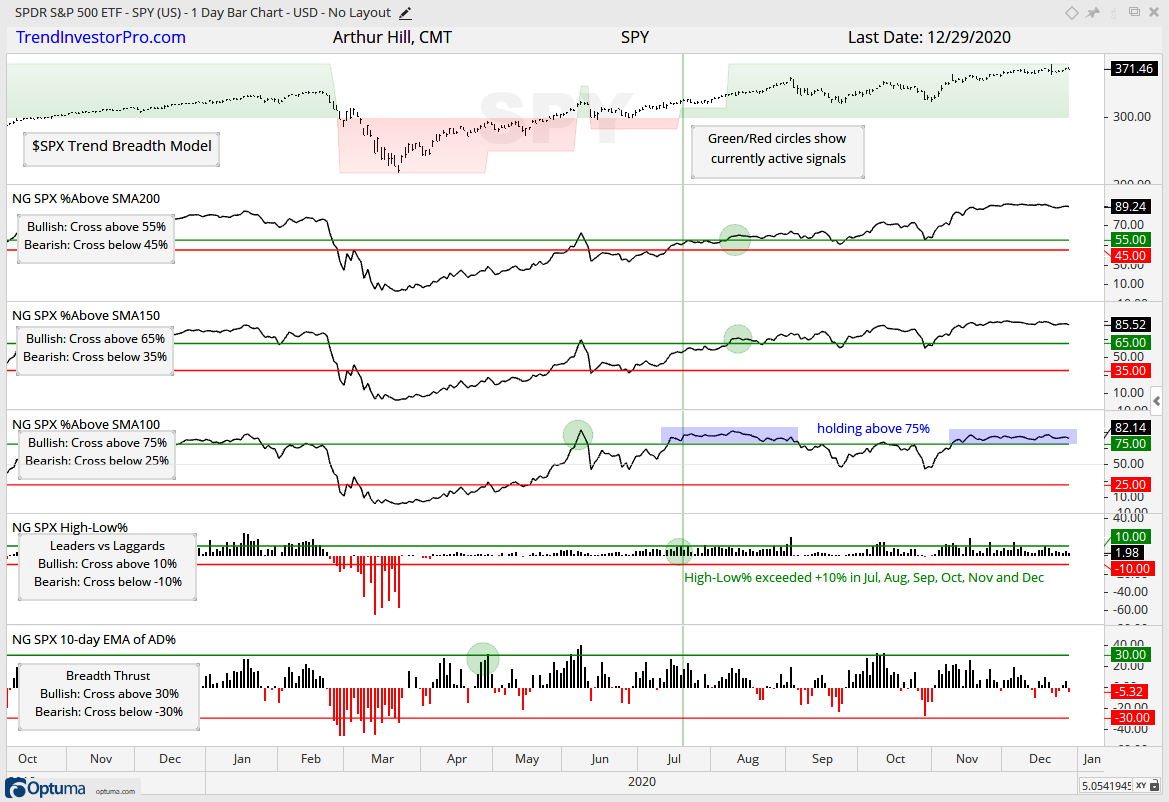
There are still a lot of uptrends out there with more than 80% of stocks in each index above their 100, 150 and 200 day SMAs. The chart below shows the Trend Model indicators for the S&P 500. %Above 200-day = 89.24%, %Above 150-day = 85.5% and %Above 100-day = 82.14%. The blue shading iu the middle window on the chart below shows SPX %Above 100-day holding above 75% since November 9th. A move below this level could signal the start of a corrective period (similar to early September).
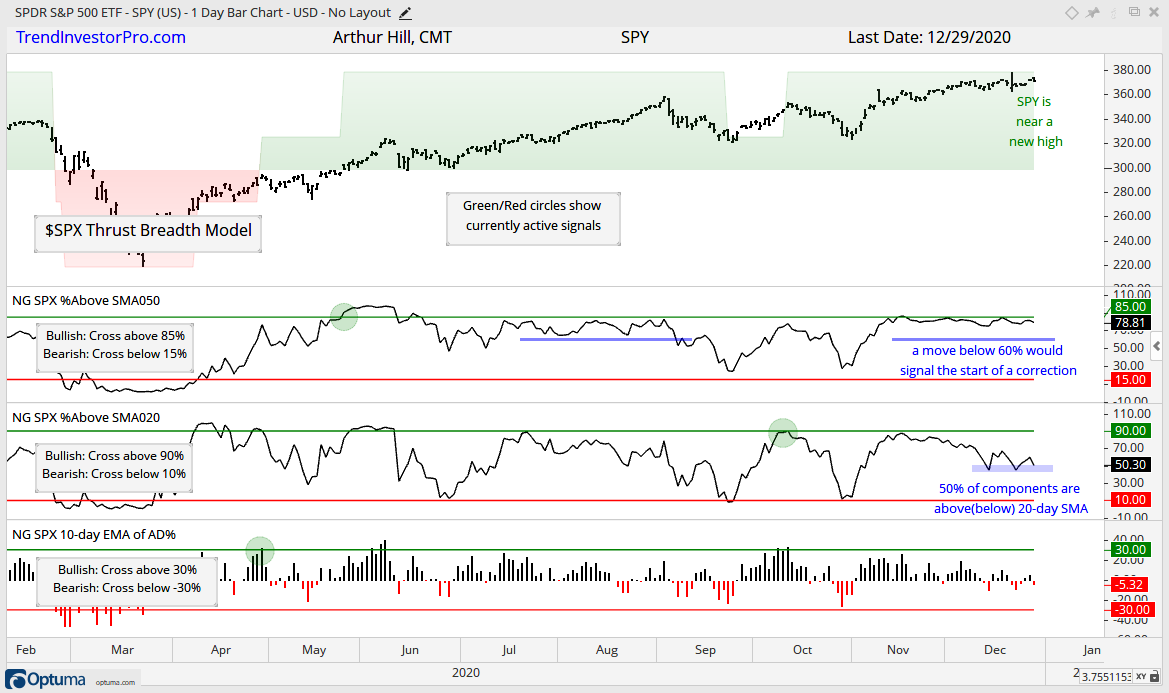
The next chart shows the Thrust Model indicators for the S&P 500. SPX %Above 20-day SMA hit 50% in mid December and finished at 50% on Tuesday. This means 50% of the components are below their 20-day SMA, even though SPY is near a 52-week high. This means there is less strength under the surface and fewer stocks are participating in this latest push higher. The %Above 50-day SMA is at 78.81% and continues to hover at high levels. A move below 60% could signal the start of a corrective period.
You can learn more about the methodology and historical performance for these breadth models in this article.
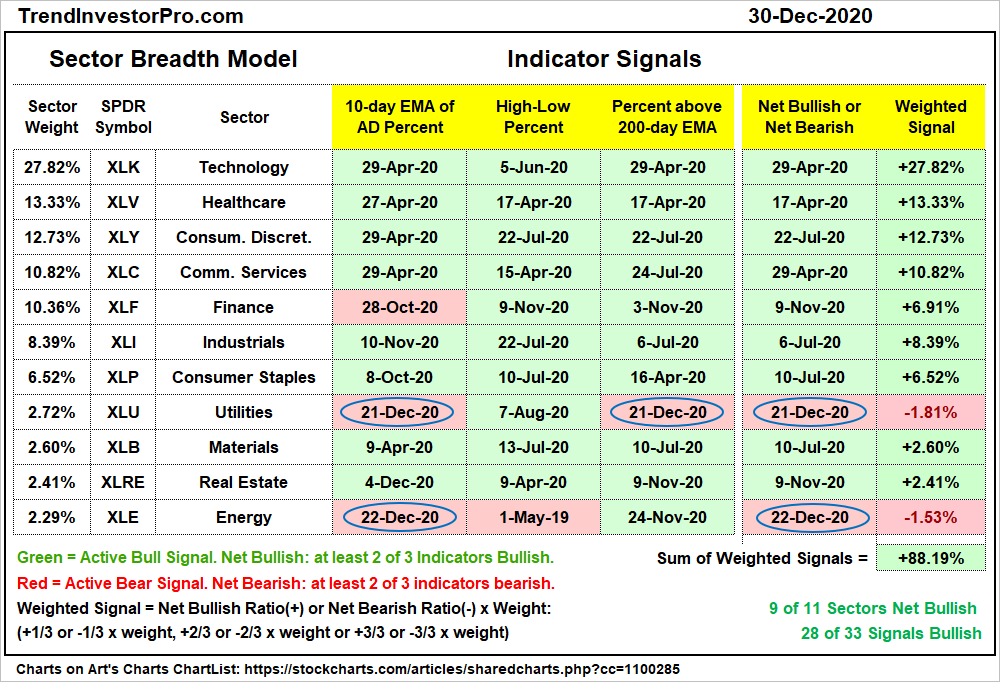
Two Sectors Turn Net Bearish
There are two changes in the Sector Breadth Model as Energy and Utilities turned net bearish. These two sectors were not really leaders because they did not record a 52-week high in the second half of the year. Seven of the eleven sectors recorded new highs in the fourth quarter of 2020. XLRE, XLF, XLE and XLU were the ones that did not. Note that Energy and Utilities are small sectors and have relatively little influence on the S&P 500.
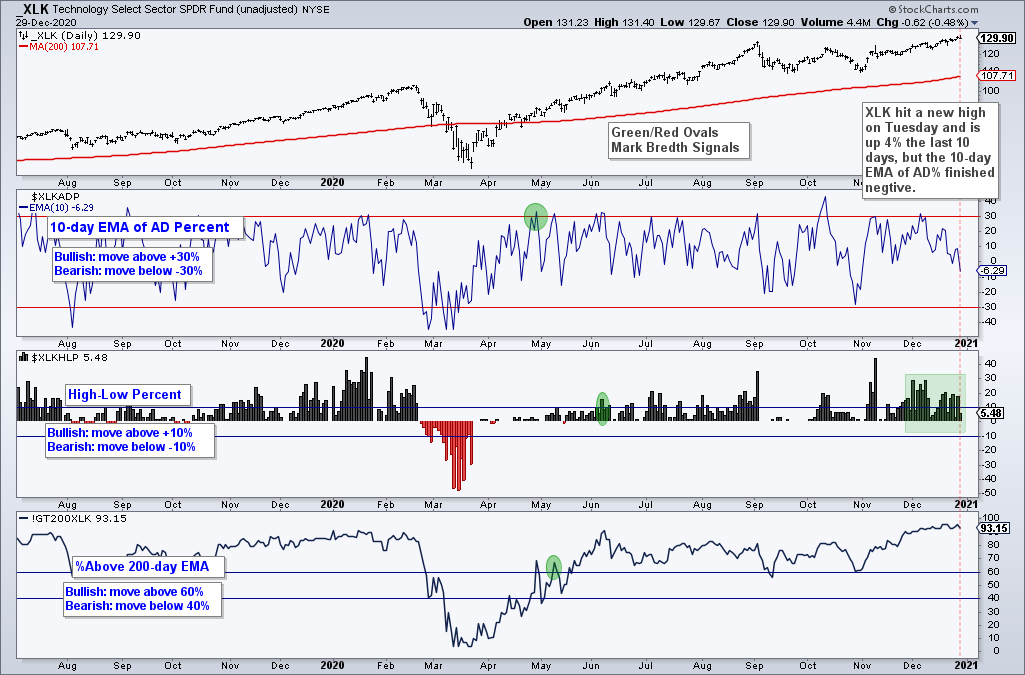
Even though XLK hit a new high (intraday) on Tuesday and is up 4% the last ten days, the 10-day EMA of Advance-Decline Percent finished negative. This EMA is a running total of AD% over the last ten days and should be somewhat positive after a 4% advance to new highs. The negative reading reflects weak participation on the latest move higher. This is not an outright bearish signal, but it shows underlying weakness that could give way to a corrective period.
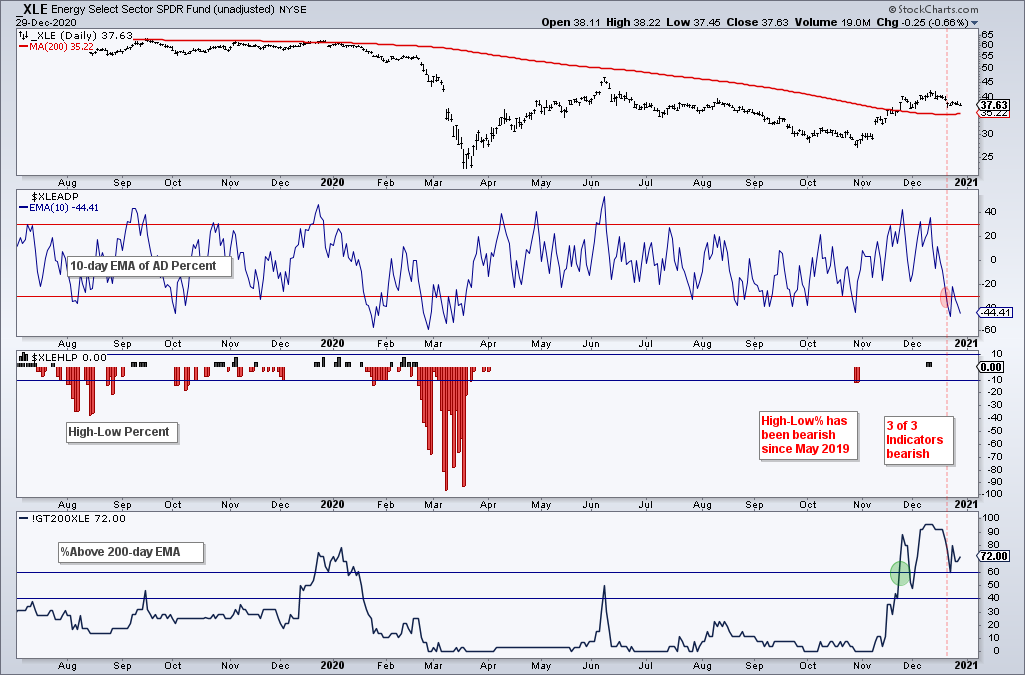
The Energy SPDR (XLE) turned net bearish as the 10-day EMA of Advance-Decline Percent plunged below -30%. This shows just how strongly correlated stocks are in the energy sector. They pretty much all move in the same direction. The bearish breadth thrust shows broad downside participation that does not usually occur when the sector is in bull mode. Note that High-Low Percent has been bearish since May 2019. I am staying away from energy.
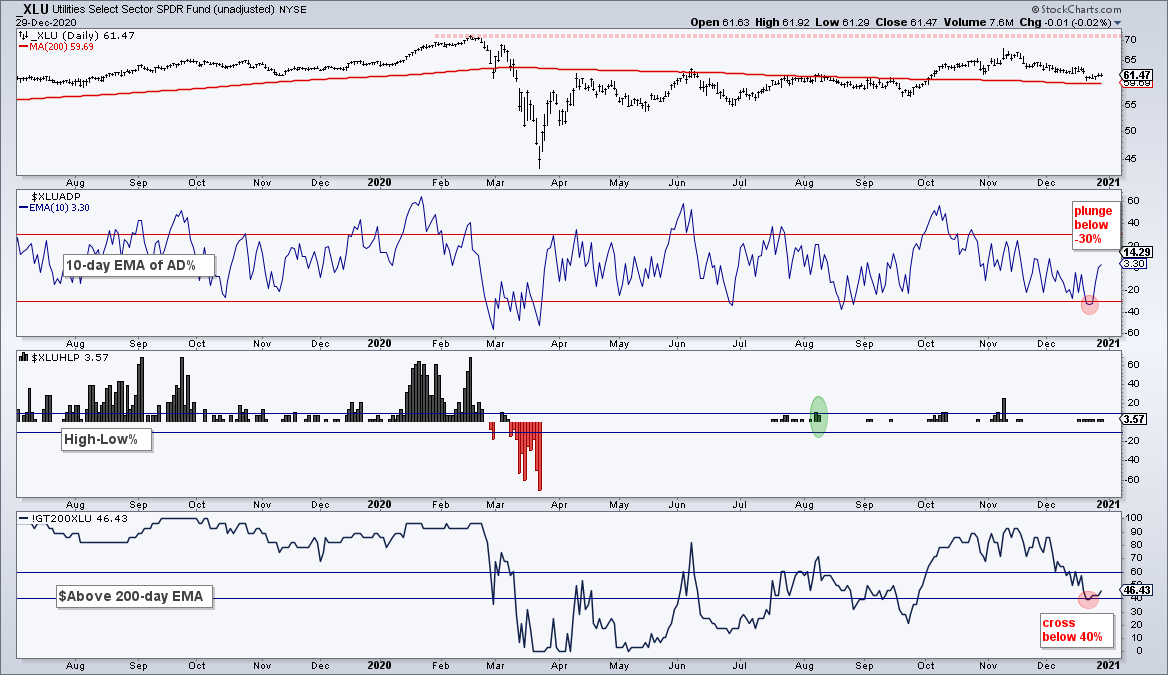
The Utilities SPDR (XLU) also triggered net bearish as the 10-day EMA of Advance-Decline Percent plunged below -30% and %Above 200-day EMA crossed below 40% on December 21st. Despite turning net bullish in October, XLU was never really a leader because it never challenged the February high.
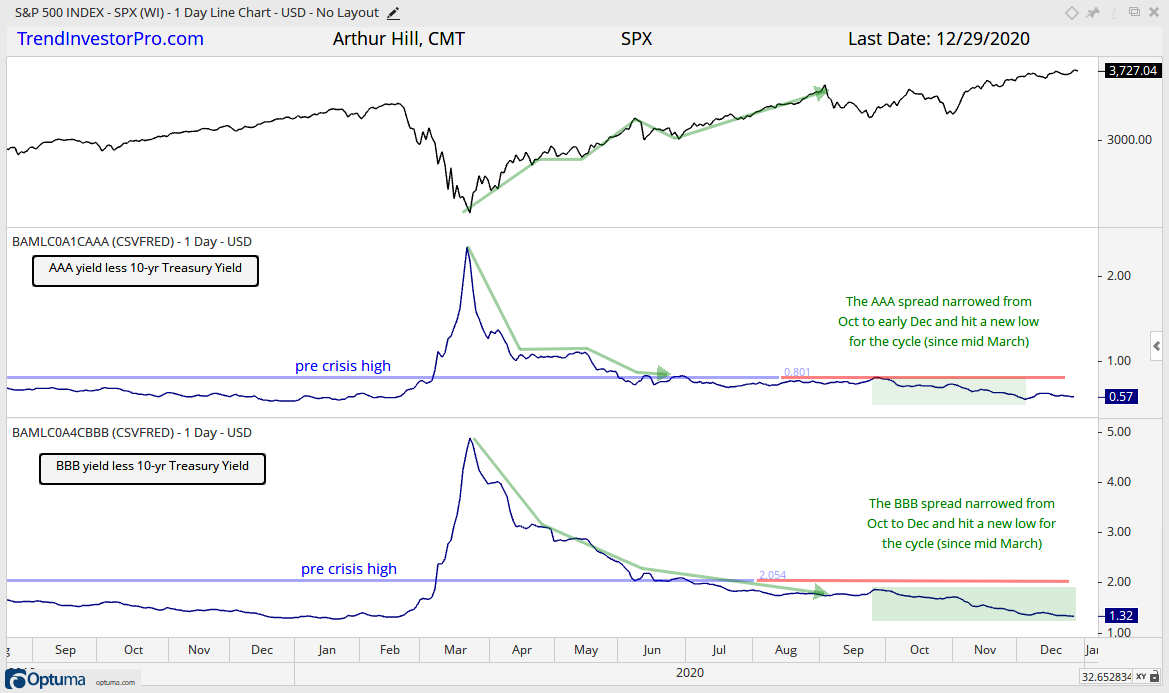
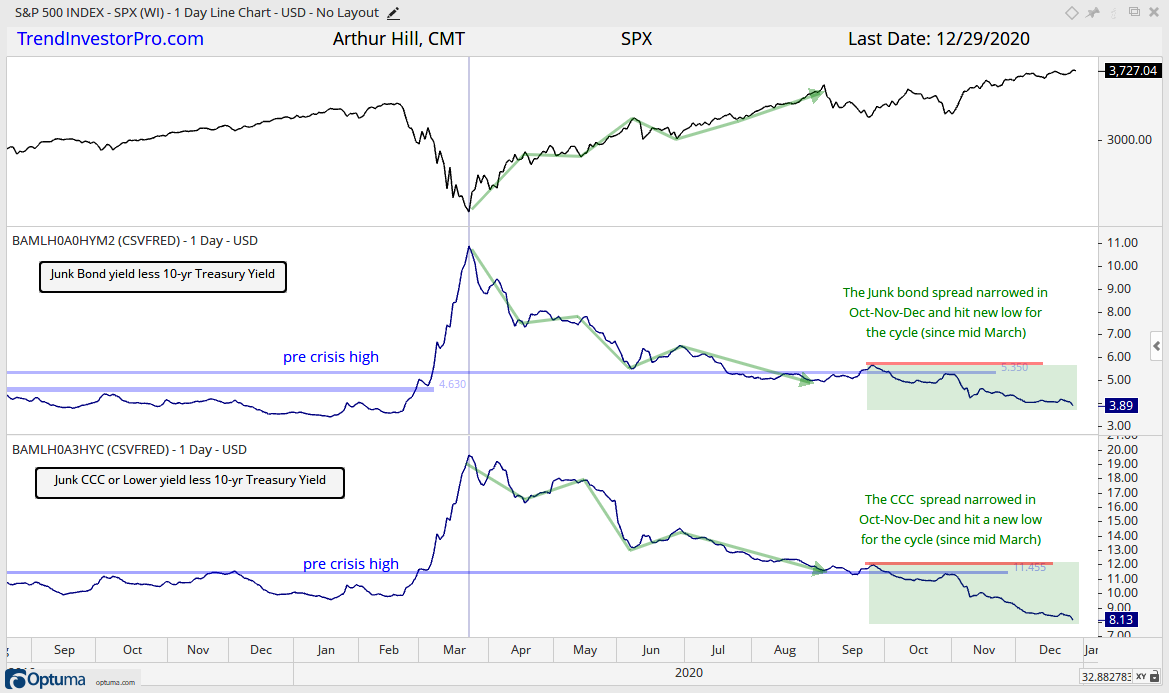
Yield Spreads and Fed Balance Sheet
The yield spreads continue to narrow and the Fed’s balance sheet expanded just before Christmas. The BBB yield spreads, which represent the lowest ranked investment grade bonds, narrowed further in December and hit a new low for the cycle, which is the move that began in mid March. BBB spreads are back near the lows seen in December 2019 and there are no signs of stress in the credit market.
The Junk and CCC spreads narrowed as well over the past week and also hit new lows for the cycle. Junk bond spreads are back near the 2019 lows and CCC spreads are at their lowest level since November 2018. This suggests that bond investors are less concerned about defaults in junk bonds.
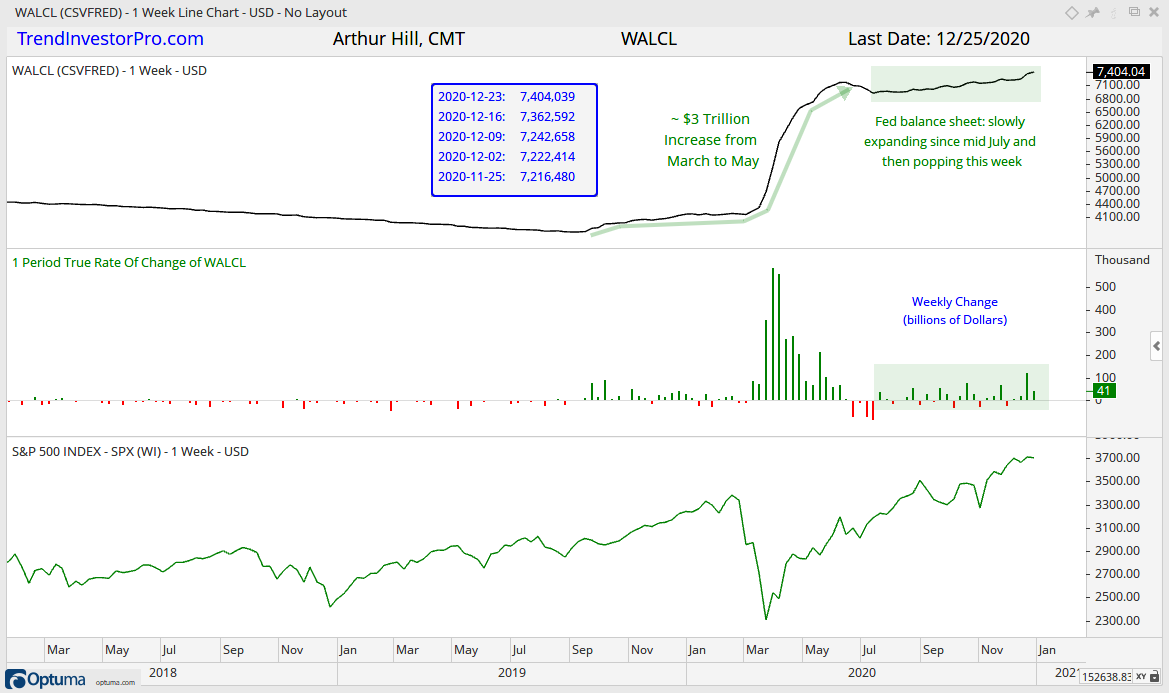
The Fed balance sheet expanded by $41 billion and hit a new high. Overall assets are now above $7.4 trillion as the Fed continues to provide liquidity. Reuters notes that the Fed is expected to continue purchasing $25 to $30 billion per week of Treasuries and Mortgage-Backed Securities in 2021. This is to “cushion the impact of new fiscal stimulus and anticipated Treasury issuance”. This just adds to the craziness of MMT (Modern Monetary Theory). This is like Instagram issuing debt and WhatsApp buying the debt, both of which are owned by Facebook. Remember, the market can remain irrational a lot longer than we can remain solvent!
")