There are some signs of excess, but the weight of the evidence remains bullish. Today’s video will shows some excesses and some performance discrepancies since November 9th. Despite these concerns, the breadth models and indicators are bullish. In fact, participation is strong overall and SPY is holding its breakout. Stock alternatives, like TLT and GLD, remain in downtrends, as is the Dollar. We are seeing medium-term breakouts in two tech related ETFs and breakout continuations in others. There are also a few short-term bullish patterns to watch in the coming days, as well as a narrowing consolidation.
Note: The ETF ChartBook contains the notes below and a table of contents.
ETF ChartNotes
Saturday, 12 December 2020
The table below shows the bullish (TRUE) and bearish (FALSE) StochClose signals over the last 15 trading days. These are recent trend signals.

The table below shows ETFs with bullish StochClose signals (TRUE) and oversold RSI values (OBOS = TRUE). These ETFs are in uptrends and short-term oversold

The only quasi bearish arguments out there are testament to the underlying strength over the last six weeks. Quasi bearish arguments are really just concerns, they are not actually bearish signals. Over 90% of S&P 500 stocks are above their 200-day SMA. This shows strong participation and also extreme upside participation (excess?). SPY is over 15% above its 200-day and IWM is over 30% above its 200-day SMA. This reflects an overextended condition brought on by a strong advance.
SPY broke out of a medium-term triangle on V-day, vaccine day on November 9th, and recorded new highs the last few weeks. The ETF continues to work its way higher with a tight rising channel.
IWM continues to work its way higher since the island reversal on November 3rd. The ETF is up a market leading 24% since early November and holding the ATR Trailing Stop, which is currently at 183.93. IWM is over 30% above its rising 200-day, the most ever (since 1991).
QQQ broke out of a medium-term triangle in November and hit a new high early this week. The breakout is long-term bullish. Short-term, QQQ is right near the ATR Trailing Stop.
The Healthcare SPDR (XLV), Medical Devices ETF (IHI) and Healthcare Providers ETF (IHF) broke out of short-term bullish continuation patterns last week and pulled back a little the last few weeks. The breakouts are still holding and still bullish. The Consumer Staples SPDR (XLP) also has a pennant breakout working.
The Software ETF (IGV) and Internet ETF (FDN) still have medium-term Ascending Triangle patterns working, which are bullish continuation patterns. Both closed strong on Thursday-Friday and their breakouts are still in play.
The Home Construction ETF (ITB) is putting me to sleep with its narrowing consolidation and tight trading range. This triangle is still a consolidation within an uptrend and typically a bullish continuation pattern. RSI continues to flirt with its oversold zone. Watch for a StochClose pop above .80 or a pattern break.
The Residential REIT ETF (REZ) is stronger than the Real Estate SPDR (XLRE) because it broke out of its five month trading range and exceeded its June high. The ETF formed a pennant after the breakout and then fell back to test support. The moment of truth is nigh!
The Biotech ETF (IBB) is holding its breakout zone.
The DB Agriculture ETF (DBA) broke out of a pennant (small falling wedge).
The Corporate Bond ETF (LQD) is breaking out of a small falling flag. Prior, it broke out of a larger falling wedge in early November.
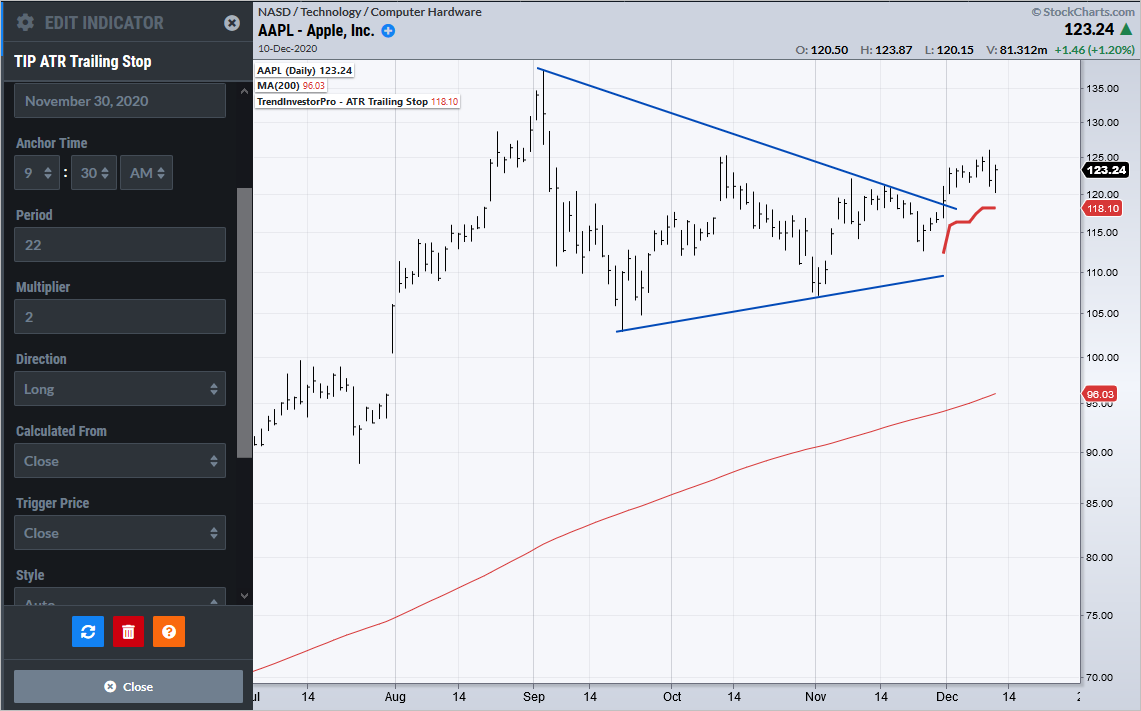
ATR Trailing Stop on StockCharts ACP
The ATR Trailing Stop and ATR Trailing Stop (SAR) are now available on the TIP Indicator Edge Plugin for StockCharts ACP. The “SAR” is for “stop and reverse” and works like the Parabolic SAR. This means the ATR Trailing Stop flips when triggered. I will put out an article and video covering this version next week.


