Stocks Pullback, Yields Surge, Housing Hit, QQQ Leads, A Setup in Defense, Two Bullish Cloud Stocks

The next report will be posted on Thursday morning, December 12th.

Report Headlines

  • Market Remains in PullBack Mode
  • 10-yr Treasury Yield Surges
  • SPY Holds Near High as QQQ Surges
  • S&P SmallCap 600 SPDR Pulls Back
  • A Miserable Failure for ITB
  • Gold Forms Potentially Bearish Wedge
  • ITA Becomes Oversold within Strong Uptrend
  • Network Appliance Goes for Triangle Breakout
  • Workday Resumes Leadership Role with Breakout

I will post a video on Wednesday morning (before 8AM ET)

Market Remains in PullBack Mode

Stocks remain in pullback mode with short-term breadth showing more declining stocks than advancing stocks over the last three weeks. The chart below shows Advance-Decline Percent for the S&P 500, Nasdaq 100, S&P MidCap 400 and S&P SmallCap 600. AD% measures daily up/down participation within each index. SPX AD% has been negative 11 days in a row, which means there were more declining stocks each of the last 11 days. NDX AD% is mixed, while MID AD% and SML AD% show deeper dips on the negative side. Overall, this means the broader market is in pullback mode as most stocks declined over the last 2-3 weeks.

The next chart shows the percentage of stocks above their 200-day SMAs for each index. SPX %Above 200-day fell from 77% in late November to 63.6% in mid December, while NDX %Above 200-day fell from 70% to 60%. This means fewer stocks are holding above their 200-day SMAs. While short-term negative, I do not see enough deterioration to turn long-term bearish on this indicator. The trouble starts when they break 50% and a bearish signal triggers when they break 40%.

The lower window shows MID %Above 200-day and SML %Above 200-day SMA holding up rather well the last few weeks. They are both below their late November highs, but above 65%. This means small-caps and mid-caps are holding up better during this market pullback. This is not evident on the charts because QQQ hit a new high, SPY is near a new high and the S&P SmallCap 600 SPDR (IJR) is 4% below its late November high.  

10-yr Treasury Yield Surges

The next chart shows the 10-yr Treasury Yield ($TNX) in the top window and the 7-10 Yr Treasury Bond ETF (IEF) in the lower window. $TNX fell in the second half of November and appeared to be reversing within a large falling channel. The bond vigilantes had other ideas as TNX sharply reversed last week with a falling flag breakout. This breakout move was quite strong and follow through would push yields out of the long-term falling channel. I would then target a move to 5% (50 on the chart). Such a move could provide a headwind for stocks, especially small-caps, housing and banks.

SPY Holds Near High as QQQ Surges

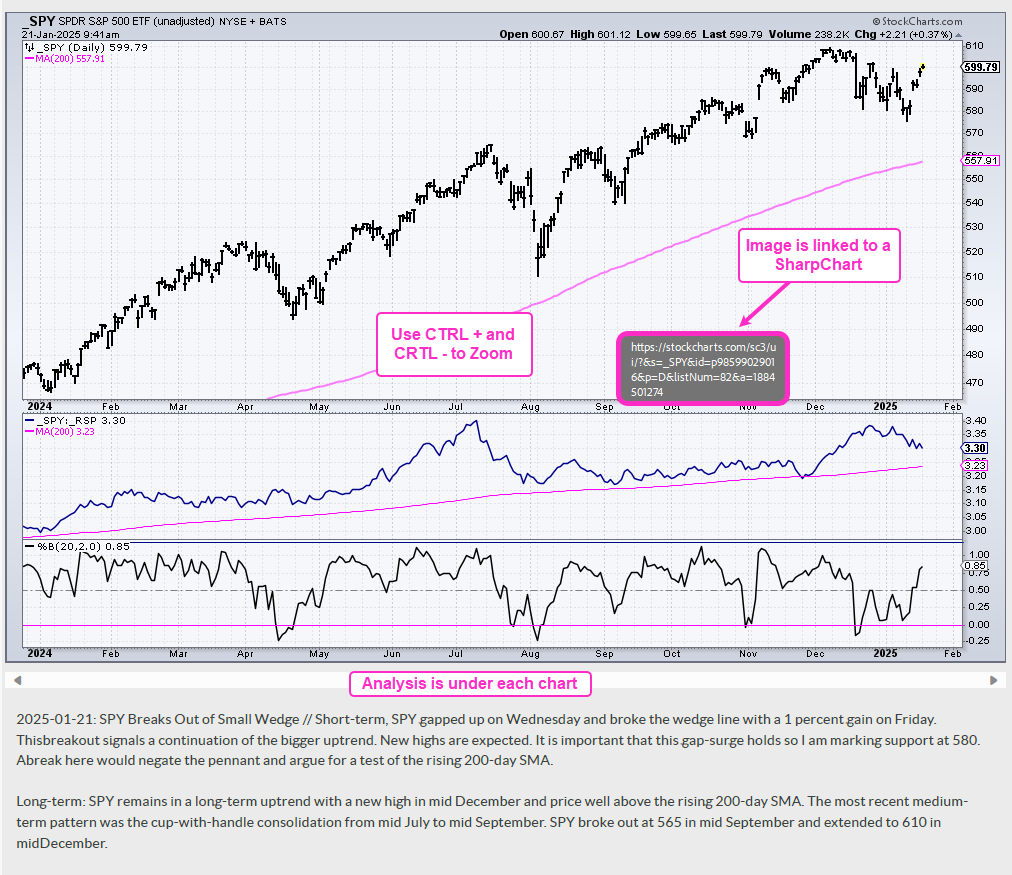
There is no change on the SPY chart. The long-term trend is up and SPY is trading near a new high. The ETF hit a new high on December 6th and then stalled with a small pennant. I am not drawing this pattern because it is too small for my trading style. Overall, I do not see setup for SPY. The stock is simply in an ongoing uptrend and leading the S&P 500 EW ETF (RSP). The middle windows shows the SPY/RSP ratio moving sharply higher the last three weeks.

There is no change in the QQQ chart as the ETF surges to another new high. The July-August triangle was the most recent pattern at work and the ETF is extending on this breakout.

S&P SmallCap 600 SPDR Pulls Back

The S&P SmallCap 600 SPDR (IJR), S&P 500 EW ETF (RSP) and Russell 2000 ETF (IWM) have the same pattern at work over the last few weeks: a pullback after the surge and new high in November. The chart below shows IJR with a surge in late November and a falling wedge the last three weeks. I view this as a pullback within a long-term uptrend and a breakout at 125 would be bullish. The middle window shows IJR relative to SPY. IJR started to lead with the July surge, but the price-relative is largely flat since this surge. It is a tall order to outperform a MAG7 led SPY.

A Miserable Failure for ITB

There is some concern with the Home Construction ETF (ITB) because housing remains an important part of the economy. ITB broke out with a momentum thrust in late November and the ITB/RSP ratio also moved back above its 200-day SMA (green arrow). This breakout was similar to the mid July surge and breakout. Note that small-caps also surged in mid July. ITB failed to hold the late November breakout as it fell below the October low and 200-day SMA. The price-relative (ITB/RSP ratio) also sank. Housing is not looking good and this is a possible negative for small-caps.

Hard Time for Hard Assets

Before looking at gold, note that hard assets are having a hard time. The DB Base Metals ETF (DBB) and Copper ETF (CPER) are weak, the Silver ETF (SLV) failed to hold its breakout, the Steel ETF (SLX) got clobbered the last few weeks and the Materials SPDR (XLB) plunged below its 200-day SMA. The CandleGlance chart below shows these ETFs with the 31-day Rate-of-Change to measure performance since November. All are down. I realize that gold marches to the beat of its own drummer, but the backdrop for hard assets does not look good. Also note that there are a slew of economic reports on deck this week and the Fed makes its policy statement on Wednesday. These macro events could move the Dollar, stocks, bonds and gold.

Gold Forms Potentially Bearish Wedge

The chart below shows the Gold SPDR (GLD) in a long-term uptrend with a new high in late October. GLD corrected with a falling flag into November, reversed near the 50% retracement and broke out with a surge above 245. This breakout is bullish and holding. My concern here is that a bearish wedge is taking shape. The December low marks support at 242 and a break here would argue for a continuation of the early November decline. This would target a move to the rising 200-day SMA (227-230).

ITA Becomes Oversold within Strong Uptrend

The next chart shows the Aerospace & Defense ETF (ITA) becoming oversold as %B dipped below 0 last week. This creates an oversold condition within a long-term uptrend. ITA hit a new high just after the election and then fell back with a falling wedge correction into December. I view this as a correction within the uptrend and a bullish continuation pattern. The middle window shows the ITA/RSP ratio hitting a new high in October and falling below its 200-day SMA in December. It turned up the last two days and is back above its 200-day SMA. This means relative strength could be returning.

Network Appliance Goes for Triangle Breakout

The next chart shows Network Appliance (NTAP), which is part of the Nasdaq 100 Next Gen ETF (QQQJ) and Technology SPDR (XLK). The company provides software, systems, and services to manage data infrastructure in the cloud. On the price chart, NTAP led the market into July with a strong run to new highs and then moved into a consolidation phase. A triangle formed over the last few months and I view this as a consolidation within an uptrend, which is a bullish continuation pattern. NTAP is attempting a breakout with two surges in late November. NTAP fell sharply last week and recovered to established support at 120. This is the first level to watch for a failure. The middle window shows the NTAP/RSP ratio starting to turn up, which means the stock may be poised to outperform again.

Workday Resumes Leadership Role with Breakout

The next chart shows Workday (WDAY), which is part of the Nasdaq 100 ETF (QQQ) and Cloud Computing ETF (CLOU). Workday provides cloud-based application software and services. WDAY led the market with a run to new highs in February, but then embarked on an extended decline back to the October-November lows. WDAY found support in the low 200s and broke out with a big move in August. A falling wedge correction unfolded into October and the stock broke out again in early November. After a throwback to the breakout zone in early December, the stock is on the move again with a breakout surge above 270. A lot can happen between 280 and 245, but I view this breakout as bullish with first support marked at 245. The middle window shows the WDAY/RSP ratio turning up in December and breaking above its prior highs.

Thanks for tuning in and have a great day!

Beginning in the Midst of a Bull Run and Dealing with Drawdowns

Not all pullbacks result in long-term trend changes and not all drawdowns lead to bear markets. The odds favor the bulls as long as the bull market signal is valid and drawdowns provide opportunities during bull markets. Today’s report will analyze the drawdowns in the Rotation Investor strategies. We will show the Maximum Drawdown, Median Drawdown and a drawdown range for putting money to work.

Beginning in the Midst of a Bull Run and Dealing with Drawdowns Read More »

Revisiting Overbought Filters for Rotation Strategies – Can we Improve Performance with a Tweak?

Momentum-Rotation strategies get their edge from upward momentum. More often than not, this means there will be entry signals for stocks that seem overbought. Not all overbought stocks continue higher and some correct hard after becoming overbought. Can we improve performance by avoiding stocks that are extremely overbought? Today’s report will discuss the recency bias, show some overbought examples and puts an overbought filter to the test.

Revisiting Overbought Filters for Rotation Strategies – Can we Improve Performance with a Tweak? Read More »

A Leader in Medical Devices, NVDA Stalls above Breakout, SMH Holds Support, CIBR and 3 Stocks

Today’s report covers a leading stock in the Medical Devices ETF (IHI), which is the strongest group with the Healthcare sector. We then analyze NVDA as it consolidates above the October breakout and shows the SMH chart. Attention then turns to the Cybersecurity group with three stocks forming short-term consolidations.

A Leader in Medical Devices, NVDA Stalls above Breakout, SMH Holds Support, CIBR and 3 Stocks Read More »

Video – Breadth, Yield Spreads, SPY, QQQ, IWM, XLV, XLP, CLOU, CIBR, SOXX, SMH, ITB, XHB, LIT, GLD, SLV and Eight Stocks

Today’s video starts with long-term breadth, yield spreads and the major index ETFs to define the broad market environment. We then focus on short-term weakness and the pullbacks in RSP, IWM and MDY. Some tech ETFs are very extended and a key group continues to lag. Housing ETFs are testing support, while gold and silver hold their breakouts. We finish with follow up for eight stocks.

Video – Breadth, Yield Spreads, SPY, QQQ, IWM, XLV, XLP, CLOU, CIBR, SOXX, SMH, ITB, XHB, LIT, GLD, SLV and Eight Stocks Read More »

Breadth and RSP Signal Pullback, Two Housing ETFs Set Up, Extended Tech ETFs, Two Stock Setups

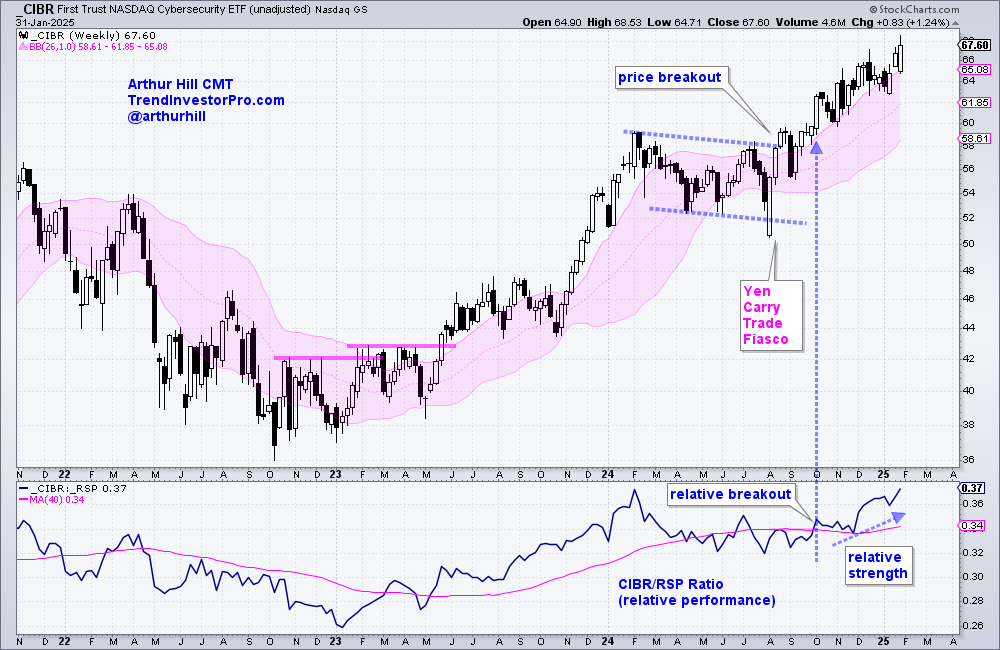
Today’s report starts with the Advance-Decline Percent indicators to measure participation over the last two weeks. We then turn to the S&P 500 EW ETF to define the current pullback, as well as two housing-related ETFs. Some tech stocks are looking extended and we offer detailed analysis of the Cybersecurity ETF (CIBR). We close with bullish setups in an animal healthcare stock and a business software stock.

Breadth and RSP Signal Pullback, Two Housing ETFs Set Up, Extended Tech ETFs, Two Stock Setups Read More »

SPX/NDX Breadth, Yield Spreads, SPY/QQQ Trends, MAG7 Leads and Small-caps Try to Lead

Today’s report will cover the broad market environment. We start with the long-term breadth indicators for the S&P 500 and Nasdaq 100 (%Above 200-day, %Above 150-day, High-Low Percent). Attention then turns to the BBB yield spread and long-term chart analysis for SPY and QQQ. QQQ found its mojo as the MAG7 ETF leads. Mid-caps are lagging, micro-caps are leading the small-caps are mixed.

SPX/NDX Breadth, Yield Spreads, SPY/QQQ Trends, MAG7 Leads and Small-caps Try to Lead Read More »

5 Stocks: Tight Bullish Wedges, A Bullish Setup Zone, A Breakout Leader and One Near a Prior Breakout Level – Plus XLV and XBI (Premium)

Today’s report starts with a defense stock and a fintech stock forming tight wedges. After reviewing the rebounds in the Healthcare and Biotech ETFs, we then focus on two biopharma stocks: one testing a Bullish Setup Zone and the other with a leading breakout. And finally, we feature an under-the-radar tech stock trading near its breakout point from late October.

5 Stocks: Tight Bullish Wedges, A Bullish Setup Zone, A Breakout Leader and One Near a Prior Breakout Level – Plus XLV and XBI (Premium) Read More »

Plunge in 10yr Yield Triggers Home Builders – Analyzing ITB and Five Stocks (Premium)

Today’s report analyzes the move in the 10-yr Treasury Yield, the surge in ITB and five home builder stocks. Home Builders were lagging the last few months, but the declines look like normal corrections. The retracements were normal and some surged off bullish setup zones. In addition, we are seeing a momentum thrust in %B.

Plunge in 10yr Yield Triggers Home Builders – Analyzing ITB and Five Stocks (Premium) Read More »

Drop in Yields Triggers Gap-Surge in Home Builders (Free)

The 10-yr Treasury Yield plunged as Treasury bonds surged on the heels of a new nomination for Treasury secretary. These moves lifted small-caps, banks and homebuilders. Banks have been leading for some time and small-caps started their move last week. Homebuilders held out for interest rates and got their catalyst on Monday. Today’s report will analyze

Drop in Yields Triggers Gap-Surge in Home Builders (Free) Read More »

Four Prerequisites to Improve Your Odds – A Live Example (Free)

Even though trading based on chart analysis involves some discretionary decisions, chartists can improve the odds of success by systematizing their process. This report will show four prerequisite filters based on a top-down approach. We will start with the broader market, look at the sector, and then apply two qualifying filters to the stock. First, I would make sure

Four Prerequisites to Improve Your Odds – A Live Example (Free) Read More »

Chart Trader – Biotech Oversold, MLPs Surge, Lithium Consolidates, Uranium Breaks Out, Two Leading Stocks and Two with Pullbacks (Premium)

Today’s report starts with some of the leading ETFs in strong uptrends – but without setups. These include software (IGV), fintech (FINX) and finance (XLF). Attention then turns to some oversold setups in Healthcare and Biotech, and the group’s leader (Medical Devices). MLPs are breaking out within the Energy sector and we are seeing two commodity ETFs strengthen (Uranium and Lithium). Turning to stocks, we have two breakout leaders (TJX, VRSK) and two former leaders with pullbacks (AVGO, UHS).

Chart Trader – Biotech Oversold, MLPs Surge, Lithium Consolidates, Uranium Breaks Out, Two Leading Stocks and Two with Pullbacks (Premium) Read More »

Chart Trader – QQQ Pulls Back, Using %B, Smalls Return to Breakout, Banks Lead, Cybersecurity Tests 50-day, Robotics hold Breakout (Premium)

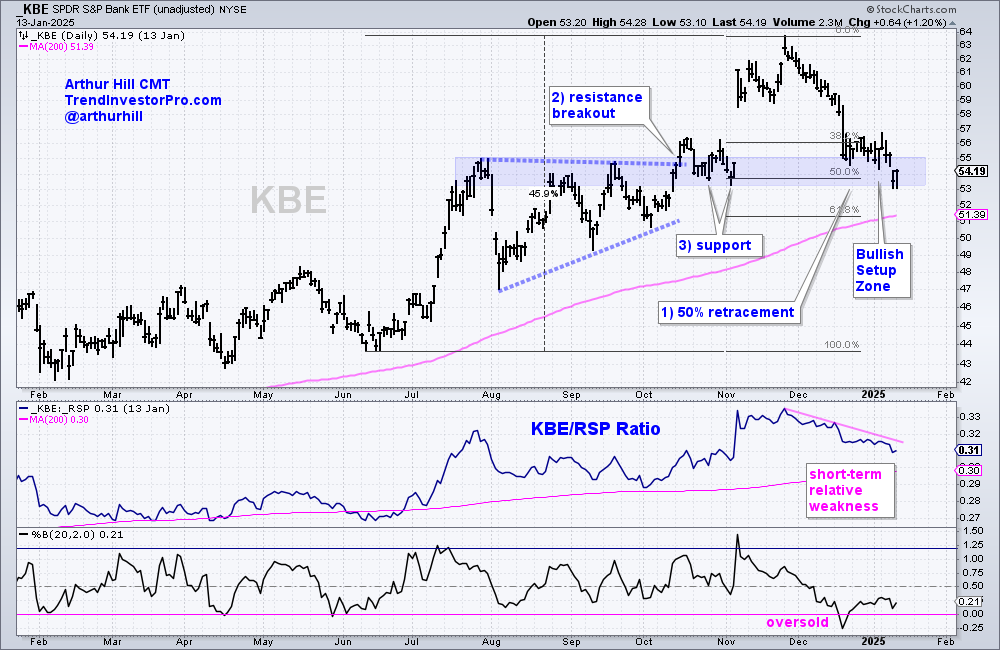
This report covers recent pullbacks in the major index ETFs (SPY, QQQ, MDY and IJR). Financials are a key driver for small-caps and I will show a leading uptrend in the Bank SPDR (KBE). We will then cover the breakout in the Robotics & AI ETF (BOTZ) and the pullback in the Cybersecurity ETF (CIBR).

Chart Trader – QQQ Pulls Back, Using %B, Smalls Return to Breakout, Banks Lead, Cybersecurity Tests 50-day, Robotics hold Breakout (Premium) Read More »

Understanding Equity Curve Performance and Setting Realistic Expectation (Premium)

It is important to understand the ebb and flow of the equity curve when trading a strategy. How long is the strategy flat or down? How often do we see strong momentum runs? How often does the strategy experience double-digit drawdowns? How can we take advantage of drawdown? We will answer these questions and more.

Understanding Equity Curve Performance and Setting Realistic Expectation (Premium) Read More »

Chart Trader Weekly Report – Broad Market Analysis, Leading Groups (ETFs), Chart Setups and Trading Ideas (Premium)

Stocks went on a tear the last eight days, but most of these moves were simply extensions of existing uptrends. Nevertheless, many stocks and ETFs became very overbought short-term. These include KBE, IGV, SKYY, FINX and CIBR. We also see the market pricing in policy shifts in Healthcare (XLV) and Defense (ITA), as well as the prospects of tariffs (CPER, DBB). Despite overbought conditions, it is a bull market we will highlight three stocks setting up: DDOG, CSX and CCEP.

Chart Trader Weekly Report – Broad Market Analysis, Leading Groups (ETFs), Chart Setups and Trading Ideas (Premium) Read More »

Do Overbought Filters Improve Performance for Momentum Rotation Strategies? (Premium)

Buying stocks that seem overbought is difficult, but this is often required when trading a momentum-rotation strategy. By design, these strategies buy the strongest stocks and many seem “overbought”. Momentum is all about buying high and selling higher. This report will test the original Rotation Investor strategies with the addition of an overbought filter. In other words, we will avoid stocks that are overbought. Does this filter help or hurt performance?

Do Overbought Filters Improve Performance for Momentum Rotation Strategies? (Premium) Read More »

Chart Trader Weekly Report – Broad Market Analysis, Leading Groups (ETFs), Chart Setups and Trading Ideas (Premium)

The election has come and gone, and the market trends remain the same. The major index ETFs were in uptrends well before the election, breadth was strong throughout September-October and yield spreads showed confidence. This broad market trio was, and is, bullish. Tech-related ETFs extended on their breakouts and we will feature three AI stocks. Commodities were all over the place so we will revisit industrial metals and copper. Analysis includes VRTX, FCX, COPX and DBA.

Chart Trader Weekly Report – Broad Market Analysis, Leading Groups (ETFs), Chart Setups and Trading Ideas (Premium) Read More »

Finding and Trading Oversold Conditions within Long-term Uptrends (Free)

There is only one way to trade in a long-term uptrend: long. Forget about picking tops and breaks below short-term moving averages. Leaning bearish within a long-term uptrend is not a profitable strategy. Instead, we should lean bullish and use oversold conditions to our advantage. In a long-term uptrend, I am only interested in

Finding and Trading Oversold Conditions within Long-term Uptrends (Free) Read More »

Scroll to Top