")
The next report will be on Tuesday, February 4th.
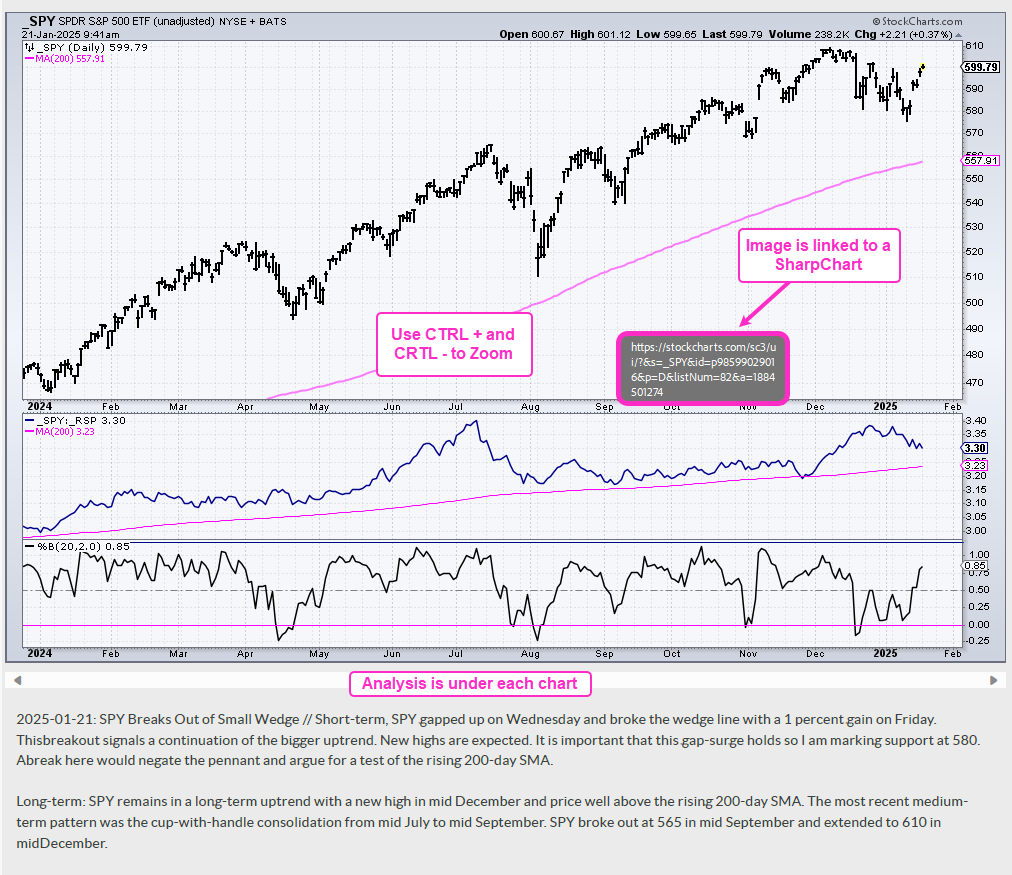
The long-term trends are up for the major index ETFs and their respective breadth indicators are net bullish. Long-term breadth indicators deteriorated in December, but rebounded in January. Over 60% of S&P 500, Nasdaq 100 and S&P 1500 stocks above their 200-day SMAs. New highs also rebounded as the High-Low Percent indicators turned positive. Junk bond spreads turned lower in January and there are no signs of stress in the credit markets. I am watching the 10-yr Treasury Yield closely because it formed a bullish wedge and a breakout could argue for higher yields, which would hurt small-caps.
– The weight of the evidence remains bullish for stocks.
– SPY, QQQ and RSP are in long-term uptrends (Bollinger Band signals)
– S&P 500 Breadth: Net Bullish since December 1, 2023.
– Nasdaq 100 Breadth: Net Bullish since February 1, 2023.
– S&P 1500 Breadth: Net Bullish since December 5, 2023.
– Junk bond spread fell in January (no stress in credit markets).
– Fed is in easing mode since the first rate cut in mid September.
– 10-yr Yield formed a bullish wedge and a breakout would target a move to 5%.
PDF Files are best viewed using the Adobe Acrobat browser plugin.
If viewing through a browser, right click on charts to open in a new tab or window.
Use CRTL and the Plus or Minus keys (+ -) to zoom. 125% works best for me.
Working with PDF Files
Before linking to the report, here is a brief explanation for the shift to PDF. Working with ChartLists at StockCharts and PDF files is an effective and efficient manner to track and analyze an ETF group. It saves me an enormous amount of “posting” time. This is the time required to create the web page, copy/paste the text for each section and upload the chart image. With a ChartList, I simply print the charts and analysis to one PDF. This also serves as a good archive.
The charts in the PDF files are linked to a corresponding SharpChart at StockCharts. There are two ways to open the PDF file: through your browser or through an application like Adobe Acrobat. When viewing the PDF through your browser, the best way to open a chart is to right click on the image and choose open in new tab/window. When viewing the PDF through Acrobat, you can open a chart in your default browser by simply clicking on the image.
The example below is a screen shot from the PDF.