")
The next report will be on Wednesday, February 4th.
Setting Re-evaluation Levels on Wedge Breakouts
The weight of the evidence remains bullish for stocks, despite an uptick in volatility and a wild news cycle. We are seeing upside leadership from finance, communication services, defense, medical devices, pipelines, cloud, cybersecurity and gold. We are also seeing lots of wedge/channel breakouts and most are holding. Here is the leading ETF symbol list: XLF, XLC, ITA, IHI, AMLP, CLOU, SKYY, CIBR, GLD
The news flow continues to ramp. Three weeks ago AI stocks surged on the Stargate announcement. A week later AI infrastructure stocks plunged on the DeepSeek needs. This week we have the markets in a twist with news on tariffs. Unfortunately, the news cycle is not going away. If anything, it is ramping up and we can expect above average volatility. Everywhere!
This makes it an exceptionally good time to tune out the news and focus on the charts. My goal with the news is to learn about companies (stocks) and get an idea of the bigger business trends. Reacting to the news is not a good trading strategy because we never really know what’s under the headlines.
Price distills all information into one value. All news, analysis, expectations, rumors, fundamentals, technicals, sentiment, opinions, geopolitics and uncertainties are built into the price. Volatility reflects the level of uncertainty and this is also visible in price.
The charts are littered with falling wedge/channel breakouts. Many ETFs hit new highs in November or December, corrected into January and broke out in mid January. The falling wedge/channel is the setup and the breakout is the signal that reverses the fall. Typically, the falling wedge/channel is a correction within a bigger uptrend. The breakout, therefore, signals an end to the corrective period and a resumption of the bigger uptrend.
The chart below shows an example using the Software ETF (IGV). IGV surged 34.1 percent from early September to early December and hit a 52-wk high in the process. IGV then fell back with a falling wedge that retraced 50-61.8 percent of the prior advance. This was the correction within the bigger uptrend. The setup.
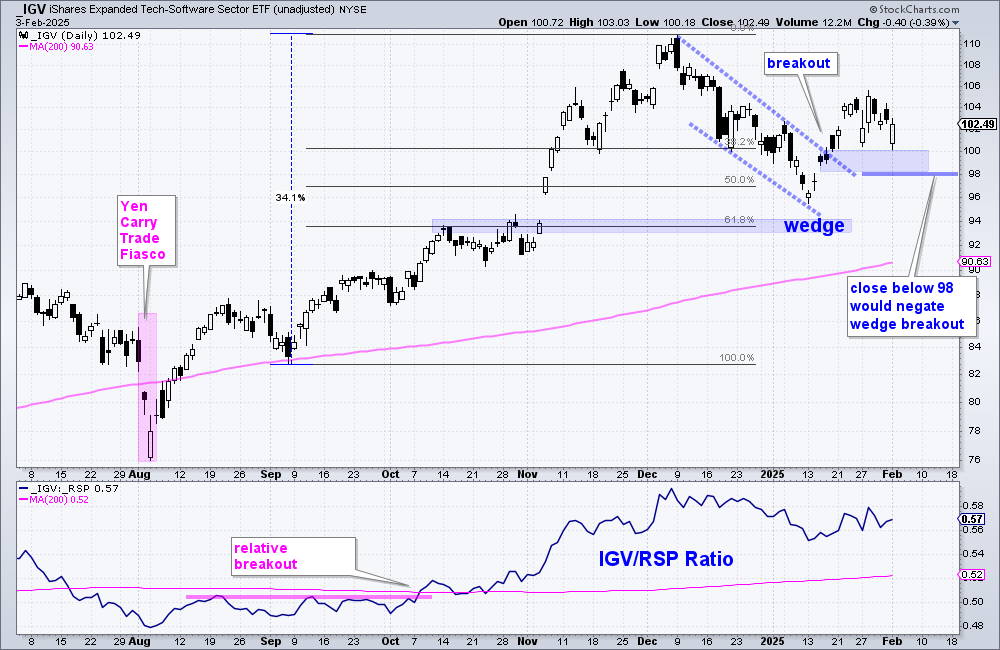
IGV broke the wedge line on January 17th and extended to 105 before falling back. This breakout is bullish until proven otherwise (wrong). Now we must choose a level that would call for a re-evaluation. The breakout zone turns into support and a strong breakout should hold. For IGV, the breakout zone is in the 98-100 area. A close below 98 would negate the breakout and call for a re-evaluation.
A failed breakout would not affect the long-term uptrend. A failed breakout simply means the particular pattern/setup did not work out. It happens. It is then back to the drawing board. Time to exercise some patience and wait for the next bullish setup to emerge. As long as we are in a bull market and the long-term trend is up, I will look for bullish setups and long opportunities.
There are lots of wedge/channel breakouts on the charts. Some ETFs are holding above their breakout zones and firmly bullish. Some fell back to their breakouts zones and are testing first support. The thick blue lines mark the re-evaluation levels to watch. A close below these levels would negate the breakouts and argue for a re-evaluation.
Highlights from today’s ETF report:
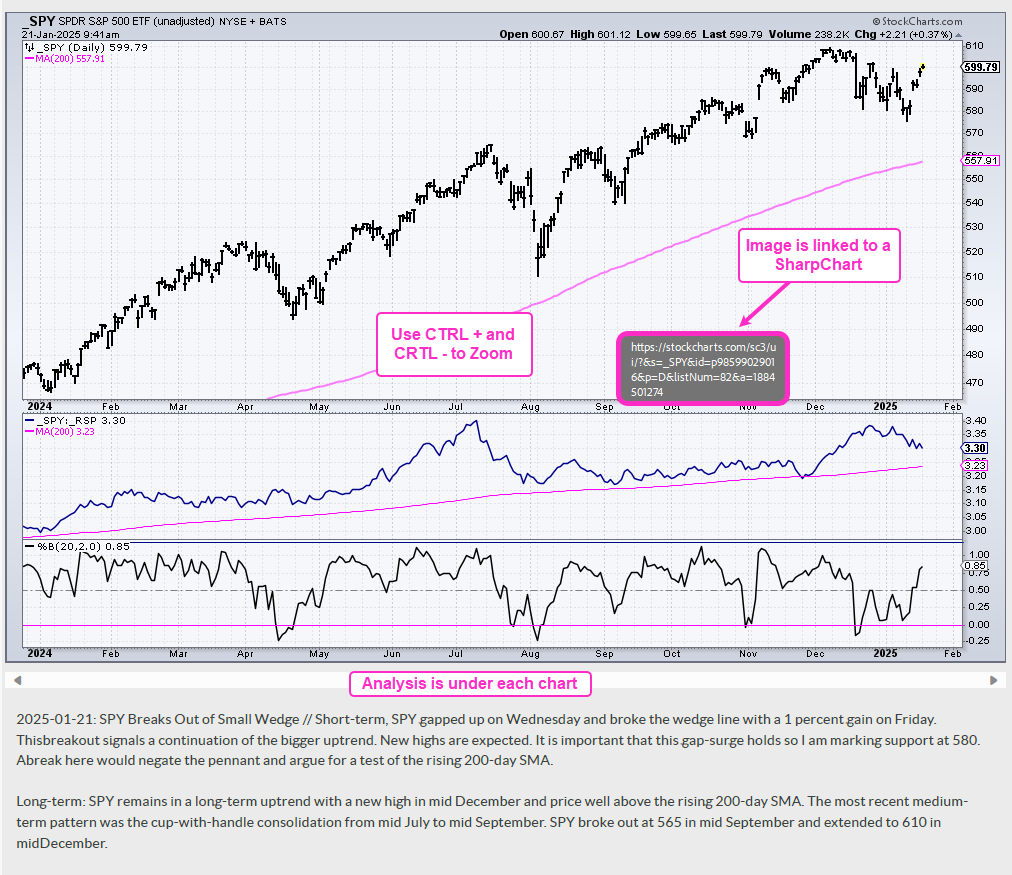
– SPY Forms Bullish Cup-with-handle Pattern
– QQQ, MDY and RSP Test Wedge Breakout Zones
– IJR and IWM Fall Back below Breakout Zone and Lag
– Technology SPDR (XLK) Tests Support and Underperforms
– Finance SPDR (XLF) Holds Near Highs and Leads
– Industrials SPDR (XLI) Pulls Back after Breakout Surge
– Communication Services SPDR (XLC) Hits New High and Leads
– Healthcare SPDR (XLV) Challenges 200-day SMA and Leads in 2025
– Utilities SPDR (XLU) Turns Volatile after Wedge Breakout
– Mag7 ETF (MAGS) Struggles with Breakout but Holds Support
– Global AI & Tech ETF (AIQ) Tests Breakout Zone
– Robotics AI ETF (ARTY) Turns Volatile within Rising Channel
– Global Robotics & AI ETF (BOTZ) Tests Flag Breakout Zone Again
– CIBR and CLOU Lead with New Highs
– SKYY, FINX and IGV Hold Wedge Breakouts
– FinTech ETF (FINX) Holds Channel Breakout
– Aerospace & Defense ETF (ITA) Leads with New High
– IFRA and PAVE Fall back after Breakout Surges
– GLD Extends on Breakout and Hits New High
– IBIT Breaks Pennant Line and Holds Breakout Zone
If viewing the PDF in a browser, right click on charts to open in a new tab or window.
Use CRTL and the Plus or Minus keys (+ -) to zoom. 125% works best for me.
Send feedback to support(at)trendinvestorpro.com or use the contact form.
Working with PDF Files
Why the shift to PDF? Working with ChartLists at StockCharts and PDF files is an effective and efficient manner to track and analyze a chart group (ETFs, stocks, Market Regime). It saves an enormous amount of “posting” time, which is the time required to copy/paste the text and charts for each section. With a ChartList, I simply print the charts and analysis to one PDF. This also serves as a good archive.
The charts in the PDF files are linked to a corresponding SharpChart at StockCharts. There are two ways to open the PDF file: through your browser or through an application like Adobe Acrobat. When viewing the PDF through your browser, the best way to open a chart is to right click on the image and choose open in new tab/window. When viewing the PDF through Acrobat, you can open a chart in your default browser by simply clicking on the image.
The example below is a screen shot from the PDF.
Send feedback to support(at)trendinvestorpro.com or use the contact form.