")
The next report will be on Wednesday, January 22nd.
Stocks moved sharply higher last week with several ETFs breaking out of corrective patterns. In particular, there are several falling wedge breakouts so I will detail this pattern using XLI as an example. I will show the prerequisites (uptrend), the Bullish Setup Zone, the pattern signal and the re-evaluation level. After this section, I will link to a PDF report that highlights these breakouts and sets the re-evaluation levels going forward.
First and foremost, the market regime is bullish (bull market). I updated the market regime charts last week Wednesday and will update them again tomorrow. Stocks advanced into November-December and then corrected into January. ETFs the peaked in November formed falling wedge patterns with relatively deep pullbacks. Even so, these pullbacks were considered corrections within a bigger uptrend. Why? Because the market regime stayed bullish and these ETFs were still in long-term uptrends.
Falling wedge patterns represent pullbacks within long-term uptrends. A subsequent wedge breakout reverses the downswing and signals a continuation of the bigger uptrend. Strong breakouts hold and weak breakouts fail. Thus, it is important that the gap-surges hold. The breakouts are bullish until proven otherwise and we can use the gap zones to mark first support. A sharp decline and close that fills the gap would call for a re-evaluation.
Falling Wedge Example with XLI
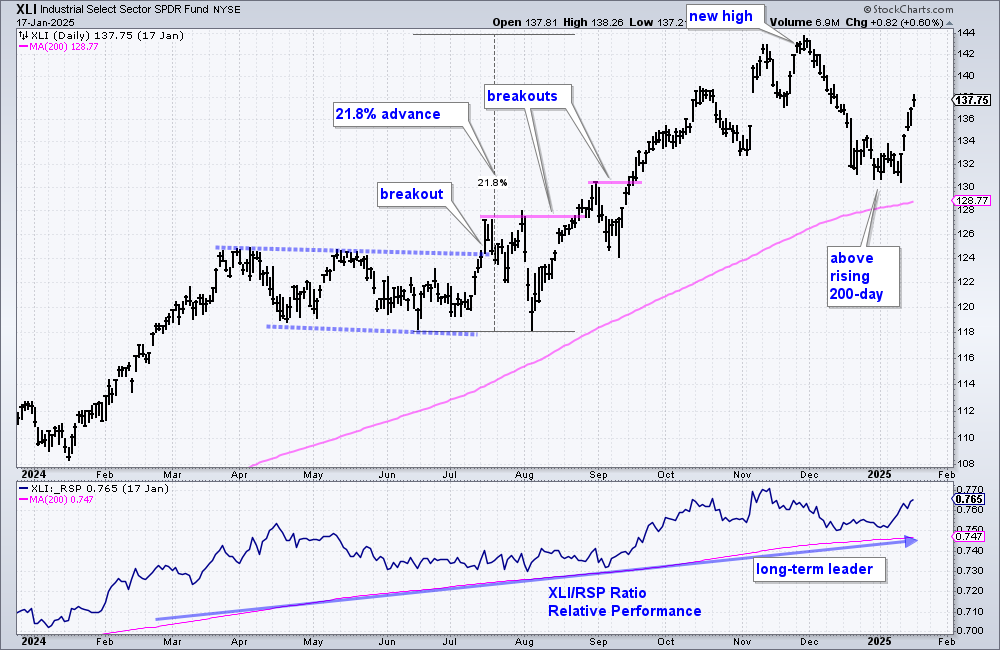
The Industrials SPDR (XLI) provides us with a great example. The next four charts will take you through the stages: uptrend, Bullish Setup Zone, pattern and volatility. First, XLI was in a long-term uptrend with a new high in late November and price above the 200-day SMA. This means a pullback was viewed as a correction within the long-term uptrend.
Identifying Bullish Setup Zones
Once a pullback is underway, I look for potential Bullish Setup Zones. These zones are marked by key retracements and support levels. On the XLI chart, we can see the 50-61.8 percent retracements and two broken resistance levels in the 128-131 area. Note that broken resistance levels turn into future support. The confluence of retracements and support marks the Bullish Setup Zone, which is an area to watch for firming and reversal.
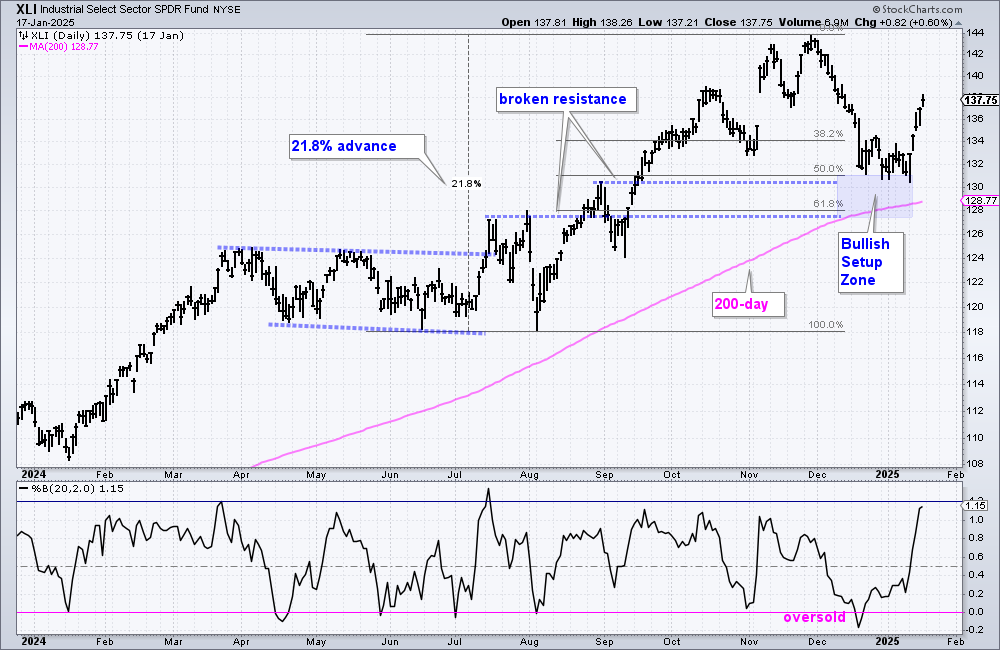
Chartists can also look for oversold conditions to signal a tradable pullback. Notice that XLI became oversold on December 18th as Percent-B dipped below zero. Percent-B dips below zero when the close is the below the lower Bollinger Band (20,2). This means price fell over 2 standard deviations, which is an exaggerated decline that can lead to a bounce. Note, however, they XLI but did not bottom until January 10th. Therefore we need a pattern and a trigger level.
From Setup to Signal
XLI was setting up from December 18th to January 10th as a falling wedge formed. The pattern provides us with the key levels to watch for a breakout. A break above the upper line shows improving upside momentum and is often the early signal. XLI established resistance at 134.5 in late December and early January. The ETF broke this level with a surge last week, which shows strong buying pressure. Overall, the breakout signals an end to the correction and a resumption of the bigger uptrend. New highs are expected as long as the breakout holds.
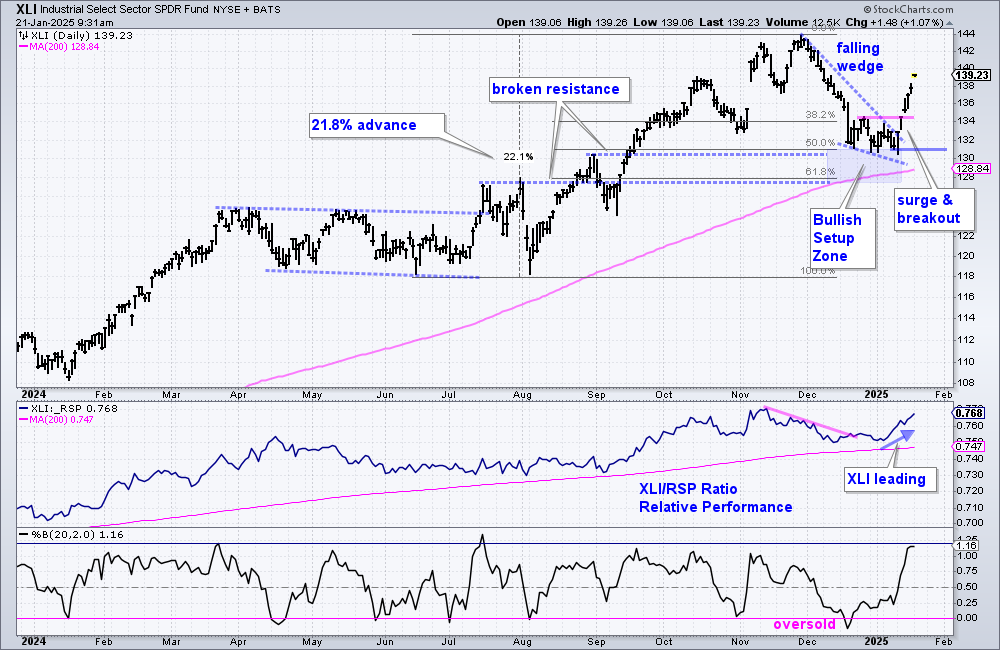
A strong breakout will hold, while a weak breakout will fail. XLI established support at 131 with lows in late December and early January. A close below this level would clearly negate the wedge breakout and be negative. XLI is short-term overbought after a ~5 percent surge in five days. Overbought is not bearish, but it means we could see a stall or pullback. A short 2-3 percent pullback is acceptable.
Yen Carry Trade Fiasco
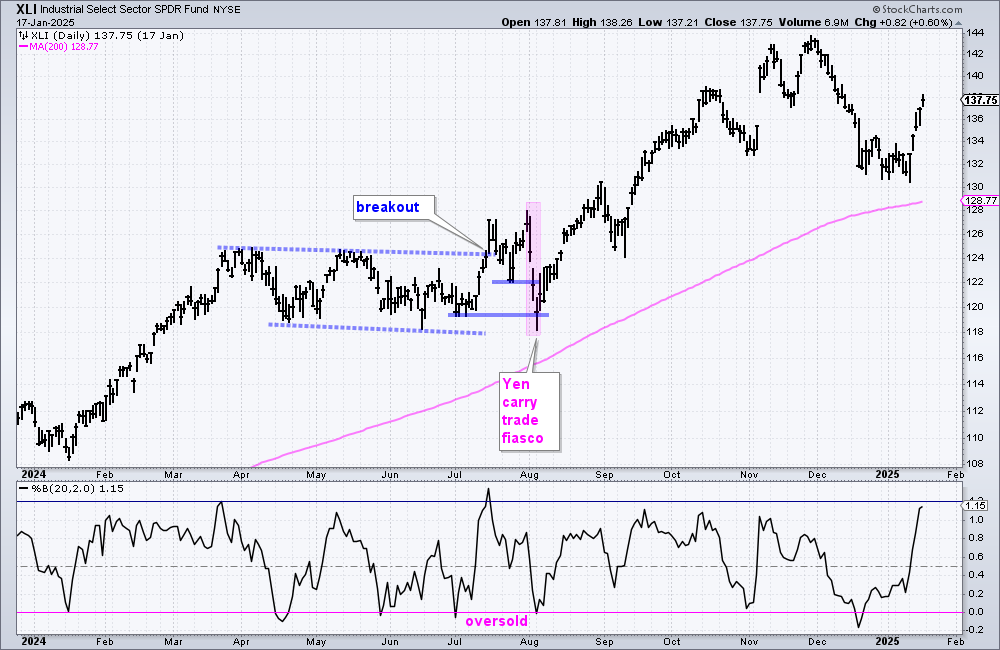
XLI also broke out with a surge in mid July. This breakout was looking good and then the Yen carry trade fiasco hit the market in early August. Click here to learn more. It was a fiasco because stocks plunged for three days and then sharply recovered. Many stocks and ETFs broke their June-July lows during the early August plunge. Such a move would have negated the breakout trades, and resulted in a nasty whipsaw.
I bring up the Yen carry trade fiasco because we could be in for some volatility in the days and weeks ahead. A hyper news cycle could increase short-term volatility in the markets. One way traders can use volatility to their advantage is to wait for oversold setups, such as a Percent-B dip below zero. We are not there now, but it is something to consider.
Working with PDF Files
Before linking to the report, here is a brief explanation for the shift to PDF. Working with ChartLists at StockCharts and PDF files is an effective and efficient manner to track and analyze an ETF group. It saves me an enormous amount of “posting” time. This is the time required to create the web page, copy/paste the text for each section and upload the chart image. With a ChartList, I simply print the charts and analysis to one PDF. This also serves as a good archive.
The charts in the PDF files are linked to a corresponding SharpChart at StockCharts. There are two ways to open the PDF file: through your browser or through an application like Adobe Acrobat. When viewing the PDF through your browser, the best way to open a chart is to right click on the image and choose open in new tab/window. When viewing the PDF through Acrobat, you can open a chart in your default browser by simply clicking on the image.
The example below is a screen shot from the PDF.
Send feedback to support(at)trendinvestorpro.com or use the contact form.
PDF Report
This PDF report below covers:
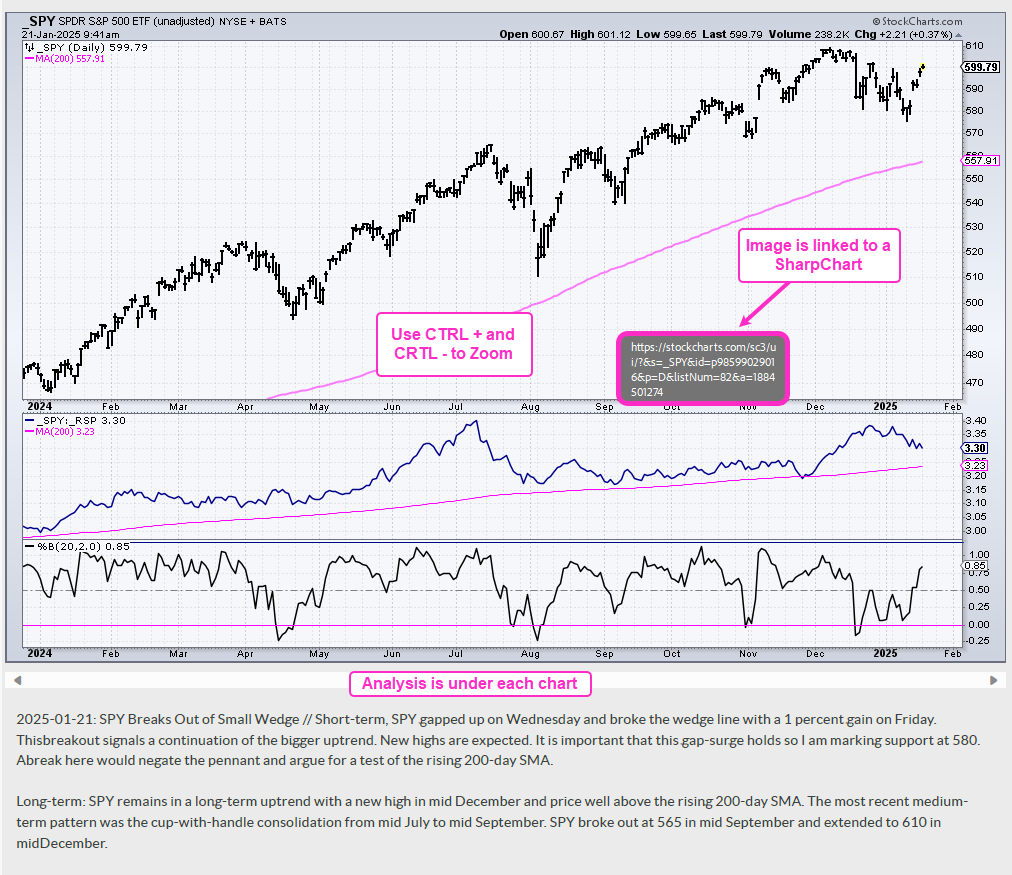
- Small wedge breakouts in SPY and QQQ
- Deep wedge breakouts in several ETFs
(RSP, MDY, XLF, XLI, XLU, KBE, KRE, KIE, ITA, INFR, PAVE) - The Aerospace & Defense ETF (XAR) sports a triangle breakout
- The S&P SmallCap 600 SPDR broke out, but the Russell 2000 ETF fell short
- Small-caps overall are still lagging
Click here for a PDF report with linked charts
If viewing this PDF in a browser, right click on the
chart to open as a new tab or window.
Use CRTL and the Plus or Minus keys (+ -) to zoom.
125% works best for me.