")
The next report will be on Thursday, January 23rd.
There are eight stock setups today. All stocks are in uptrends of varying degrees and sport bullish continuation setups. These setups occur when there is a pullback or bullish continuation pattern forming. If they have yet to break out, I am marking the resistance level to watch (pink line). The re-evaluation level is a support level (blue line) to watch for signs of a failure. A close below the re-evaluation level means the breakout failed and setup/pattern is no longer valid.
Some setups also feature Bullish Setup Zones (see report here)
Stocks Setups and Breakouts
– BURL Forms Bullish Consolidation within Uptrend
– JAZZ Winds up with Triangle after Breakouts
– BMY Corrects with Falling Wedge
– ZS Holds 200-day and Reverses off Bullish Setup Zone
– VEEV Surges off Bullish Setup Zone
– ACN Consolidates above 200-day SMA
– APLD Holds Breakout Support after Throwback
– CDNS Bounces off Bullish Setup Zone with Bull Flag
If viewing the PDF in a browser, right click on charts to open in a new tab or window.
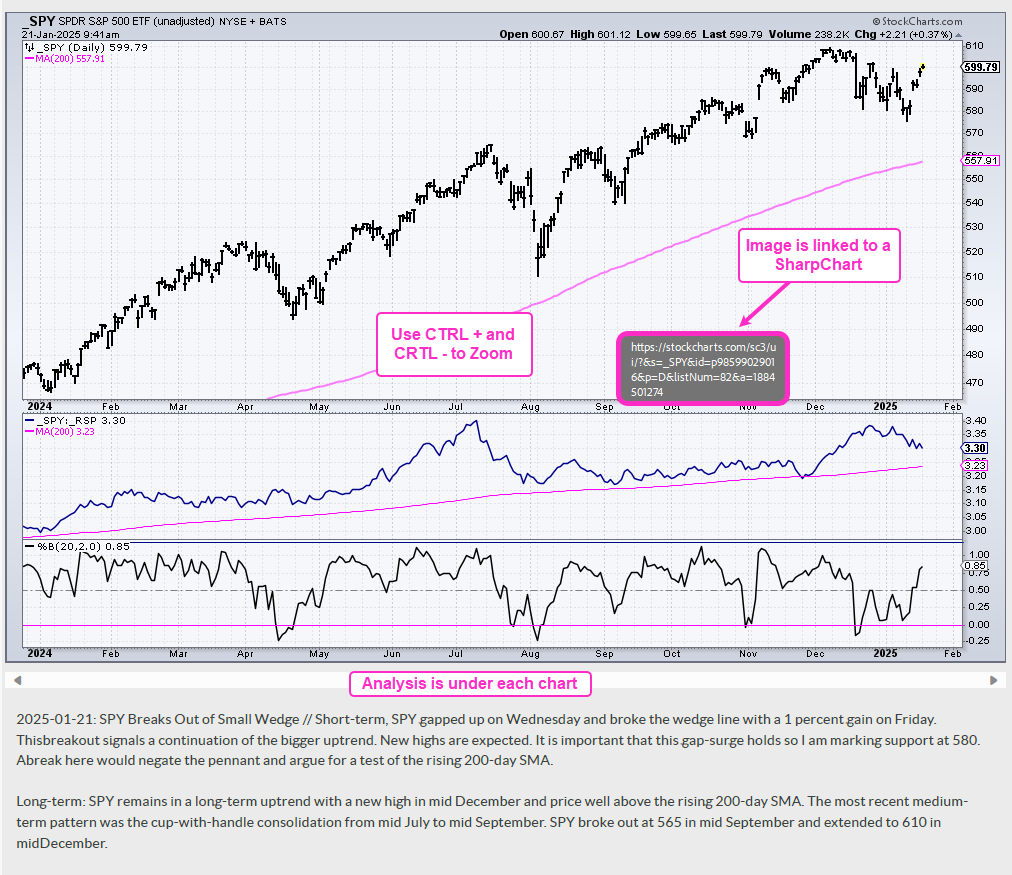
Use CRTL and the Plus or Minus keys (+ -) to zoom. 125% works best for me.
Send feedback to support(at)trendinvestorpro.com or use the contact form.
Working with PDF Files
Before linking to the report, here is a brief explanation for the shift to PDF. Working with ChartLists at StockCharts and PDF files is an effective and efficient manner to track and analyze an ETF group. It saves me an enormous amount of “posting” time. This is the time required to create the web page, copy/paste the text for each section and upload the chart image. With a ChartList, I simply print the charts and analysis to one PDF. This also serves as a good archive.
The charts in the PDF files are linked to a corresponding SharpChart at StockCharts. There are two ways to open the PDF file: through your browser or through an application like Adobe Acrobat. When viewing the PDF through your browser, the best way to open a chart is to right click on the image and choose open in new tab/window. When viewing the PDF through Acrobat, you can open a chart in your default browser by simply clicking on the image.
The example below is a screen shot from the PDF.
Send feedback to support(at)trendinvestorpro.com or use the contact form.