
ITB Consolidates, Yields Fall, SOXX Ignores Curbs, LIT, SLV and FXI Set Up, TSM Reasserts Uptrend, META Leads, MSFT Recovers (Premium)

The next report will be posted on Thursday morning, December 5th.

Report and Video Headlines

  • Market Overview – A Bull Market
  • 10-yr Treasury Yield Remains with Reversal
  • Home Construction ETF Forms Short-term Pennant
  • Semis Pop Despite Semiconductor Curbs
  • XLK Forms Cup-with-handle
  • Lithium ETF Continues to Consolidate
  • Silver ETF Hits Bullish Setup Zone
  • China Large-Cap ETF Also Hits Bullish Setup Zone
  • TSM Breaks Short-term Resistance
  • META Surges within Channel Correction
  • Microsoft Rebounds after Earnings Gap

Publishing on Tuesday and Thursday

Chart Trader is moving back to publishing on Tuesday and Thursday before the open. The focus will remain on stock and ETF trading setups for both swing and position traders. Instead of one big report and video, the idea is to break up the reports into smaller bite-sized pieces.

I always monitor the long-term trend for the major index ETFs (SPY, QQQ), long-term breadth indicators and yield spreads, but their status does not change very often. For example, we have been in a bull market for at least a year. I will continue to provide updates on these, but not as often.

Market Overview

The bull market remains intact. SPY and QQQ hit new highs on Monday. Long-term breadth is bullish with 70% or more of S&P 500 and Nasdaq 100 stocks above their 200 and 150 day SMAs. Also note that Nasdaq 100 breadth improved over the last six weeks. Yield spreads remain at narrow levels and show no stress in the corporate credit markets.

10-yr Treasury Yield Remains with Reversal

I covered the long-term falling channel and short-term reversal in the 10-yr Treasury Yield last week. This key interest rate benchmark fell sharply on Monday, November 25th (pink oval), and continued lower the last four days. This decline reversed the short-term upswing from mid September to mid November. This current swing (immediate trend) is down and this is within a larger falling channel (downtrend). Based on these trends, the outlook is for lower yields. A surge above 44 (4.4%) would call for a re-evaluation.

The bottom window shows the 7-10 Yr Treasury Bond ETF (IEF) as a mirror image. There is a long-term rising channel (uptrend) and IEF reversed the downswing with a surge on November 25th (blue oval). This argues for higher prices in IEF.

Home Construction ETF Forms Short-term Pennant

I covered the Home Construction ETF (ITB) and several home builders last Tuesday as they triggered short-term momentum thrusts. ITB became short-term overbought as %B surged above 1.2% (green arrow) and then consolidated the last four days. Overall, I see a 34% advance and a sharp decline in October that retraced 50%. ITB firmed and a consolidation pattern formed over the last three months (blue dashed lines). I view this as a bullish continuation pattern and a breakout at 130 would confirm the pattern. Using the measured move technique, a consolidation breakout would target a move to the 154 area (115 + 34%).

Within this pattern, ITB surged and formed a pennant the last four days. This is a short-term bullish continuation pattern and a breakout at 125.5 (pink line) would signal a continuation of last week’s surge. This would also increase the chances for a bigger breakout at 130. A pennant break out would target a move to the 133 area. Should ITB trigger a pennant breakout, a close below 122 would negate the signal.

Semis Pop Despite Semiconductor Curbs

The Semiconductor ETF (SOXX) surged 2.63%, despite new curbs on US semiconductor exports to China. Note that Reuters reported the following: “US targets China’s chip industry with new restrictions”. Perhaps the restrictions were not as strict as expected or perhaps this news is already priced in. SOXX, SMH and XSD are lagging the broader market overall. QQQ hit a new high this week and the Technology SPDR (XLK) is very close to a new high. SOXX, in contrast, is well below its July and October highs. XLK is up 4.5% since October and SOXX is down 4% since October.

The next chart shows SOXX without pattern annotations. Instead, we have the PPO(10,200,0) in the bottom window and %B in the middle window. The PPO signals an uptrend when it exceeds +3% and a downtrend when it exceeds -3%. For SOXX, the PPO turned bullish with a move above +3% in January 2023. It dipped into negative territory in late October 2023 and late November 2024, but has yet to signal a downtrend.

With an uptrend in force, we next look for oversold conditions within this uptrend. Chartists can also combine these with support levels and patterns. The blue dashed lines show when %B moves above 0, which means it became oversold and then turned up. This simple strategy picked bottoms in late April, early August and early September. The upturns in late July and early November were duds. Most recently, SOXX became oversold and %B crossed above on November 19th. SOXX also broke its late November high with a surge the last two days. This looks like an upturn and I would re-evaluate on a close below 208.

XLK Forms Cup-with-handle

The next chart shows the Technology SPDR (XLK) coming to life with a pennant breakout and a cup-with-handle forming. Note that these patterns follow the triangle breakout in the second half of September. This pattern and breakout were featured in reports at the time (QQQ, XLK, MAGS). The cup-with-handle is a long-term bullish continuation pattern and a breakout above the July-October highs would confirm the pattern. Pennants are short-term continuation patterns and Monday’s breakout signals a continuation higher. Overall, I think the triangle breakout is the most important pattern in play, and it is bullish. Key support is set at 215.

Lithium ETF Continues to Consolidate

The Lithium Battery Tech ETF (LIT) continues to setup with a bullish triangle taking shape. The long-term trend turned up as the PPO exceeded +3% in early October and the ETF surged some 40%. It then consolidated with a triangle, which is a continuation pattern. LIT was quite overbought and this consolidation worked off these overbought conditions. The range is narrowing and a breakout at 46 would be bullish. I would then target a move to the low 50s and set a re-evaluation level at 43.

The middle window shows %B dipping into the .25-.50 area in late October and late November. This zone represents a mild oversold condition or shallow pullback. For reference, the zone from 0 to .25 represents a moderately oversold condition and values below 0 signal an oversold condition.

Silver Hits Bullish Setup Zone

The next chart shows the Silver ETF (SLV) falling back to the prior breakout area and retracing around 61.8% of the prior 31.3% advance. This combination marks a classic bullish setup zone that could give way to a reversal. A falling wedge formed with short-term resistance marked at 28.50. A breakout here would be bullish and reverse the short-term downswing. I would then expect a move to the mid 30s. Should SLV break out, I would mark the initial re-evaluation level at 27.

The middle window shows %B becoming moderately oversold with a dip below .25 in mid November. A small bullish divergence formed the last three weeks as %B formed a higher low and SLV formed a lower low. Downside momentum is waning and a break above .50 would be positive for %B.

China Large-Cap ETF Also Hits Bullish Setup Zone

The next chart shows the China Large-Cap ETF (FXI) with similar characteristics. FXI surged 52.6% into early October and then retraced 61.8% with a falling wedge that returned to he May high. The blue shading marks the Bullish Setup Zone around 29. I am marking falling wedge resistance  at 31.5 and a breakout here would be bullish. I would then mark re-evaluation support at 29.

TSM Breaks Short-term Resistance

The next chart shows Taiwan Semiconductor (TSM) with a 38.7% advance to new highs in mid October. TSM then retraced 61.8% of this advance with a decline back to the breakout zone. There is a falling channel since October, but I am simply going to mark short-term resistance with the late November high. TSM broke this level with a surge the last two days. This breakout reverses the short-term downswing and signals a continuation of the bigger uptrend. I would mark re-evaluation support at 178.

META Surges within Channel Correction

The next chart shows META with a cup-with-handle in the summer and a breakout in mid September. The stock hit new highs into early October and then corrected with a falling channel as Mark Zuckerberg went to Mar-a-Lago. Not sure what became of that meeting, but the stock surged 3.22% on Monday and is on the verge of breaking out. A breakout would signal a continuation higher and target a move the 670 area or even higher. I would mark re-evaluation support at 550.

Microsoft Rebounds after Earnings Gap

The Microsoft (MSFT) chart looks similar to SOXX. The stock peaked in July and remains well below the July high. It is underperforming the broader market and QQQ, but remains in a long-term uptrend (according to the PPO). Overall, a triangle formed into October and the stock broke out in late October. This breakout did not hold as MSFT gapped down after earnings and broke the October low. I am impressed because the stock quickly rebounded and the bounce again the past week. The gap is filling as buying pressure increases. I think the triangle breakout is back in play with the October-November lows marking support at 405.

The middle window shows %B with the blue dashed lines marking moves above 0. This means %B became oversold and then turned up. These signals called a few good bottoms, but failed during the July decline. Most recently, %B became oversold with the earnings gap and this marked the most recent low. Even though it can be difficult to buy after a gap and support break, short-term ugliness can present traders with an opportunity.

Thanks for tuning in and have a great day!

Plunge in 10yr Yield Triggers Home Builders – Analyzing ITB and Five Stocks (Premium)

Today’s report analyzes the move in the 10-yr Treasury Yield, the surge in ITB and five home builder stocks. Home Builders were lagging the last few months, but the declines look like normal corrections. The retracements were normal and some surged off bullish setup zones. In addition, we are seeing a momentum thrust in %B.

Plunge in 10yr Yield Triggers Home Builders – Analyzing ITB and Five Stocks (Premium) Read More »

Drop in Yields Triggers Gap-Surge in Home Builders (Free)

The 10-yr Treasury Yield plunged as Treasury bonds surged on the heels of a new nomination for Treasury secretary. These moves lifted small-caps, banks and homebuilders. Banks have been leading for some time and small-caps started their move last week. Homebuilders held out for interest rates and got their catalyst on Monday. Today’s report will analyze

Drop in Yields Triggers Gap-Surge in Home Builders (Free) Read More »

Four Prerequisites to Improve Your Odds – A Live Example (Free)

Even though trading based on chart analysis involves some discretionary decisions, chartists can improve the odds of success by systematizing their process. This report will show four prerequisite filters based on a top-down approach. We will start with the broader market, look at the sector, and then apply two qualifying filters to the stock. First, I would make sure

Four Prerequisites to Improve Your Odds – A Live Example (Free) Read More »

Chart Trader – Biotech Oversold, MLPs Surge, Lithium Consolidates, Uranium Breaks Out, Two Leading Stocks and Two with Pullbacks (Premium)

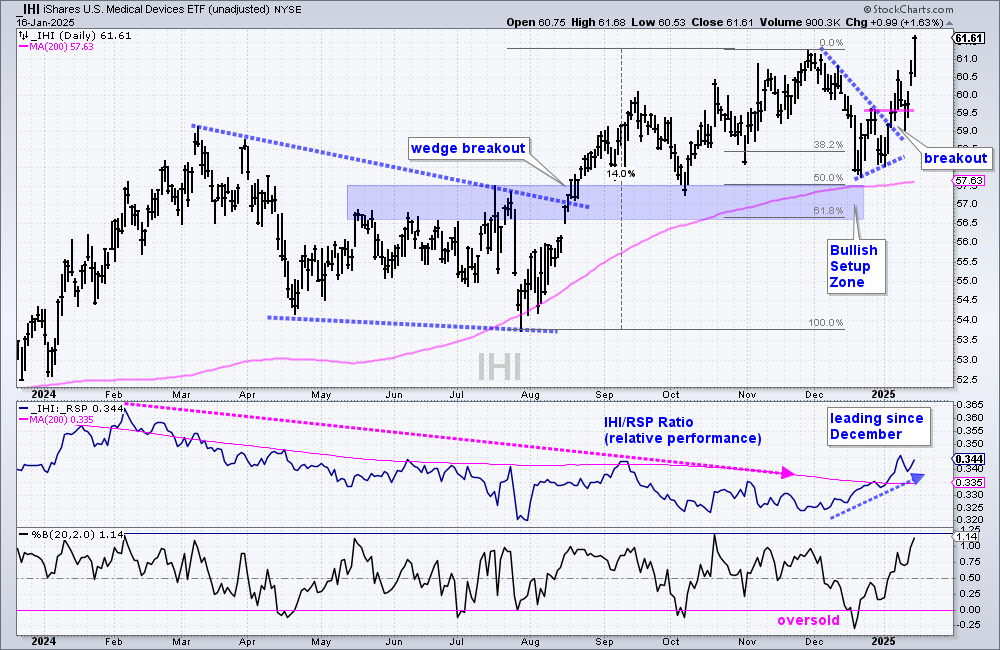
Today’s report starts with some of the leading ETFs in strong uptrends – but without setups. These include software (IGV), fintech (FINX) and finance (XLF). Attention then turns to some oversold setups in Healthcare and Biotech, and the group’s leader (Medical Devices). MLPs are breaking out within the Energy sector and we are seeing two commodity ETFs strengthen (Uranium and Lithium). Turning to stocks, we have two breakout leaders (TJX, VRSK) and two former leaders with pullbacks (AVGO, UHS).

Chart Trader – Biotech Oversold, MLPs Surge, Lithium Consolidates, Uranium Breaks Out, Two Leading Stocks and Two with Pullbacks (Premium) Read More »

Chart Trader – QQQ Pulls Back, Using %B, Smalls Return to Breakout, Banks Lead, Cybersecurity Tests 50-day, Robotics hold Breakout (Premium)

This report covers recent pullbacks in the major index ETFs (SPY, QQQ, MDY and IJR). Financials are a key driver for small-caps and I will show a leading uptrend in the Bank SPDR (KBE). We will then cover the breakout in the Robotics & AI ETF (BOTZ) and the pullback in the Cybersecurity ETF (CIBR).

Chart Trader – QQQ Pulls Back, Using %B, Smalls Return to Breakout, Banks Lead, Cybersecurity Tests 50-day, Robotics hold Breakout (Premium) Read More »

Understanding Equity Curve Performance and Setting Realistic Expectation (Premium)

It is important to understand the ebb and flow of the equity curve when trading a strategy. How long is the strategy flat or down? How often do we see strong momentum runs? How often does the strategy experience double-digit drawdowns? How can we take advantage of drawdown? We will answer these questions and more.

Understanding Equity Curve Performance and Setting Realistic Expectation (Premium) Read More »

Chart Trader Weekly Report – Broad Market Analysis, Leading Groups (ETFs), Chart Setups and Trading Ideas (Premium)

Stocks went on a tear the last eight days, but most of these moves were simply extensions of existing uptrends. Nevertheless, many stocks and ETFs became very overbought short-term. These include KBE, IGV, SKYY, FINX and CIBR. We also see the market pricing in policy shifts in Healthcare (XLV) and Defense (ITA), as well as the prospects of tariffs (CPER, DBB). Despite overbought conditions, it is a bull market we will highlight three stocks setting up: DDOG, CSX and CCEP.

Chart Trader Weekly Report – Broad Market Analysis, Leading Groups (ETFs), Chart Setups and Trading Ideas (Premium) Read More »

Do Overbought Filters Improve Performance for Momentum Rotation Strategies? (Premium)

Buying stocks that seem overbought is difficult, but this is often required when trading a momentum-rotation strategy. By design, these strategies buy the strongest stocks and many seem “overbought”. Momentum is all about buying high and selling higher. This report will test the original Rotation Investor strategies with the addition of an overbought filter. In other words, we will avoid stocks that are overbought. Does this filter help or hurt performance?

Do Overbought Filters Improve Performance for Momentum Rotation Strategies? (Premium) Read More »

Chart Trader Weekly Report – Broad Market Analysis, Leading Groups (ETFs), Chart Setups and Trading Ideas (Premium)

The election has come and gone, and the market trends remain the same. The major index ETFs were in uptrends well before the election, breadth was strong throughout September-October and yield spreads showed confidence. This broad market trio was, and is, bullish. Tech-related ETFs extended on their breakouts and we will feature three AI stocks. Commodities were all over the place so we will revisit industrial metals and copper. Analysis includes VRTX, FCX, COPX and DBA.

Chart Trader Weekly Report – Broad Market Analysis, Leading Groups (ETFs), Chart Setups and Trading Ideas (Premium) Read More »

Finding and Trading Oversold Conditions within Long-term Uptrends (Free)

There is only one way to trade in a long-term uptrend: long. Forget about picking tops and breaks below short-term moving averages. Leaning bearish within a long-term uptrend is not a profitable strategy. Instead, we should lean bullish and use oversold conditions to our advantage. In a long-term uptrend, I am only interested in

Finding and Trading Oversold Conditions within Long-term Uptrends (Free) Read More »

Chart Trader Weekly Report – Broad Market Analysis, Leading Groups (ETFs), Chart Setups and Trading Ideas (Premium)

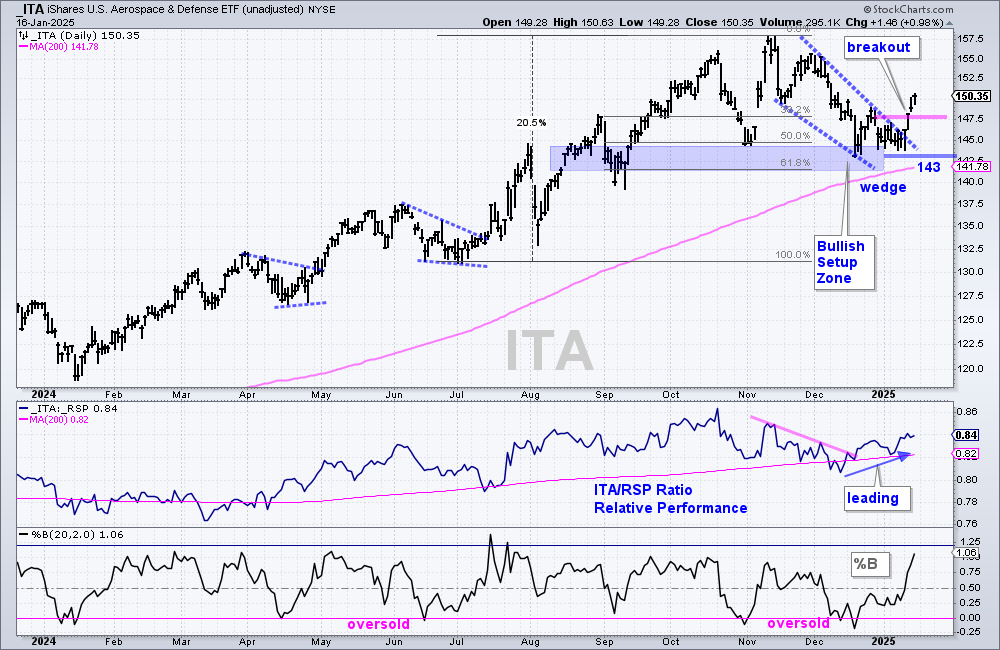
The weight of the evidence remains bullish for stocks, but a correction is underway as Treasury yields surge and semiconductors weigh on the largest sector. Semis account for 35.57% of the Technology SPDR and this sector accounts for 32.24% of the S&P 500. We will review the long-term breadth indicators and show some short-term breadth indicators to watch for oversold conditions. Names hitting bullish setup zones include XLV, GEHC, AMGN, ITA, INDA, CPER and COPX.

Chart Trader Weekly Report – Broad Market Analysis, Leading Groups (ETFs), Chart Setups and Trading Ideas (Premium) Read More »

Two Indicators to Start your Process and Improve Your Edge

There are no magic bullets, but we can improve our trading edge by starting our selection process with two proven concepts: trend and momentum. These are perhaps the two most powerful forces in the market. The idea is relatively simple: stay on the right side of the trend and focus on the leaders. This is basically dual-momentum. Starting our process with these two steps

Two Indicators to Start your Process and Improve Your Edge Read More »

Diversification Benefits – Recency Bias – Dealing with Drawdowns – Tweaks

The Dual Momentum Rotation Strategies started out with a bang this year and produced big gains in the first three months. Market action then turned mixed with tech-related stocks falling sharply. The Nasdaq 100 strategy moved into a deep drawdown the last five weeks (NDX update here). The S&P 500 strategy is holding up well because

Diversification Benefits – Recency Bias – Dealing with Drawdowns – Tweaks Read More »

Chart Trader Weekly Report – Broad Market Analysis, Leading Groups (ETFs), Chart Setups and Trading Ideas (Premium)

The weight of the evidence remains bullish for stocks. The Composite Breadth Model is at +5, the vast majority of stocks are above their 200-day SMAs and yield spreads remain narrow. Short-term, we could see some headwinds and volatility because the 10-yr Treasury Yield surged and the election looms. We will cover the surge in the 10yr Yield, but take a pass on the election.

Chart Trader Weekly Report – Broad Market Analysis, Leading Groups (ETFs), Chart Setups and Trading Ideas (Premium) Read More »

Chart Trader Weekly Report – Broad Market Analysis, Leading Groups (ETFs), Chart Setups and Trading Ideas (Premium)

Today’s report starts with signs of broadening participation as mid-caps perk up. SPY hit another new high, but QQQ and semis remain below their summer highs. Large-cap techs are also showing some fatigue. We then compare SOXX and SMH, cover the leading tech ETFs and highlight the breakout in Bitcoin. We finish with two stocks: HPE (data centers) and MLM (construction materials).

Chart Trader Weekly Report – Broad Market Analysis, Leading Groups (ETFs), Chart Setups and Trading Ideas (Premium) Read More »

Chart Trader Weekly Report – Broad Market Analysis, Leading Groups (ETFs), Chart Setups and Trading Ideas (Premium)

Today’s report starts with strong breadth, the plunge in yield spreads and fresh highs in SPY. Tech-related ETFs are leading in October as triangle breakouts extend (QQQ, XLK, MAGS) and new highs are tagged (CIBR, IGV, SKYY, FINX). We then detail setups in the Healthcare (XLV), Palladium (PALL) and Biotech (IBB). Other Symbols Covered: VRTX, AMGN, AKAM and MU.

Chart Trader Weekly Report – Broad Market Analysis, Leading Groups (ETFs), Chart Setups and Trading Ideas (Premium) Read More »

Scroll to Top