
Market and ETF Report – SPY and QQQ Reverse, Key Sectors and ETF Follow, Energy and Ag Buck the Trend (Premium)

Stocks fell sharply the last two days and these declines were enough to reverse the short-term uptrends in many stock-based ETFs. In particular, the short-term uptrends reversed for SPY and QQQ. This is a big deal because the Composite Breadth Model was already bearish and these two were already in long-term downtrends. These short-term reversals suggest that the bigger downtrends are continuing and to expect lower prices in the coming weeks. As noted on Thursday, September is also one of the weakest months. Downside participation was very broad on Monday and this shows that correlations rise in bear market declines. This means most stock-based ETFs would be affected if SPY were to test or break its June lows.

About the ETF Trends, Patterns and Setups Report

This report contains discretionary chart analysis based on my interpretation of the price charts. This is different from the fully systematic approach in the Trend Composite strategy series. In this ETF Trends, Patterns and Setups report, I am looking for leading uptrends and tradable setups within these uptrends. While I use indicators to help define the trend and identify oversold conditions within uptrends, the assessments are mostly based on price action and the price chart (higher highs, higher lows, patterns in play). Sometimes the chart assessment can be at odds with the indicators.

This Week's Commentary Schedule

  • Tuesday – 23 August: Market-ETF Report and Signal-Rank Table Update
  • Wednesday – 24 August Market-ETF Video and Market Regime Update
  • Thursday – 25 August: Market-ETF Report and Signal-Rank Table Update
  • Saturday – 27 August: ETF Signal and Rank Table

AD% and 1-day ROC Confirm Broad Participation

The chart below shows AD% for four indexes. AD% is the percentage of advances less the percentage of declines. A dip below -80% means more than 90% of stocks declined (10% advances – 90% declines = -80%). AD% exceeded -90% for the S&P 500, Nasdaq 100 and S&P MidCap 400, and exceeded -85% for the S&P SmallCap 600 and S&P 1500 (red bars). Selling pressure hit 10 of 11 sector SPDRs and most industry groups. Nasdaq 100 AD% experienced three -80% down days within the last four days (red shading), which shows strong selling pressure within the Technology sector.

The table below shows ETFs that bucked the selling pressure and advanced on Monday. The table is sorted by the %Change 1-day and also shows the %Change Year-to-date for reference. Several commodity-based ETFs moved higher (JO, WEAT, SOYB, CORN, DBE, DBC, DBA, DBB). There are a few China-based ETFs and some energy-based ETFs in the mix as well. I am not interested in China-based ETFs at the moment, but strength in commodity and energy ETFs is something to note.

Composite Breadth Model Remains Bearish

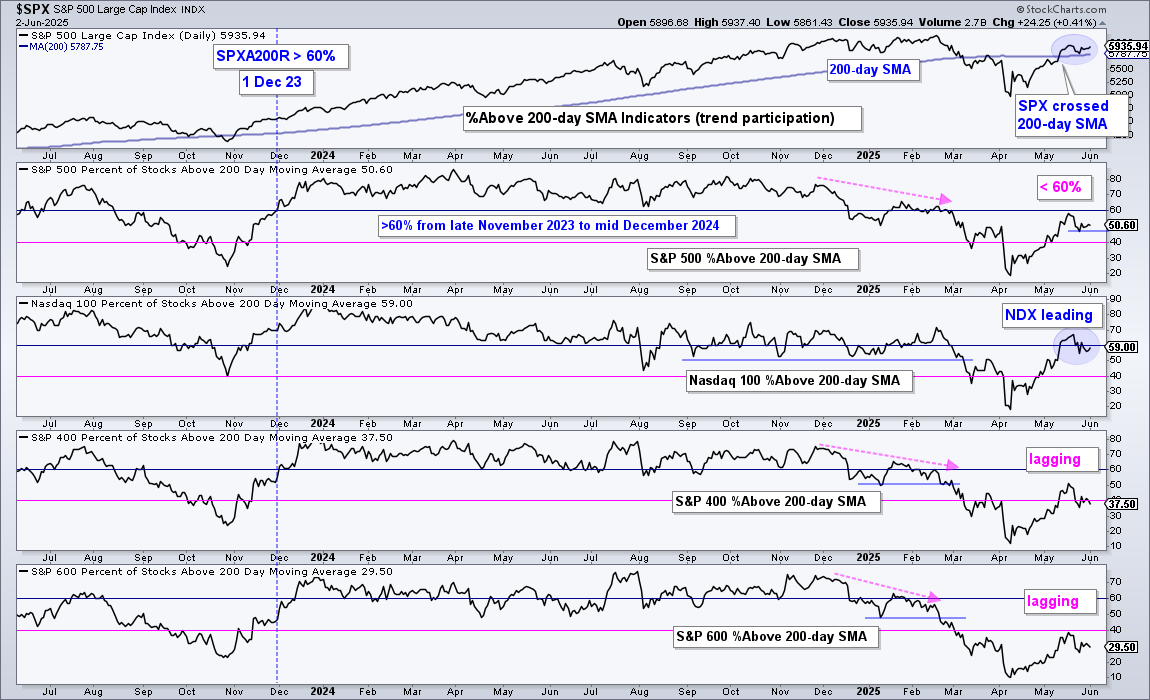
The Composite Breadth Model (CBM) hit its make or break point in mid August and broke as SPY fell 3.4% the last two days. This was the largest two day decline since mid June. The breadth inputs within the CBM remain split with the S&P 500 and S&P 1500 Thrust Models bullish, the S&P 500 and S&P 1500 Trend Models bearish. The S&P 500 5/200 cross remains bearish and this means the model has remained bearish (-1). The 5-day SMA for the S&P 500 is currently 1.68% below the 200-day. Also note that less than 40% of S&P 500 stocks are above their 200-day SMAs (bottom window).

Short-term Breadth Indicators Trigger Bearish (SPX, NDX)

The percentage of stocks above the 20-day SMA for the S&P 500 and Nasdaq 100 fell below 60% on Monday to trigger a short-term bearish signal. Both became overbought in late July and remained overbought into mid August. The red arrows on the price chart and red shading on SPX %Above 20-day SMA show the current signal and prior signals.

The next chart shows the same for NDX %Above 20-day SMA. These signals suggest that the short-term uptrend has reversed and we are now in a short-term downtrend. Note that the long-term trend was down and remains down. This means the new short-term downtrend is signaling a continuation of the bigger downtrend.

SPY Fails at Falling 200-day SMA (plus QQQ and IWM)

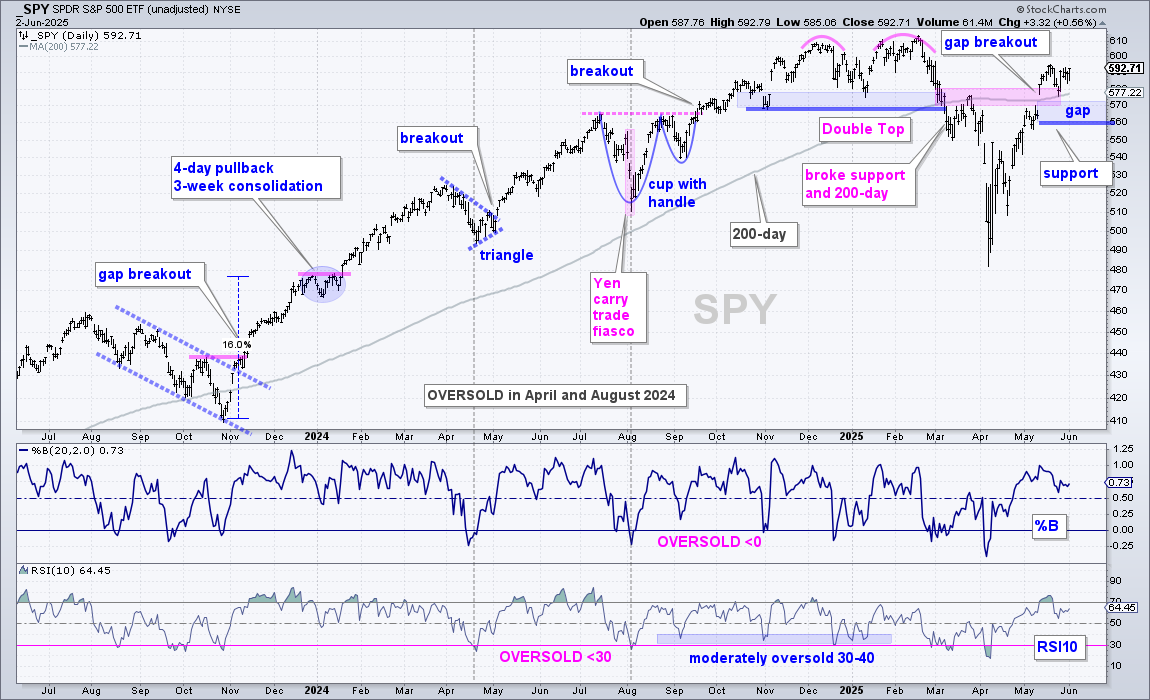
The S&P 500 SPDR (SPY) surged to its falling 200-day SMA and reversed with a sharp decline on Friday and a gap-plunge on Monday. The gap is a breakaway gap and the sharp decline marks a clear failure at the 200-day. This reversal also occurred near the 66.7% retracement line, which means SPY retraced around 2/3 of the March-June decline. Think of this retracement as two steps up after three steps down. The downtrend continues as long as there are more down steps than up steps. Thus, while the July-August surge was strong when viewed on its own, it was still a counter trend bounce when looking at the bigger picture.

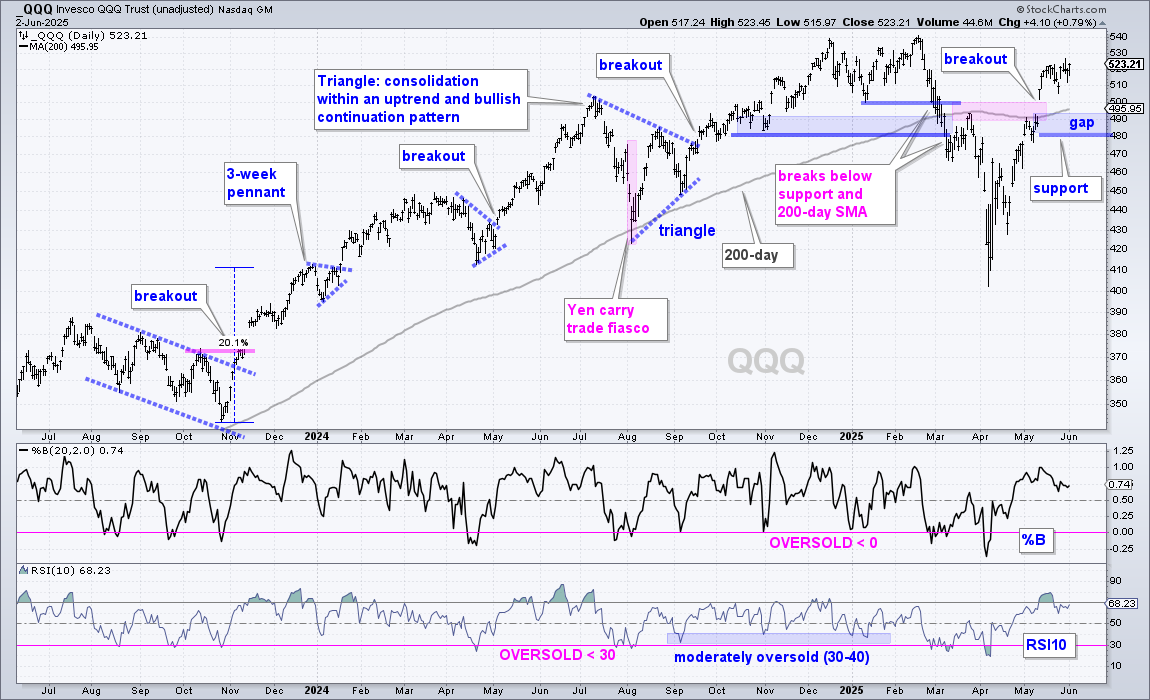
The next chart shows QQQ reversing near the Dow-Fibo retracements with a sharp decline the last four days and a gap-plunge on Monday. This advance was a counter-trend bounce within a bigger downtrend and the counter-trend bounce has not reversed. Note that the Trend Composite remains negative.

The Russell 2000 ETF (IWM) was the only one of the big three with a positive Trend Composite* (+1). Despite this “uptrend” signal, the odds were stacked against IWM because the Composite Breadth Model was bearish, SPY was in a long-term downtrend and QQQ was in a long-term downtrend. Hence, the asterisk. IWM exceeded the 67% retracement and closed above the falling 200-day SMA for three days. Despite relative strength in small-caps, the broader market environment dominates and IWM ultimately failed at the falling 200-day SMA.

Junk Bonds, C-Discretionary and Semis Reverse Upswings

We can see the fear in the market with the plunge in the Junk Bond ETF (JNK). The ETF is down four of the last five days and broke short-term support with a sharp decline on Friday. This declined extended into Monday as junk bonds fell along with stocks. Junk bonds represent the risk-on trade because these are the riskiest bonds. They have the highest yields, they are dependent on a strong economy and they have the highest chances of default. Money moving out of junk bonds shows risk aversion in the financial markets. Note that the long-term trend was already down and the bounce into mid August was viewed as a counter-trend move. This bounce has reversed and the long-term downtrend is taking over again (risk-off).

The next chart shows the EW Consumer Discretionary ETF (RCD) reversing after retracing around 2/3 of the prior advance. Again, the long-term trend was already down and RCD was well below the falling 200-day SMA. The reversal here signals that the counter-trend bounce has ended and the long-term downtrend is continuing. Note that the Consumer Discretionary sector includes housing and retail, which are key to the economy.

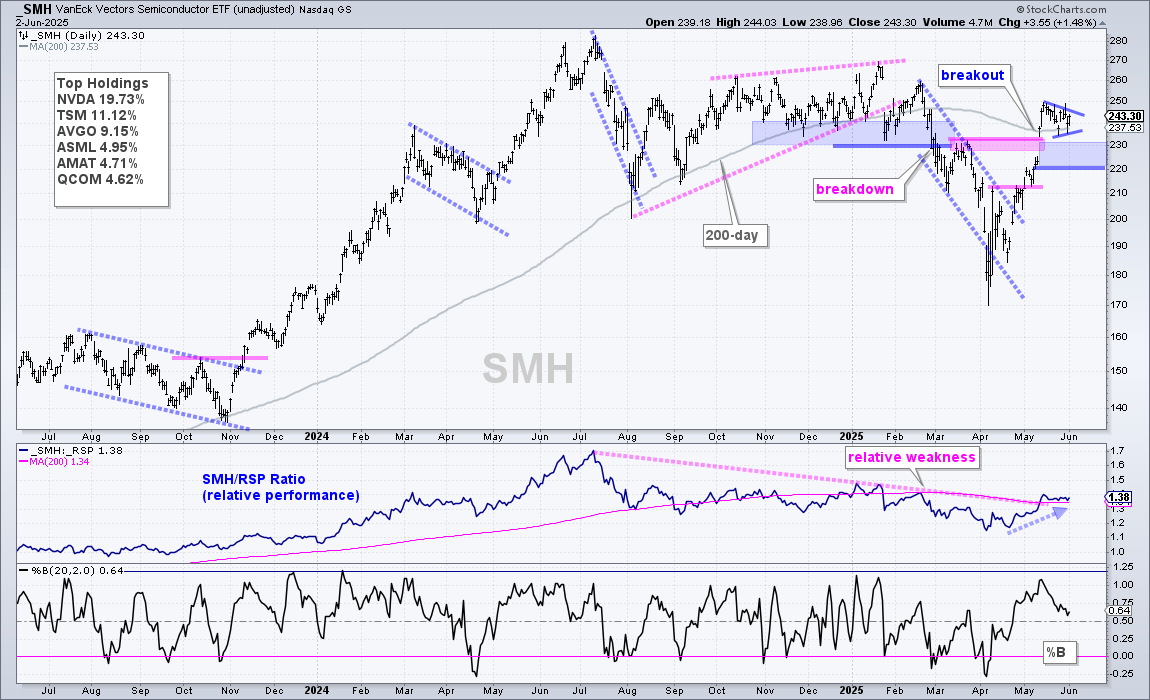
The next chart shows the Semiconductor ETF (SOXX) hitting resistance in  the 420 area twice in August and falling sharply the last two days. On a closing basis, SOXX closed below the early August low and the short-term uptrend has reversed. Notice that this reversal occurred in the 50-67% retracement zone and well below the falling 200-day SMA. Semis are an important part of the tech sector, the semiconductor business is cyclical and this breakdown bodes ill for the biggest sector in the stock market.

Big Sectors Reverse Near 200-day SMAs (XLK, XLY, XLF)

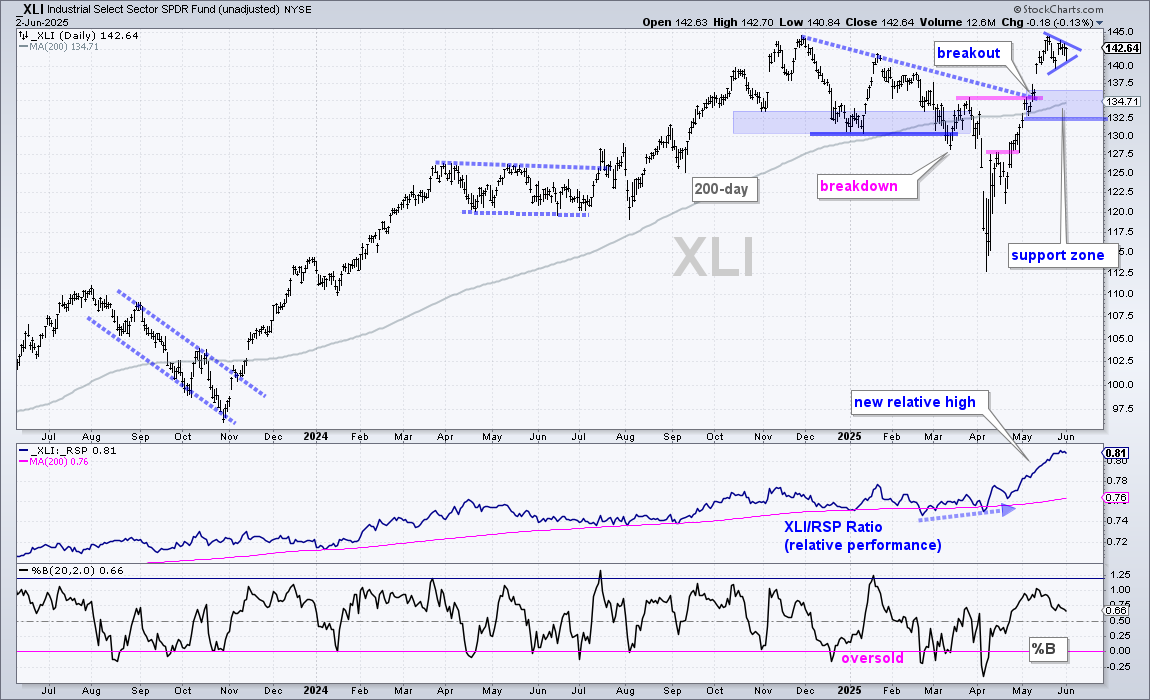
Elsewhere, the Technology SPDR (XLK) and Consumer Discretionary SPDR (XLY) failed at their falling 200-day SMAs. The Industrials SPDR (XLI) exceeded the 200-day for a few days and then plunged. The Finance SPDR (XLF) fell well short of the falling 200-day SMA and turned sharply lower. All four are in downtrends overall and these reversals near the 200-day bode ill for the broader market.

You can learn more about the ATR Trailing Stop and exit strategies in this post,
which includes a video and charting options for everyone.

Tech-Based ETFs Fail to Hold Breakouts (IGV, CIBR)

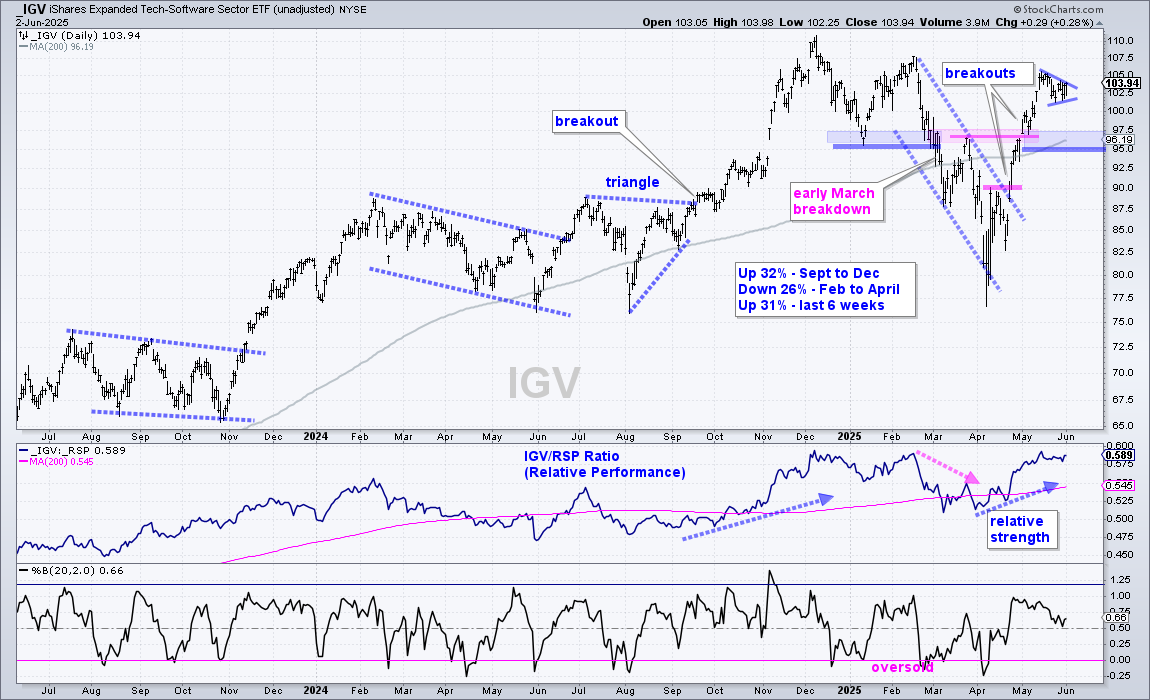
The Cloud Computing ETF (SKYY), Internet ETF (FDN) and Software ETF (IGV) broke above their May highs in early August, but fell back below these breakout zones with sharp declines over the last few days.  The Trend Composites were already negative and these breakouts failed to hold. The Cybersecurity ETF (CIBR) is currently testing its breakout zone and holding up better than the others.

NatGas Hits New High as Oil Strengthens (NG1!, CL1!, DBE)

The next chart shows Natural Gas Futures (NG1!) breaking out to a new high. Overall, the big wedge into early July is the cup and the small wedge into early August is the handle. The break above rim resistance is bullish. Keep in mind that natty is VERY volatile and known as the widow maker in the commodity markets.

The other chart shows Light Crude Futures (CL1!) with a long falling wedge into August and a break above the upper line working. The early August high marks resistance at 95 and a break above this level would fully reverse the downtrend. Note that oil held up very well when stocks plunged the last four days.

The next chart shows the DB Energy ETF (DBE) bouncing off support in the 24 area the two weeks and breaking the 10-Aug high (red line). Overall, DBE hit a new high in June, retraced around 2/3 of the March-June advance and then firmed in the 24 area. It looks like the correction is ending and the bigger uptrend is resuming.  

Energy ETF Update (XLE, XOP, FCG, AMLP, XES, PSCE)

There is no change in the energy-based ETFs as they edged higher the last few days. The Energy SPDR (XLE), Oil & Gas Exploration & Production ETF (XOP) and Natural Gas ETF (FCG) are extending on their wedge breakouts from mid July and remain well above their ATR Trailing Stops. The wedges are viewed as corrections within a bigger uptrend and the breakouts signaled a continuation of these uptrends.

The next charts show the MLP ETF (AMLP), Oil & Gas Equipment & Services ETF (XES) and Small-cap Energy ETF (PSCE) with pennants forming after sharp advances in late July. These advances broke short-term resistance (red lines) and these breakouts held. AMLP and PSCE broke out of these pennants, while XES challenged the pennant highs last week. Pennants after an advance are short-term bullish continuation patterns and breakouts are bullish. The pennant lows (green lines) mark support to watch going forward.

You can learn more about my chart strategy in this article covering the different timeframes, chart settings, StochClose, RSI and StochRSI.

Clean Energy ETF Update (TAN, ICLN)

The Solar Energy ETF (TAN) and Global Clean Energy ETF (ICLN) fell back with the rest of the market, which proves that correlations rise as declines in the major indexes deepen. TAN and ICLN are still part of the stock market. The first chart shows TAN with the Trend Composite turning positive in early July and the ETF breaking out of a triangle with a gap-surge in late July. This is the trend-following signal and the ATR Trailing Stop remains at 76.93.

The Global Clean Energy ETF (ICLN) fell sharply over the past week and triggered the tight ATR Trailing Stop, which was 2 ATR(22) values below the highest close since the mid June breakout (short red line). The wider trend-following stop is at 19.58 and just below a possible support zone (blue shading). ICLN broke out with a surge and the breakout zone turns first support to watch on a throwback.

The Trend Composite and ATR Trailing Stop are part of the
TIP Indicator Edge Plugin for StockCharts ACP

Biotech ETF Update (XBI, IBB)

The Biotech SPDR (XBI) and Biotech ETF (IBB) also fell back with the rest of the market over the past week. Both hit resistance from the February-April highs and fell rather sharply the last five days. They triggered the tight ATR Trailing Stop (short red line), but remain well above their trend-following stops, which offer more wiggle room.

I do not want to get too far ahead here, but these two could trace out big inverse head-and-shoulders patterns. The blue dashed lines mark the left shoulder, the May-June lows mark the head and the right shoulder could form into September-October. Thus, a dip into the 120 area for IBB or 80 area for XBI may provide a setup in the future. We will cross that bridge when and if it gets here.

Agriculture ETFs Buck the Stock Market (DBA, WEAT, JO)

The DB Agriculture ETF (DBA) ignored the stock market and bounced the last two days. Overall, DBA hit a new high in May, retraced 2/3 of the July-May advance and firmed in the 19.50 area in July. The ETF broke short-term resistance in mid August and the early August low marks first support (green line). The 4 x ATR(22) trailing stop is just below.

The Wheat ETF (WEAT) fell last week and then bounced the last two days. Notice that the ETF touched the lower trendline of a rising channel that was in place before Putin invaded Ukraine. This is an area to watch for a reversal and short-term breakout. Resistance is set at 8.5 and a close above this level would be short-term bullish.

The Coffee ETF (JO) perked up on Monday with a 3.3% surge to keep the short-term breakout alive. Short-term, there is a surge in mid July, a small Ascending Triangle and a breakout working. Longer term, JO remains within a long falling channel, but this channel looks like a correction after the 70% advance. Support is set at 56 and the ATR Trailing Stop is at 56.27. A close below 56 would argue for a re-evaluation.

Palladium ETF Falls Along with Stocks (PALL)

The Palladium ETF (PALL) did not buck the stock market and fell sharply the last seven days. This positive correlation with stocks is potentially negative so I will be watching closely. Overall, PALL broke out in early July and I then placed the ATR Trailing Stop (5 x ATR(22)) to match the June low. This stop rose as PALL advance into mid August and is currently at 177.31. A close below this level would call for a re-evaluation.

Previous Commentary

The commentary (here) on Thursday, August 11th, covered the following:

  • Inflation and Stocks
  • TLT Breaks Down as 10yr T-Yield Breaks Out
  • Dollar Breaks Out Along with T-Yield
  • SPY and QQQ Hit Dow-Fibo Retracements
  • Seasonal Tendency for September is Negative
  • %Above 20-day SMA for SPY and QQQ
  • Watching Junk Bonds, Housing and Semis for Clues
  • NatGas Forms Bullish Pattern as Oil Forms Falling Wedge
  • Small-cap Energy ETF Forms Pennant (PSCE)
  • Tech ETFs Hold Breakouts, but Underperform (SKYY, CIBR, IGV, FDN)
  • Short-term Uptrends in Base-Metals ETFs (DBB, CPER, COPX)

You can learn more about my chart strategy in this article covering the different timeframes, chart settings, StochClose, RSI and StochRSI.

Thanks for tuning in and have a great day!

Market and ETF Report – SPY Hits Another Make or Break Area, Short-term Uptrends Rule until Reversed, September Seasonality (Premium)

The short-term uptrends are dominating the landscape, or at least this seems to be the case. SPY is below its falling 200-day SMA, but is up some 16% from its mid June low. It is a strong move that has yet to be reversed. In fact, there are dozens of ETFs with similar characteristics:

Market and ETF Report – SPY Hits Another Make or Break Area, Short-term Uptrends Rule until Reversed, September Seasonality (Premium) Read More »

Market/ETF Video – Composite Breadth Model hits Make or Break Point, Bonds Break Down, More Sectors in Downtrends than Uptrends  (Premium)

The thrust that began in mid July extended into mid August and triggered bullish signals in the Thrust Breadth Models. The Trend Models, however, remain bearish, as does the 5/200 day SMA cross for the S&P 500. At best, the market is split and more work is needed to turn bullish. At worst, the market is overbought

Market/ETF Video – Composite Breadth Model hits Make or Break Point, Bonds Break Down, More Sectors in Downtrends than Uptrends  (Premium) Read More »

Market and ETF Report – Stocks Surge, but Bonds Fall, Overbought and Staying Overbought, Trend Composite Settings (Premium)

Stocks surged on reports that inflation was less than expected. Bonds did not. This is interesting because bonds are supposed to be more vulnerable to inflationary pressures. The news, however, is just the reported news we can never be sure of the true reasons for the price moves.

Market and ETF Report – Stocks Surge, but Bonds Fall, Overbought and Staying Overbought, Trend Composite Settings (Premium) Read More »

Market/ETF Video – Keys to Short-term Advance, Biotech and Clean Energy Breakouts, Wheat and Agriculture Firm (Premium)

The Composite Breadth Model remains bearish and SPY is in a long-term downtrend, but the short-term trend is up and has yet to reverse. Today’s video will mark some short-term support levels to watch for a few key ETFs and the line-in-the-sand for a short-term breadth indicator. We are seeing sharp counter-trend bounces in a

Market/ETF Video – Keys to Short-term Advance, Biotech and Clean Energy Breakouts, Wheat and Agriculture Firm (Premium) Read More »

Market and ETF Report – Resistance-Reversal Zones in Play, More Trend Composite Signals, Stops with Loose Pants (Premium)

We are seeing more bullish Trend Composite signals, but the weight of the evidence remains bearish for stocks. Of the 274 ETFs in the master list, there are 22 ETFs (13%) with positive Trend Composites (uptrends) and 152 (87%) with downtrends. The uptrend signals are

Market and ETF Report – Resistance-Reversal Zones in Play, More Trend Composite Signals, Stops with Loose Pants (Premium) Read More »

Market and ETF Report – Short-term Breadth Indicators for Thrust and Overbought Conditions, Tech ETFs Break May Highs, JO Intrigues Again (Premium)

Today’s report starts with some short-term breadth indicators. One of the three triggered a bullish breadth thrust, but the other two have yet to show the upside participation needed for a thrust signal. They have yet to cross that line and are actually looking short-term

Market and ETF Report – Short-term Breadth Indicators for Thrust and Overbought Conditions, Tech ETFs Break May Highs, JO Intrigues Again (Premium) Read More »

Market/ETF Video – Resistance Reversal Zones are Nigh, Oils Tests Support, TLT Forms Bearish Pattern, Working with ATR Trailing Stops (Premium)

Stocks surged in July and this surge was enough to trigger a bullish breadth thrust in the S&P 500. However, we have seen this movie before with bullish breadth thrusts that failed in late March and late May. The Composite Breadth Model needs more than just a bullish breadth thrust to turn the corner. Elsewhere, yield spreads

Market/ETF Video – Resistance Reversal Zones are Nigh, Oils Tests Support, TLT Forms Bearish Pattern, Working with ATR Trailing Stops (Premium) Read More »

Market and ETF Report – Bear Market with Slim Pickings, Running into Resistance-Reversal Zone, Palladium Shines (Premium)

Despite a big advance in June, the Market Regime remains bearish and risk is above average for stock-based ETFs. In addition, the Trend Composite is negative for the vast majority of stock-based ETFs. A few ETFs related to clean energy, fossil fuels, consumer staples,

Market and ETF Report – Bear Market with Slim Pickings, Running into Resistance-Reversal Zone, Palladium Shines (Premium) Read More »

Market/ETF Video – Widespread Weakness in Stocks, Downtrends in Metals and Agriculture Extend, Oil Tests Spring Lows (Premium)

The Composite Breadth Model remains in bear mode, yield spreads show stress in the bond market and the major index ETFs are in downtrends. Other groups are not picking up the slack because most precious metals, industrial

Market/ETF Video – Widespread Weakness in Stocks, Downtrends in Metals and Agriculture Extend, Oil Tests Spring Lows (Premium) Read More »

Market and ETF Report – SPY Consolidates within Downtrend, Oil in Downswing, Defensive ETFs Holding Up the Best, PALL Breaks (Premium)

Stocks became oversold after a sharp decline in June and the bounced to varying degrees. Some of these bounces were quite sharp (ITB, IBB) and some ETFs simply consolidated (SPY, KRE). Almost all ETFs are in downtrends and this means the bounces are considered counter-trend

Market and ETF Report – SPY Consolidates within Downtrend, Oil in Downswing, Defensive ETFs Holding Up the Best, PALL Breaks (Premium) Read More »

Market and ETF Report – Oversold Bounces, Oil Swings Lower, Healthcare Shows Relative Strength, Biotechs Get Extended (Premium)

After becoming very oversold in mid June, the major index ETFs are in the midst of oversold bounces or consolidations over the last three weeks. Predicting the extend of a bounce is tricky, but the current bounce since mid

Market and ETF Report – Oversold Bounces, Oil Swings Lower, Healthcare Shows Relative Strength, Biotechs Get Extended (Premium) Read More »

Market/ETF Video – Oil Succumbs to Widespread Weakness, Dollar Leads, Bonds Bounce, ETFs Showing Relative Strength by Holding Up Better (Premium)

Cracks in the stock market began to appear in the second half of 2021 and spread to large-caps in early 2022. Defensive groups within the stock market were holding up, but got hit hard in June. Industrial metals and agricultural commodities were holding

Market/ETF Video – Oil Succumbs to Widespread Weakness, Dollar Leads, Bonds Bounce, ETFs Showing Relative Strength by Holding Up Better (Premium) Read More »

Market and ETF Report – A Sea of Red, Energy ETFs Tests Support, Healthcare/Biotech Show Relative Strength (Premium)

My screen for today’s price action is a sea of red right now. Stock futures are modestly lower, energy futures are lower, gold is slightly lower, industrial metals are sharply lower and agricultural commodities are sharply lower. The US Dollar Index is the only thing higher and it is trading at a new high

Market and ETF Report – A Sea of Red, Energy ETFs Tests Support, Healthcare/Biotech Show Relative Strength (Premium) Read More »

Market and ETF Report – Two Trends and Two Conditions, Best versus Worst, XLE is the Most Volatile Sector, GOLD has Low Volatility, but….(Premium)

Today’s report to put trend and volatility together so we can identify the best conditions, the worst conditions and the questionable conditions. Most of us know that current conditions are the worst for stocks because we are in a bear market with high volatility. We will chart volatility to show when it is deemed high and

Market and ETF Report – Two Trends and Two Conditions, Best versus Worst, XLE is the Most Volatile Sector, GOLD has Low Volatility, but….(Premium) Read More »

Market/ETF Video – Widespread Weakness, Oil Holds Up as NatGas Hits Support-Reversal Zone, Dollar Remains Strong, Industrial Metals Sink (Premium)

Weakness is widespread throughout the stock market, and other markets. The Composite Breadth Model is and remains bearish. fewer than 20% of S&P 1500 stocks are above their 200-day SMAs and yield spreads show stress in the credit markets. Almost all stock-based ETFs are in downtrends and most of the alternative ETFs are also in downtrends (bonds, gold, silver, the

Market/ETF Video – Widespread Weakness, Oil Holds Up as NatGas Hits Support-Reversal Zone, Dollar Remains Strong, Industrial Metals Sink (Premium) Read More »

Market and ETF Report – Counter-Trend Bounce in SPY, Oil Hits Reversal Zone, XES Overshoots, Wheat Weights on Agriculture ETF (Premium)

Stocks bounced the last five days, but these bounces are considered counter-trend moves within bigger downtrends. One of these counter-trend moves will result in a trend reversal, but this is not the case yet because the weight of the evidence remains bearish for stocks. The first indicator window below shows

Market and ETF Report – Counter-Trend Bounce in SPY, Oil Hits Reversal Zone, XES Overshoots, Wheat Weights on Agriculture ETF (Premium) Read More »

Market and ETF Report – A Brutal Year and Month, Three ETFs Stand Out, Short-term Island Reversal Takes Hold (Premium)

As noted in Tuesday’s report and in Wednesday’s video, the majority of ETFs in the Master List (274) are in downtrends. There are a few groups holding up, but even energy and agriculture were hit with selling pressure here in June. Mr Market is dazed, confused

Market and ETF Report – A Brutal Year and Month, Three ETFs Stand Out, Short-term Island Reversal Takes Hold (Premium) Read More »

Market/ETF Video – Stocks are Oversold within Strong Downtrends, Downside Participation is High, Ag, Energy and Dollar are Standouts  (Premium)

The major index ETFs and big sector SPDRs extended their downtrends and recorded fresh 52-week lows over the last few days. New lows were also seen in most tech and consumer discretionary ETFs. The Composite Breadth Model reflects the broadness of downside participation and widening yield

Market/ETF Video – Stocks are Oversold within Strong Downtrends, Downside Participation is High, Ag, Energy and Dollar are Standouts  (Premium) Read More »

Scroll to Top