Market-ETF Report – Large Techs Lead – Pennants/Flags Abound – XLU-XLP-KIE Set Up
Posted By
Arthur Hill, CMT
On
In
Archive |
No Comments
The next report will be on Wednesday, June 4th
Report Headlines
SPY and QQQ Hold Gaps
Performance Weakens Under the Surface
Watch MDY for Signs of Broadening
Crypto and Commodity Related ETFs Leading
Pennants, Flags, Overbought, Whipsaw and Support
Pennants and Flags in Tech-Related ETFs
XLI Forms Pennant Near Prior High
Utilities SPDR Extends on Breakout
Consumer Staples SPDR Breaks Wedge Line
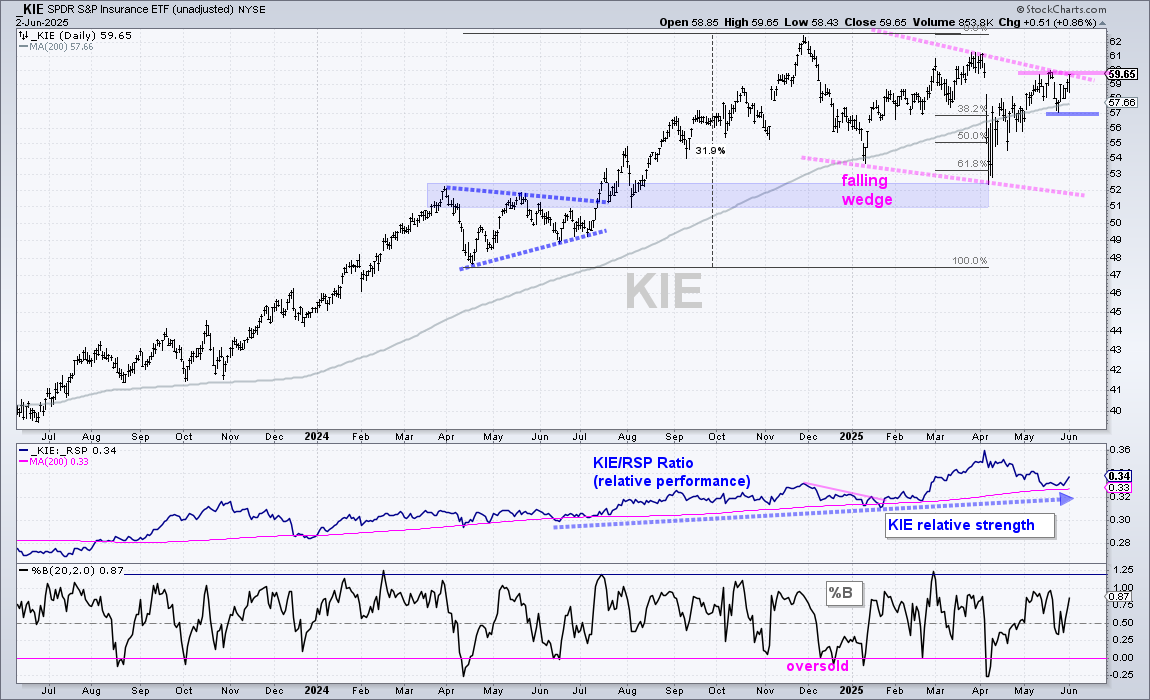
Insurance ETF Setting Up
Stocks Extend on Thrust Signals
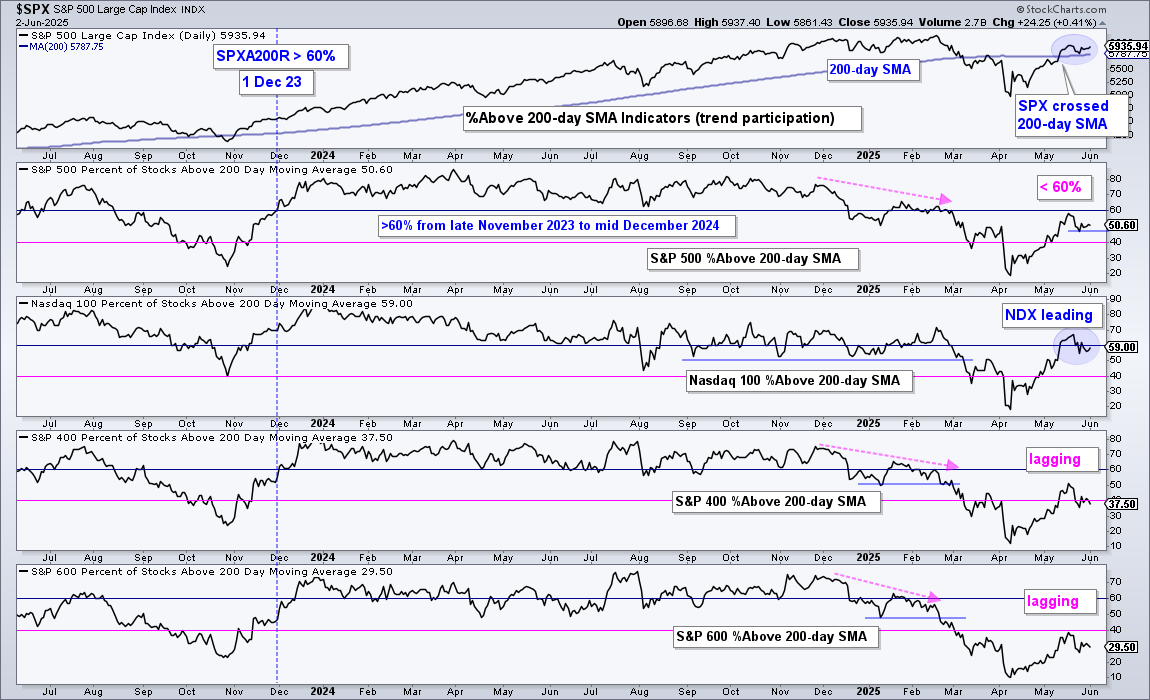
Even though small-caps and mid-caps are dragging their feet, Nasdaq 100 stocks are leading with the highest percentage above their 200-day SMAs. This is a positive sign for large-cap stocks and stocks in the Technology sector. In addition, SPY and QQQ are holding their May 12th breakouts and 200-day SMA. Again, this is positive for large-caps and tech stocks. Small-caps and mid-caps are still struggling. Only 37.5% of mid-caps are above their 200-day SMAs and only 29.5% of small-caps are above this key moving average. This is not a bull market that lifts all boats.
Technical Event Timeline
March 13th – Bearish Long-term Breadth and Trend Indicators
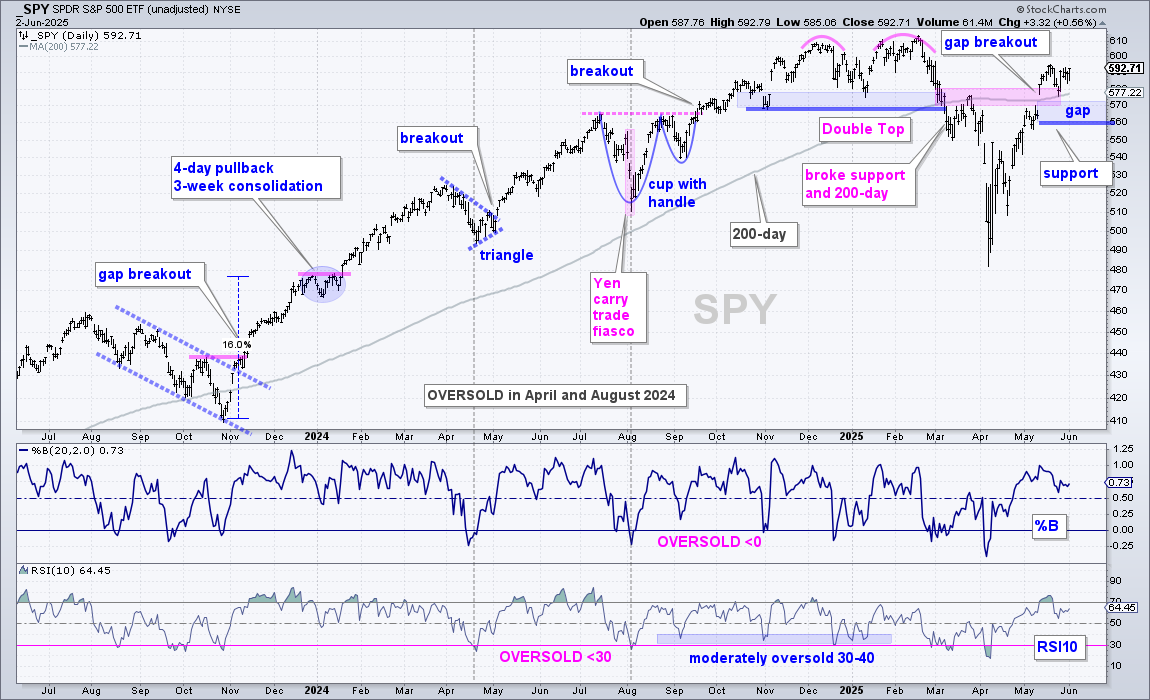
There is no change for SPY and QQQ as they consolidate above their 200-day SMAs. The first chart shows SPY surging in April and breaking out with a gap-surge on May 12th. This was the move that negated the Double Top breakdown and reversed the downtrend. It is important that strong breakout moves hold so I am marking support just below the gap (560). A close below 560 would negate the breakout and put SPY back below the 200-day SMA.
%B and RSI(10) are in neutral areas, which means they are not oversold and setting up. %B needs to dip into the 0-.25 area to become moderately oversold, while RSI needs to dip into the 30-40 area to become moderately oversold.
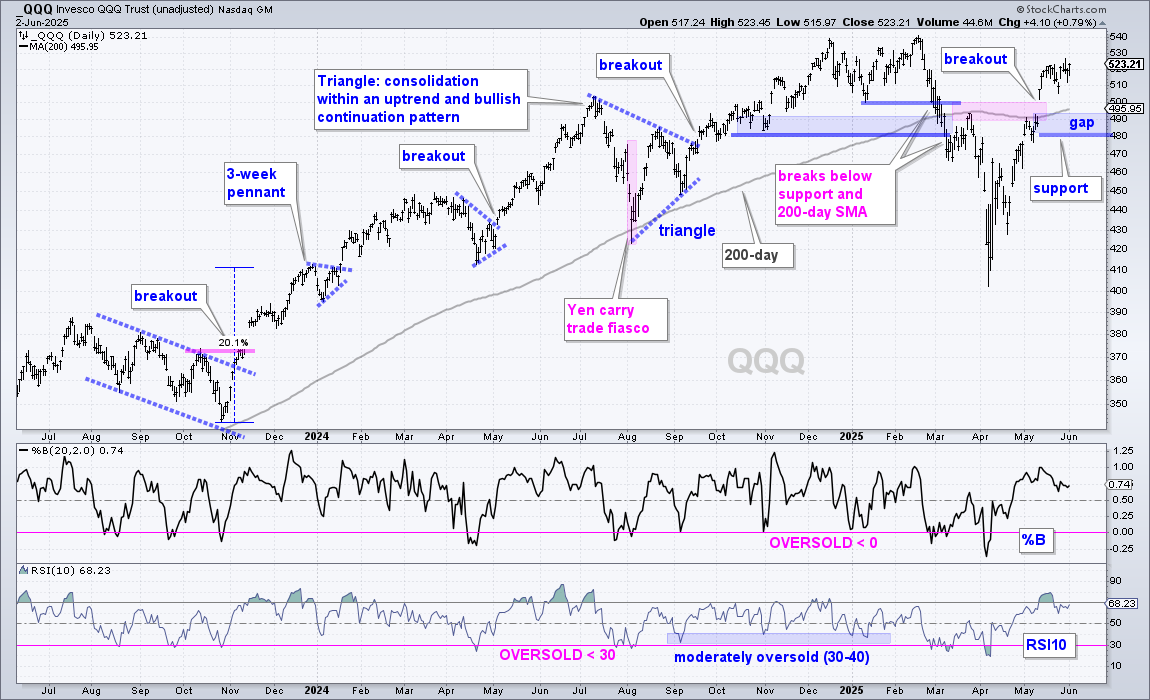
The next chart shows QQQ surging in April and breaking out with a gap on May 12th. As with SPY, this gap-surge negated the March breakdown and reversed the downtrend. QQQ is also above its 200-day SMA, which turned up the last few weeks. This large-cap tech ETF is bullish as long as the gap and 200-day SMA hold. A close below 480 would negate the May 12th breakout and put QQQ back below its 200-day SMA.
Performance Weakens Under the Surface
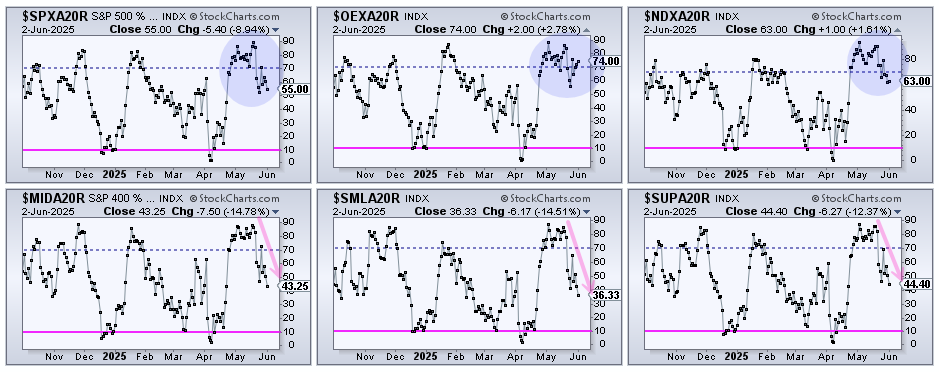
The percentage of stocks above the 20-day SMA is used to identify breadth thrusts and short-term oversold conditions. A thrust occurs with a surge from below 10% to above 70%, which we saw from early April to early May. An oversold condition is present when the indicator dips below 30%. These indicators are not yet oversold. The top three charts show %Above 20-day SMA for the S&P 500, S&P 100 and Nasdaq 100. They are holding up the best with values between 55% (SPX) and 74% (NDX). Nasdaq 100 stocks are the strongest (blue shading).
I am seeing weakness as we dive into mid-caps and small-caps. The bottom row shows the %Above 20-day SMA indicators falling below 45% for the S&P MidCap 400, S&P SmallCap 600 and S&P 1500 (pink arrows). Once again, small-caps and mid-caps are underperforming. Large-caps are doing fine, but small and mid caps are struggling.
Watch MDY for Signs of Broadening
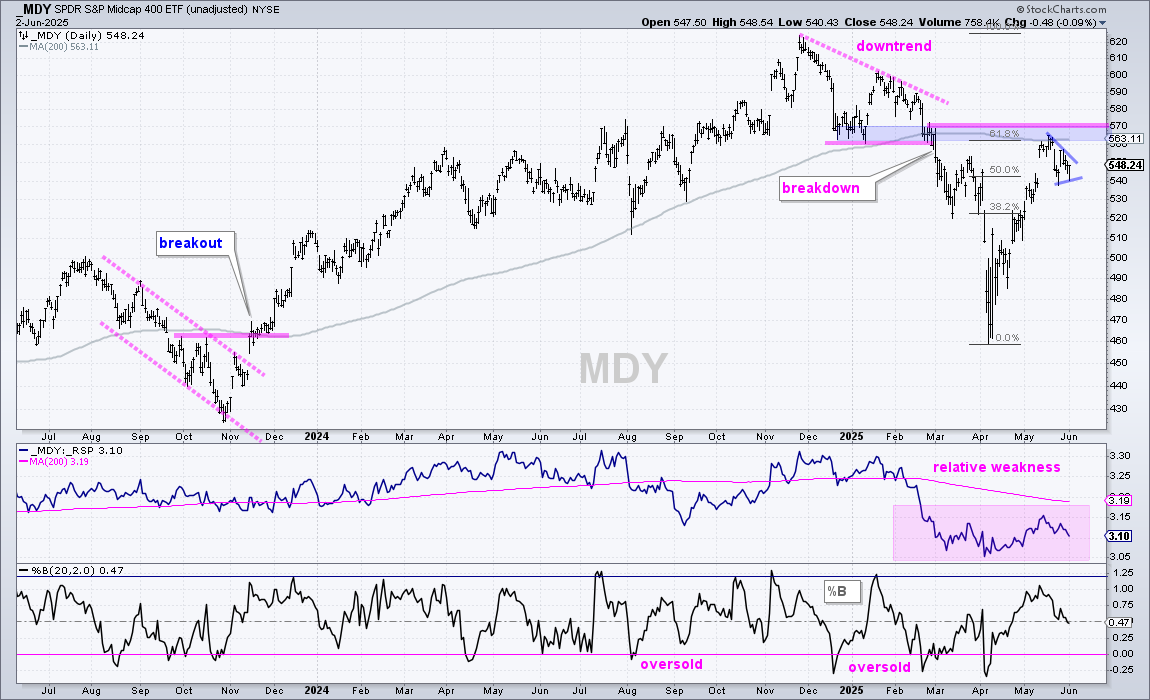
The next chart shows the S&P MidCap 400 SPDR (MDY) peaking in late November, breaking down in early March and advancing back to the break zone in May (blue shading). Broken support turns into resistance and this area also marks a 61.8% retracement of the November-April decline. Thus, the 560-570 area is a bearish setup zone that could give way to a short-term reversal. A break below the late May low would reverse the short-term upswing.
As with many ETFs, MDY surged from early April to mid May and then consolidated. There are lots of pennants and flags out there. MDY could be forming a small pennant and a breakout at 560 would be short-term bullish. Such a move would signal a resurgence in mid-caps and suggest that the rally is broadening.
Crypto and Commodity Related ETFs Leading
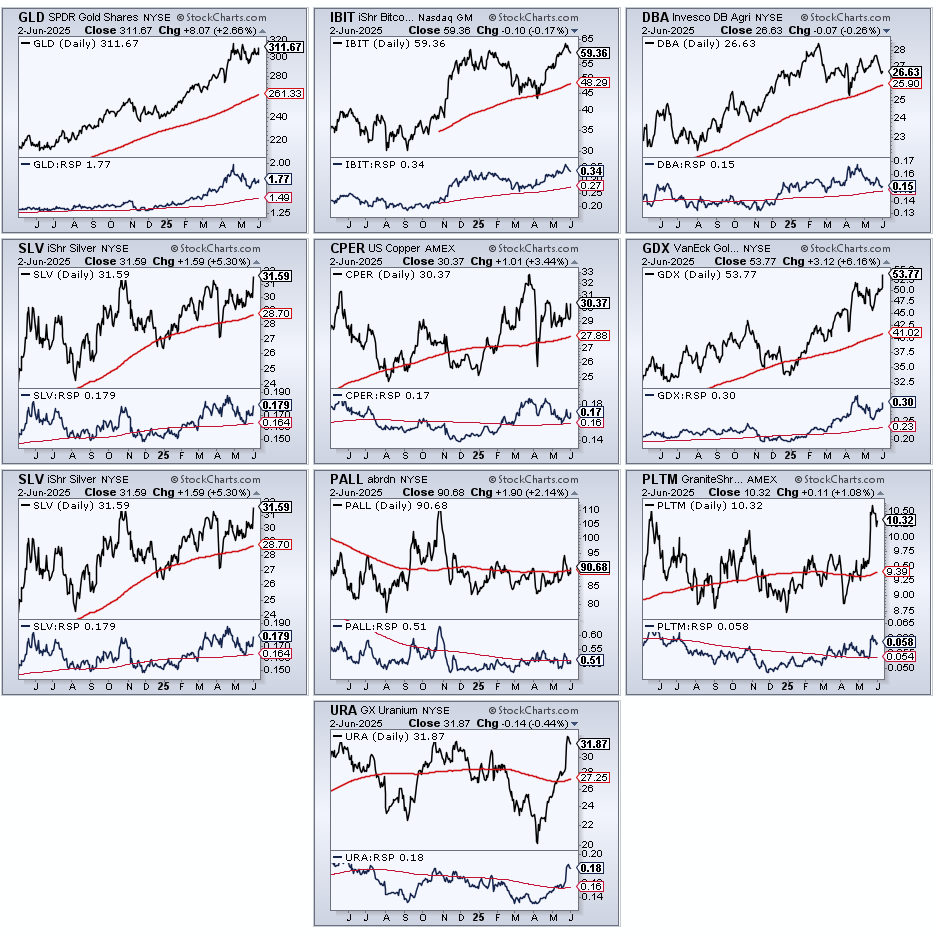
When scanning for the performance leaders, I stick with the 200-day timeframe, which covers around 9 months. Today’s scan shows plenty of commodity-related ETFs leading with the Gold Miners ETF (GDX) and Silver Miners ETF (SIL) hitting new highs this week. The CandleGlance chart shows ten leaders from the commodity and crypto space. These include GLD, IBIT, DBA, SLV, CPER, GDX, SLV, PALL, PLTM, URA.
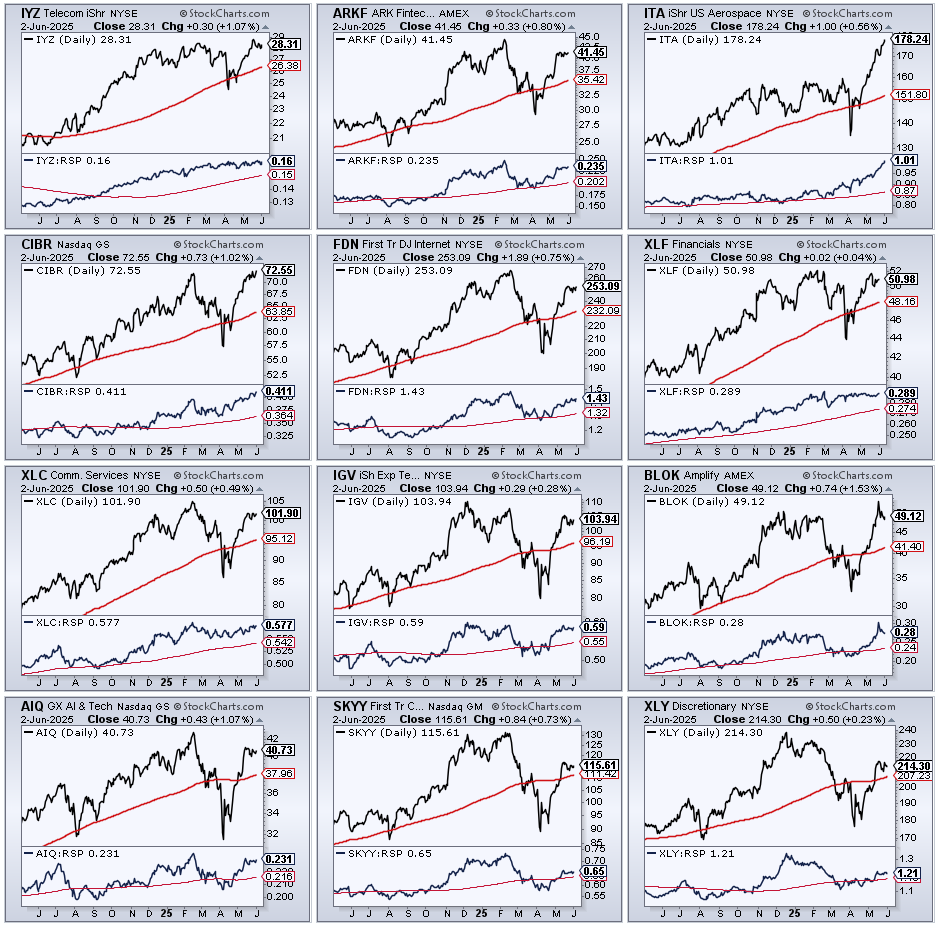
I also singled out a dozen equity ETFs in leading uptrends. Each chart shows a line plot (black line), the 200-day SMA (red line) and the price-relative (IYZ/RSP ratio) in the lower window. Four of these ETFs recorded new highs within the last two weeks: IYZ, ITA, CIBR and BLOK. These leaders include IYZ, ARKF, ITA, CIBR, FDN, XLF, XLC, IGV, BLOK, AIQ, SKYY, XLY.
ETFs that are in leading uptrends and hitting new highs do not always have setups on the price charts. Setups include recent breakouts, pullbacks within the uptrend, bullish continuation patterns or short-term oversold conditions. With leaders, we simply need to observe price action and be patient for the next setup.
Pennants, Flags, Overbought, Whipsaw and Support
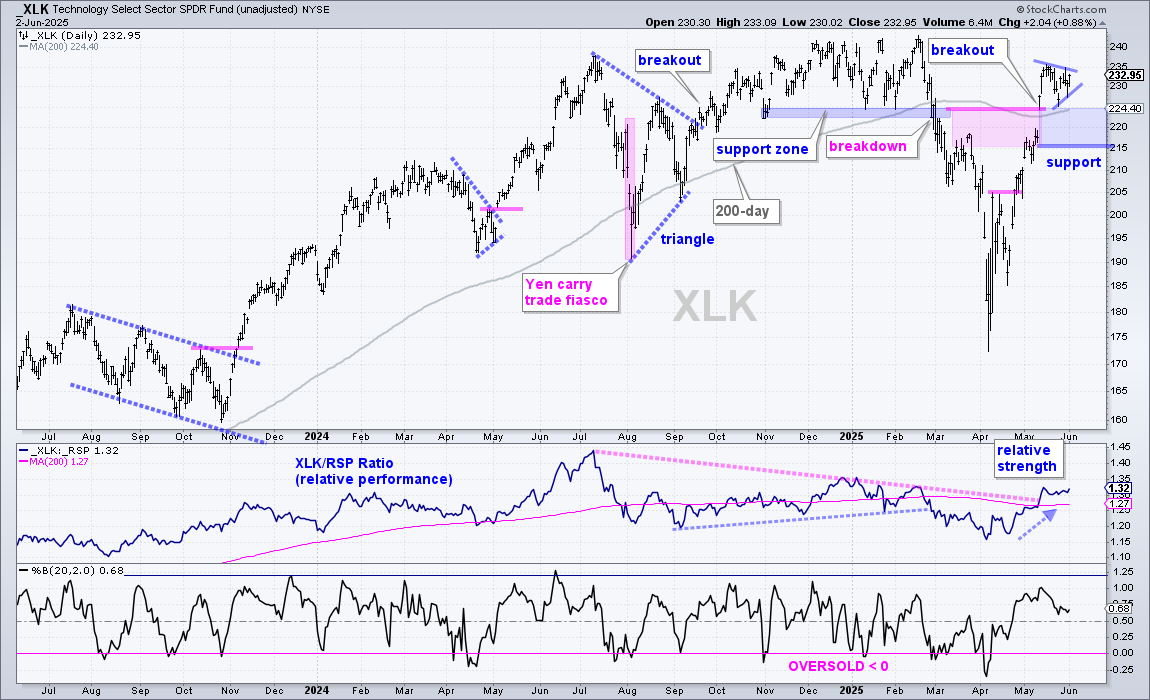
The next chart shows the Technology SPDR (XLK) with a breakout surge into mid May and a consolidation into early June. This breakout is valid as long as the support zone in the 215-225 area holds (blue shading). Short-term, a pennant is taking shape and a breakout at 235 would signal a continuation higher, and open the door to new highs.
Pennants and flags typically extend one to four weeks, which makes them short-term continuation patterns. The shorter the pattern is, the more susceptible it is to noise. Price action is simply more erratic in the short-term. This means there is a higher chance that the breakout will fail and there could be a support test (pullback).
Many ETFs surged 20+ percent from early April to mid May. These surges negated the prior support breaks and reversed the downtrends. These strong advances also created overbought conditions that could lead to a corrective period. Pennants and flags represent short corrections that alleviate overbought conditions.
Should the pennants and flags fail, the support zones are the next areas to watch for a setup. Pullbacks to support zones and oversold readings in %B or RSI would produce mean-reversion setups. In addition, a dip below 30% in SPX %Above 20-day SMA would signal short-term oversold conditions.
Keep these items in mind if trading the flags and the pennants. The key, as always, is to plan your trade ahead of time and then trade that plan. Plan adjustments are fine, but only after the close, when trading has stopped.
Pennants and Flags in Tech-Related ETFs
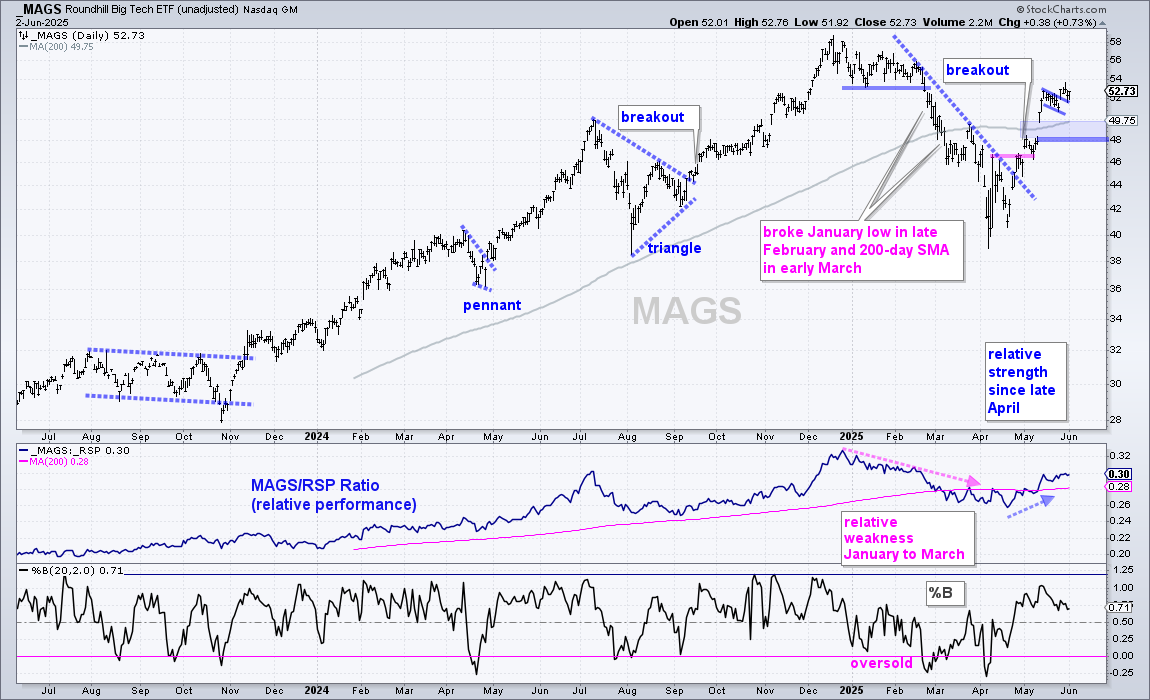
The next chart shows Mag7 ETF (MAGS) with a flag breakout last week and support in the 48-49 area.
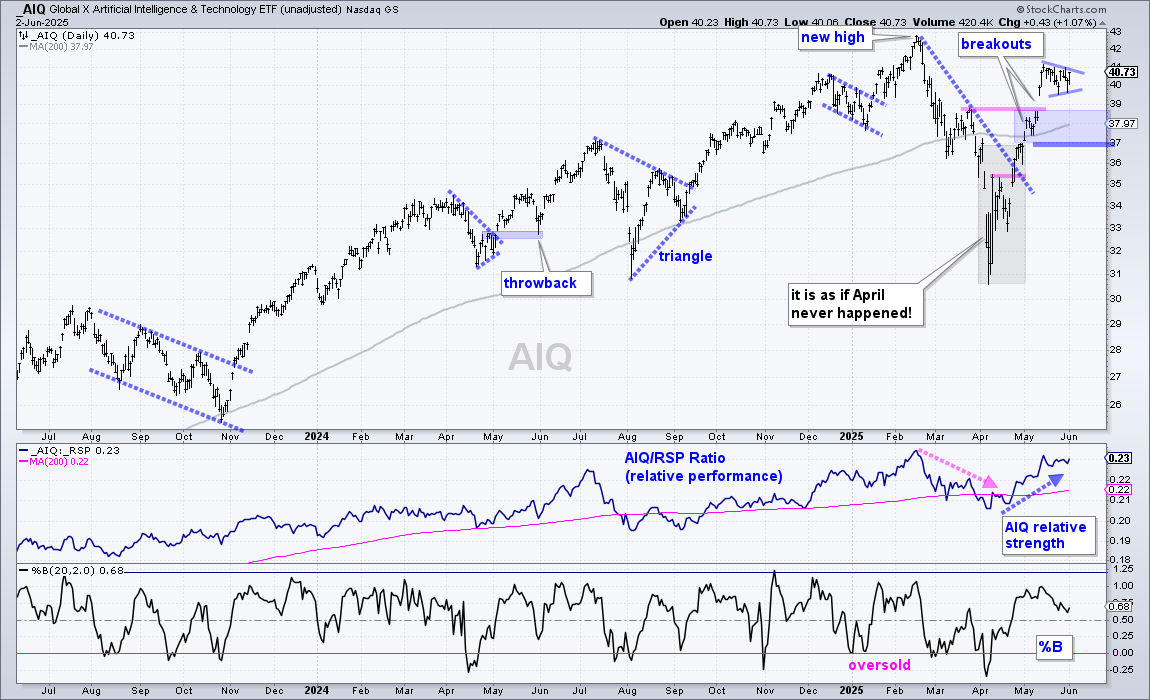
The next chart shows the Global AI & Tech ETF (AIQ) with a pennant forming and support in the 27-28.5 area.
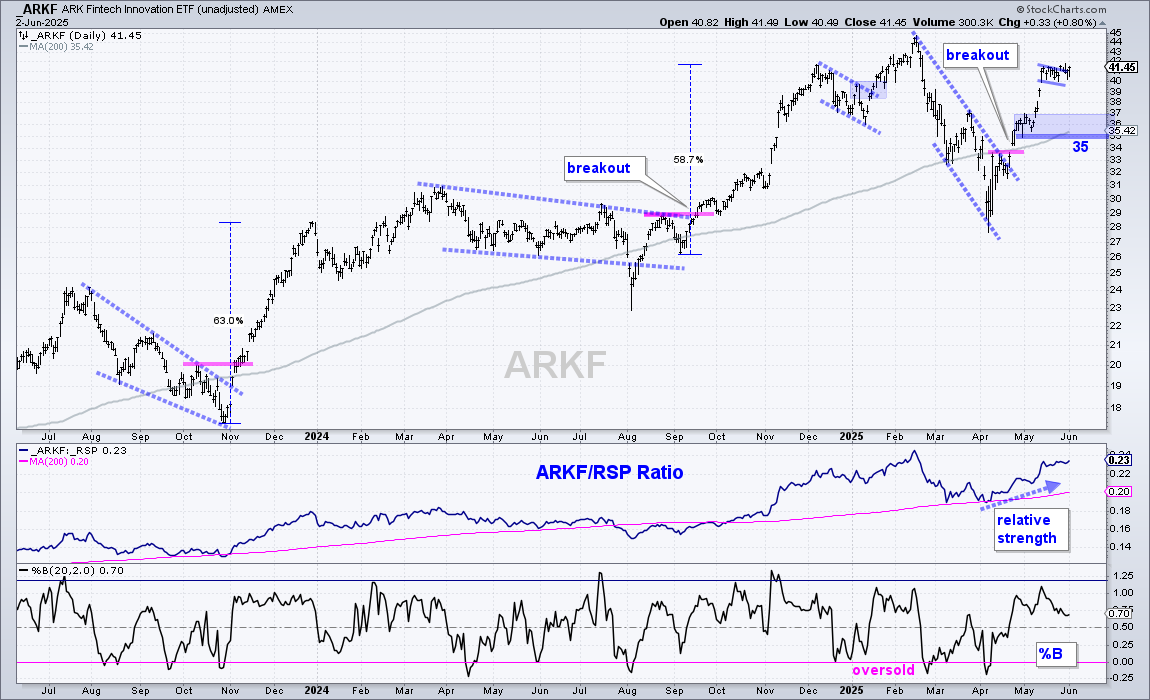
The next chart shows the ARK Fintech Innovation ETF (ARKF) with a high and tight flag. ARKF broke out last week. Support is set at 35.
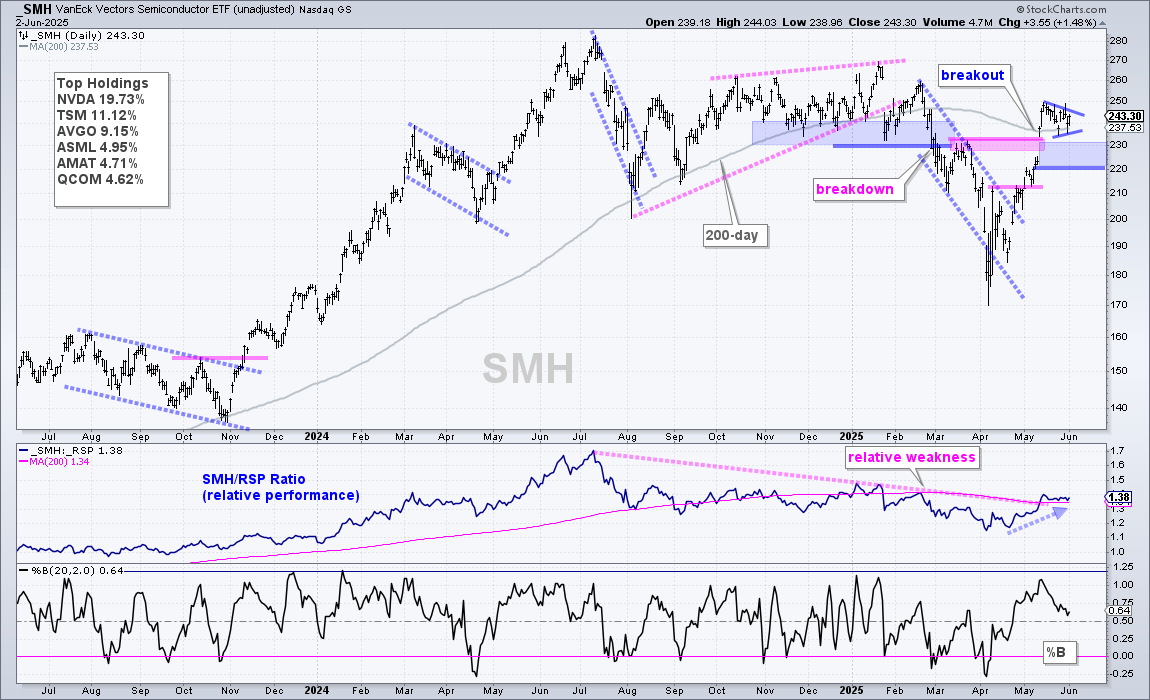
The next chart shows the Semiconductor ETF (SMH) with a breakout in mid May and a pennant into early June. Support is set at 220.
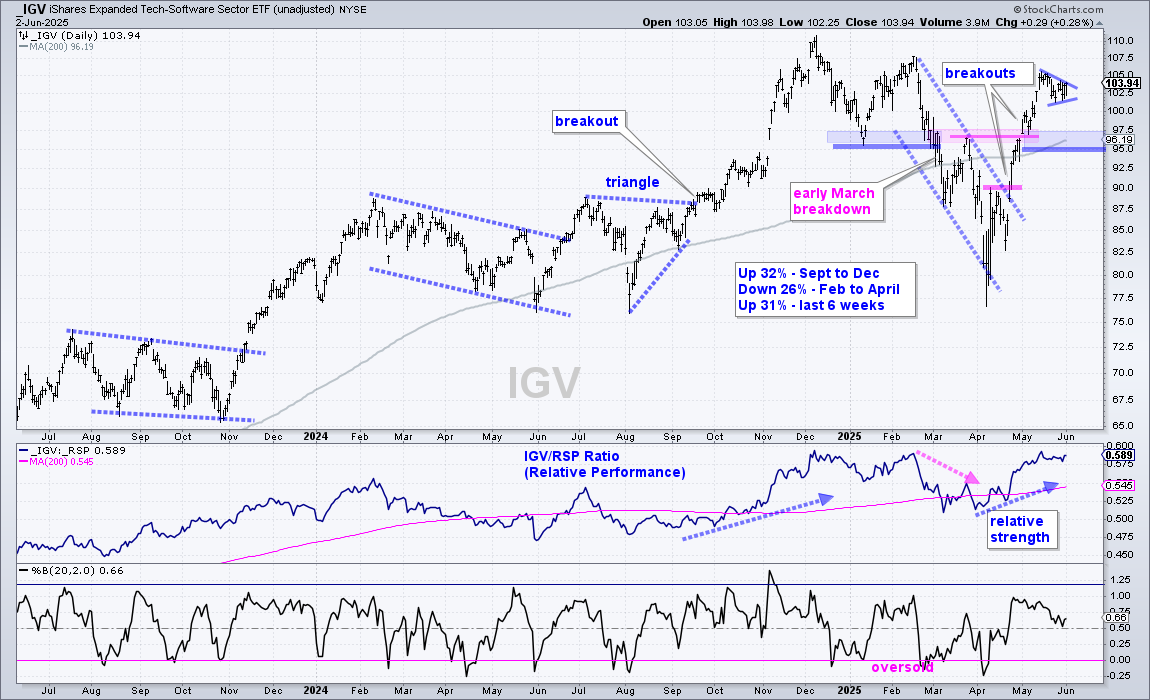
The next chart shows the Software ETF (IGV) with a pennant and a support zone in the 95-97 area.
XLI Forms Pennant Near Prior High
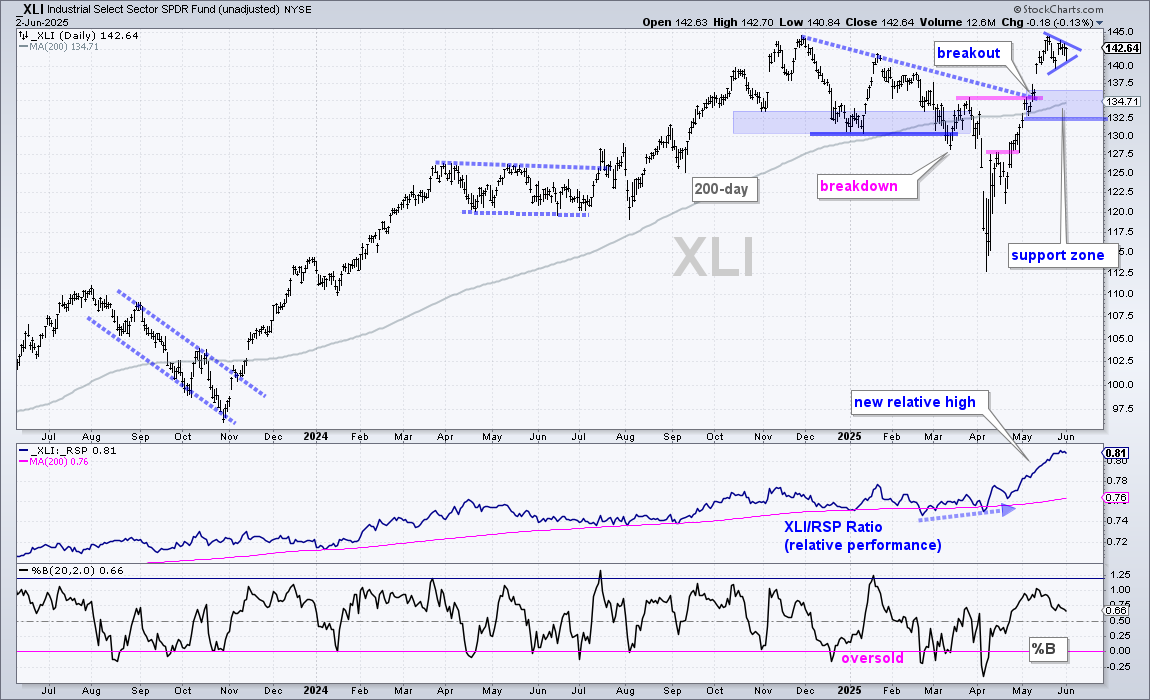
The next chart shows the Industrials SPDR (XLI) surging to the December high and forming a pennant. A breakout would signal a continuation higher and lead to new highs. As with many ETFs, XLI is also short-term extended after the ~25% surge from early April to mid May. This pennant is alleviating short-term overbought conditions, but we could still see a pullback. The blue shading marks support to watch should XLI pullback.
Utilities SPDR Extends on Breakout
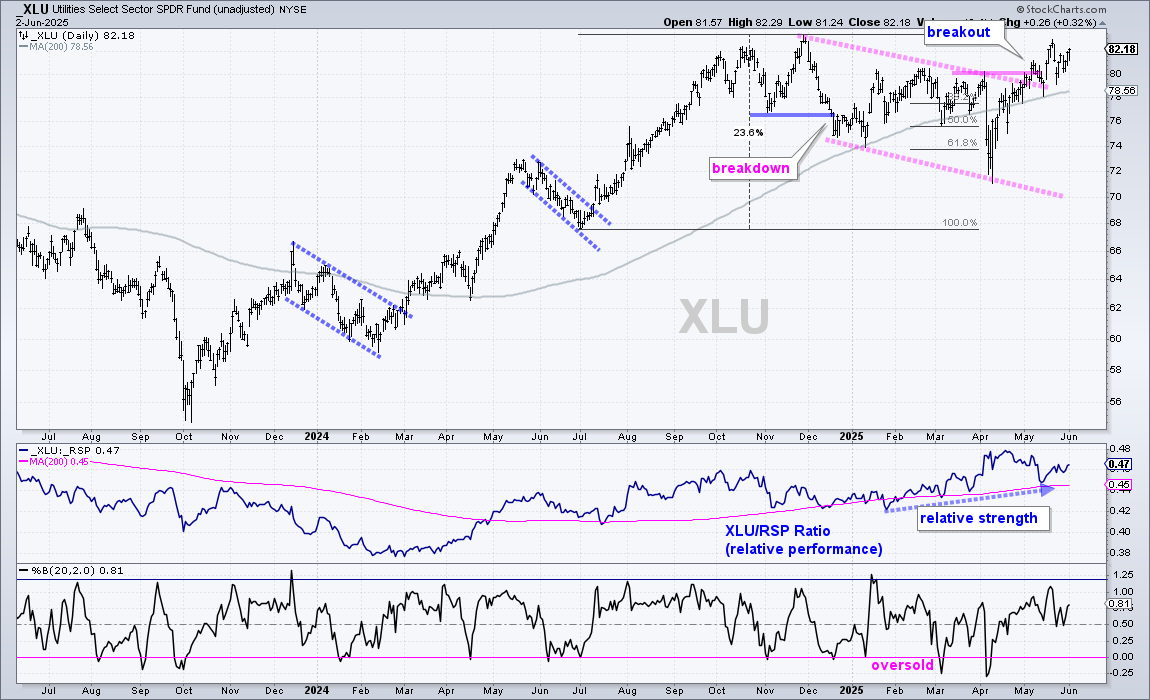
The Utilities SPDR (XLU) is showing absolute and relative strength as it extends on its mid May breakout. Overall, XLU is above the rising 200-day SMA and within 2% of a 52-week high. The ETF corrected with a falling channel from December to April and broke out in mid May. This breakout signals an end to the correction and a resumption of the bigger uptrend. The middle window shows the price-relative (XLU/RSP ratio) turning up in February and rising the last few months. This ratio is above its 200-day SMA as XLU shows relative strength the last few months.
Consumer Staples SPDR Breaks Wedge Line
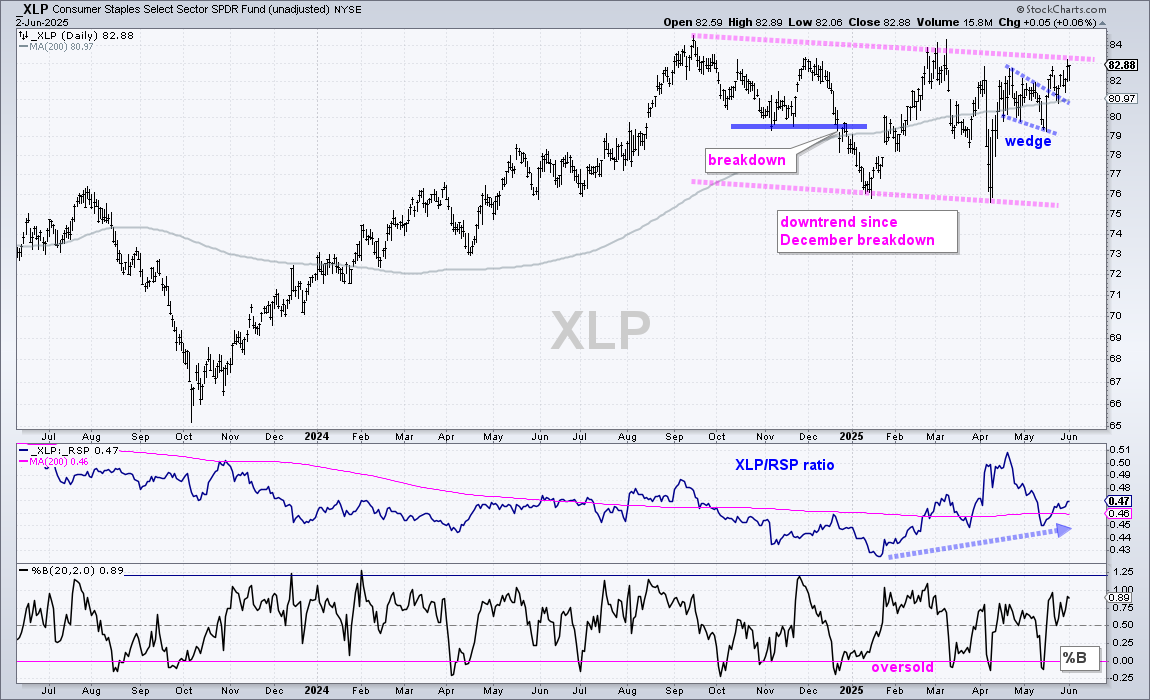
The Consumer Staples SPDR (XLP) is perking up as it breaks out of a small wedge and the price-relative turns up. Overall, XLP peaked in September and formed a falling channel the last six months. Even though this channel is falling, XLP is back above its rising 200-day SMA and less than 2% from a 52-week high. In addition, the ETF broke out of a small wedge in late May and is on the verge of a bigger channel breakout. The middle window shows the price-relative dipping below its 200-day SMA in mid May and turning back up the last two weeks. XLP is starting to outperform again.
Insurance ETF is Poised for a Breakout
The Insurance ETF (KIE) is on the verge of breaking wedge resistance to signal an end to the correction. KIE advanced 32% from April to November and then retraced 61.8% with a decline into early April. This decline also returned to broken resistance and support from the August low (blue shading). KIE bounced with the rest of the Market into late May and moved back above the rising 200-day SMA. Overall, I view the falling wedge as a correction and a breakout at 60 would be bullish. Support is set at 57. The middle window shows the price-relative in a long-term uptrend as it holds above the 200-day SMA. KIE underperformed in April-May, but this could be a relative correction back to the 200-day. Notice that the price-relative turned up the last few days.
Send feedback to support(at)trendinvestorpro.com or use the contact form. [6]