
The next report will be on Tuesday, 6th
Report Headlines
- Trend Trio Signals for Aerospace & Defense ETF
- Few Uptrends Out There (bonds, commodities, crypto)
- An Extended Uptrend for GLD
- Long-term Overbought Conditions for GLD
- 23 ETFs above their Rising 200-day SMAs
- Software ETF Breaks Out with Another Big Move
Trend Trio Signals Up for Aerospace & Defense ETF
The Trend Trio is a trend-following aggregator using three trend-following indicators. CCI(125) signals an uptrend with a cross above 100 and a downtrend with a cross below -100. Bollinger Bands (125,1) signal an uptrend with a cross above the upper band and a downtrend with a cross below the lower band. Keltner Channel (125,2,125) signals uptrend with a cross above the upper line and downtrend with a cross below the lower line. Aggregating these signals, the Trend Trio signals uptrend with two or more uptrends signals and downtrend with two or more downtrend signals.
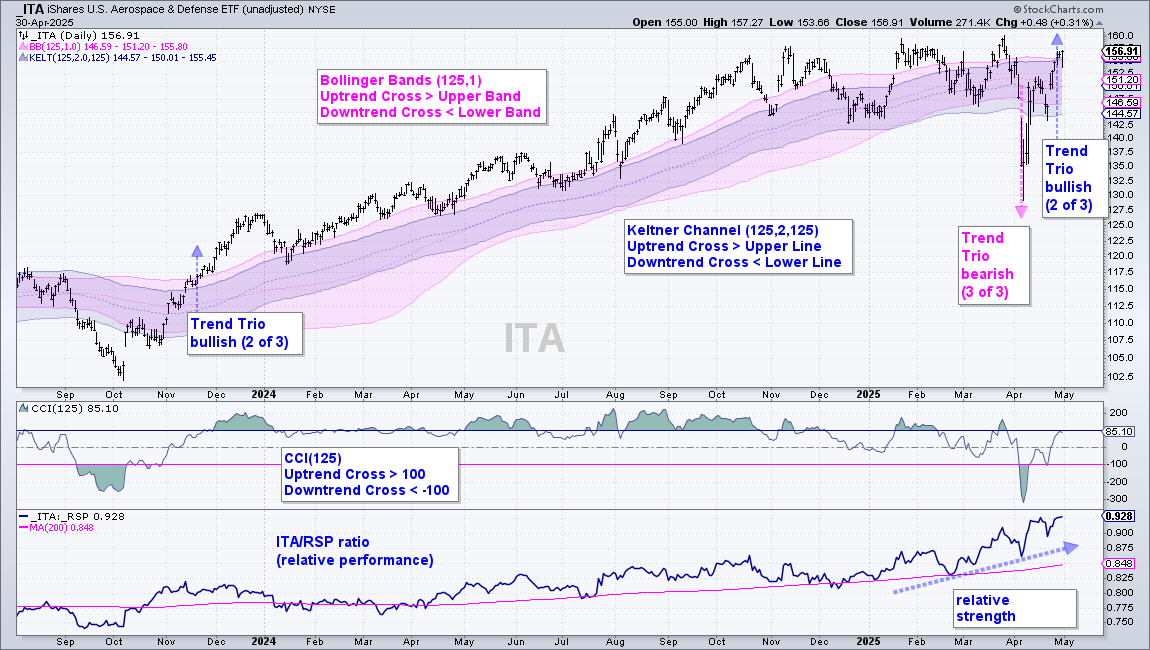
The chart above shows the Aerospace & Defense ETF (ITA) with Keltner Channels (blue), Bollinger Bands (pink) and CCI in the middle window. The Trend Trio turned net bullish in mid November 2023, bearish in early April 2025 and net bullish this week. ITA was not immune to broad selling pressure in early April as it broke down with the rest of the market. However, it was one of the quickest to recover its support break. ITA followed through with further strength by breaking the upper Bollinger Band and Keltner Lines this week. The uptrend is back in play until two of the three trigger bearish.
Few Trend Trio Uptrends Out There
My core ETF list has 72 names with 59 equity ETFs, 4 bond ETFs, 7 commodity ETFs and 2 Crypto ETFs. Only 11 of the 72 are in Trend Trio Uptrends.
- Gold SPDR (GLD)
- Gold Miners ETF (GDX)
- Silver ETF (SLV)
- Silver Miners ETF (SIL)
- Copper ETF (CPER)
- Natural Gas ETF (UNG)
- 0-30yr TIP Bond ETF (TIP)
- 0-05yr TIP Bond ETF (STIP)
- 7-10 Yr Treasury Bond ETF (IEF)
- Bitcoin ETF (IBIT)
- Aerospace & Defense ETF (ITA) – new uptrend signal
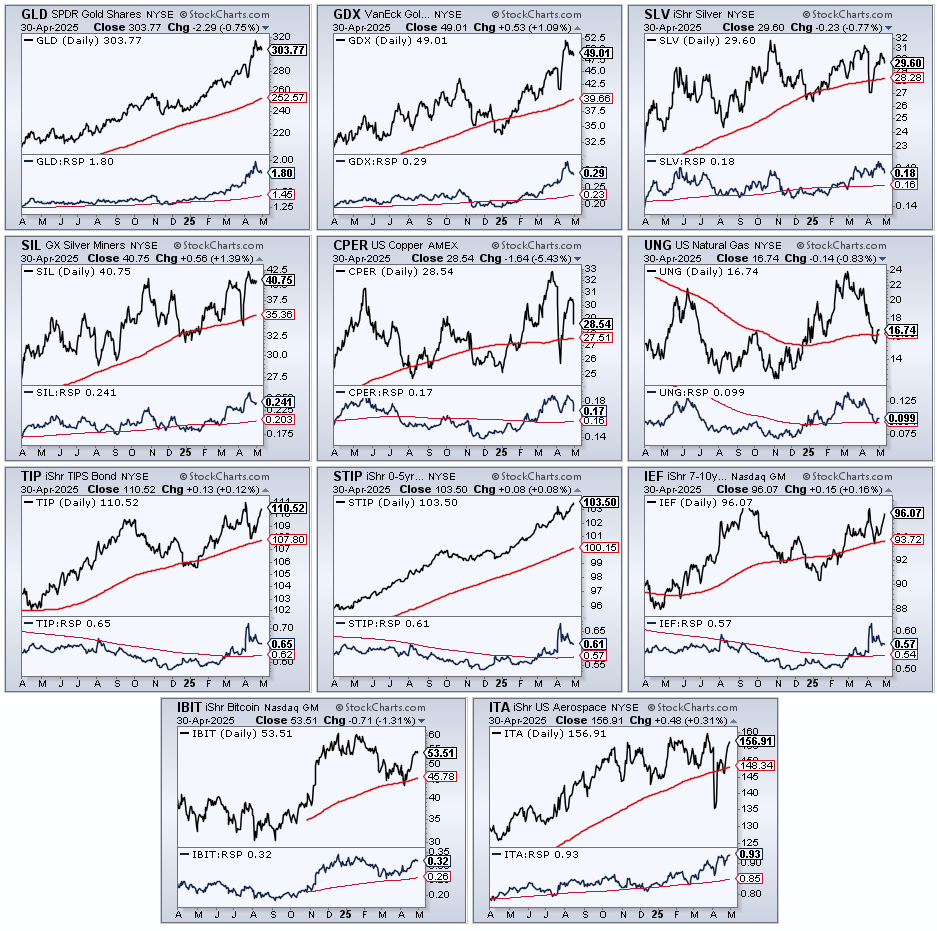
Four commodity ETFs are in uptrends (GLD, SLV, CPER, UNG). Three equity ETFs are in uptrends (GDX, SIL, ITA), but two of these are related to precious metals. Three bond ETFs are in uptrends and the Bitcoin ETF (IBIT) is in an uptrend. This is a defensive picture. All 11 sectors SPDRs, all tech-related ETFs and ETFs related to housing, banks and retail are in Trend Trio downtrends.
An Extended Uptrend for GLD
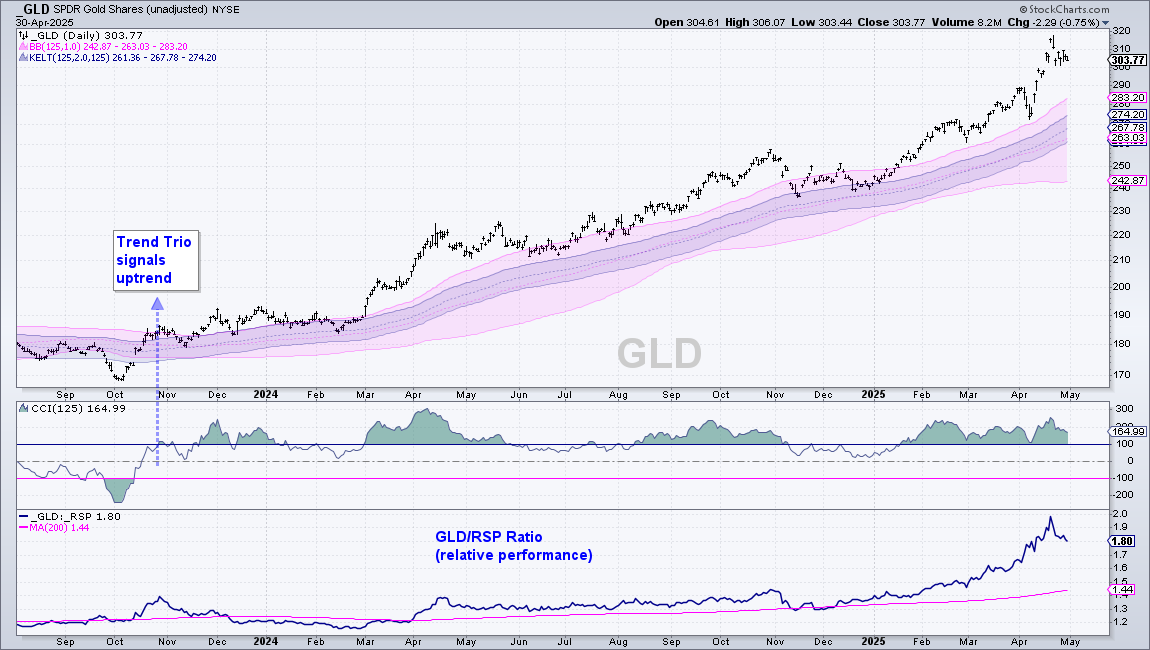
The chart below shows the Gold SPDR (GLD) with a strong uptrend. All three Trend Trio indicators signaled an uptrend in late October 2023 and this uptrend remains in place. GLD is up over 60% since this signal, and will give back some of this gain by the time the Trend Trio signals a downtrend. Note that the uptrend signaled after 10% advance off the October 2023 low. I do not know when a downtrend signal will trigger, but my guess is that GLD will be well off its high when it does. This is the nature of trend-following. The signals do not catch the top or the bottom, but profit from the middle of the move. Trend-following strategies work over time because one good trend pays for the losers.
Long-term Overbought Conditions for GLD
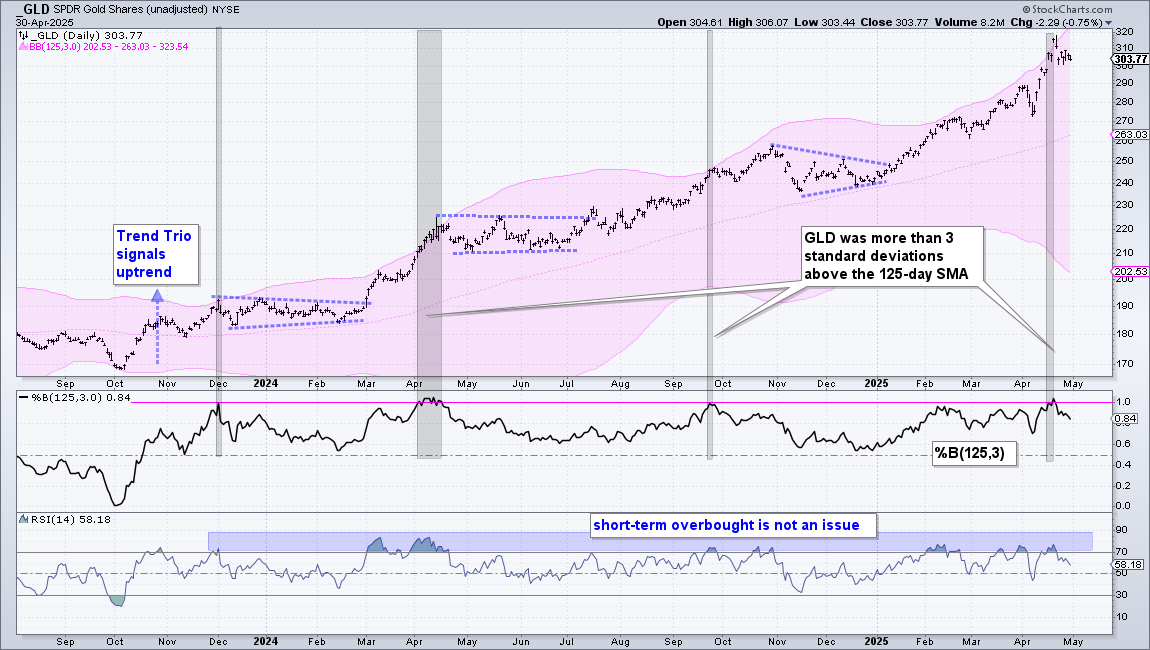
Overbought conditions are tricky, very tricky. Normally, I ignore short-term overbought conditions when the long-term trend is up. Overbought conditions stem from strong buying pressure and this is not a concern in an uptrend. For example, we expect RSI to become overbought (>70) in an uptrend. Long-term overbought conditions, in contrast, are a concern because they can lead to a corrective period. How do we distinguish between the two?
The next chart shows GLD with Bollinger Bands (125,3), %B (125,3) and RSI(14). The gray shading shows when GLD moved above the upper Bollinger Bands, which means it was more than 3 standard deviations above its 125-day SMA. %B (125,3) exceeds one when this long-term overbought condition occurs. Such conditions preceded corrective periods that started in December 2023 and April 2024 (blue dashed lines). GLD continued higher after becoming overbought in late September 2024, but peaked in late October and corrected into yearend. Most recently, GLD became long-term overbought on April 16th and 21st. I am now expecting a corrective period to unfold.
Precious metals related ETFs are positively correlated with gold. These include the Gold Miners ETF (GDX), Silver ETF (SLV) and Silver Miners ETF (SIL). I would expect these three to move in the same direction as gold. Thus, a correction in gold would lead to a correction in these three. However, I would expect these three to move more than gold because they have higher standard deviations (volatility).
23 ETFs above their Rising 200-day SMAs
Chartists can also use the 200-day SMA and the direction of the 200-day SMA to compare performance. ETFs trading above their rising 200-day SMAs are performing better than those trading below their falling 200-day SMAs. Overall, 23 of the 72 core ETFs are trading above their rising 200-day SMAs. Using this looser definition for an uptrend, we can see four sectors enter the picture and four tech-related ETFs.
XLC, XLP, XLF, XLU, CIBR, IGV, FDN, ARKF, IHI, KIE, ITA, IYZ, GLD, GDX, SLV, SIL, CPER, DBA, UNG, IEF, TIP, STIP, IBIT
I featured the Cybersecurity ETF (CIBR) and ARK Fintech Innovation ETF (ARKF) in prior reports. Today I will analyze the Software ETF (IGV). First note that we all have different trading styles and parameters. I use broad market conditions, long-term trends and relative performance to make my first cut. My market posture is defensive during bear markets. This means I limit exposure to stocks and equity ETFs. The second cut is for ETFs in some sort of long-term uptrend. And finally, I look for ETFs showing relative strength.
Software ETF Breaks Out with Another Big Move
The chart below shows IGV with the 200-day SMA for basic trend identification, the IGV/RSP ratio for relative performance and %B (20,2) for identifying oversold conditions. First, note that IGV has been all over the place since September (+38%, -26% and +21%). Three 20+ percent moves in eight months is not normal.
Most recently, IGV broke down in early March, plunged in early April and then surged the last three weeks. Such volatility makes conditions extremely challenging, which is reason enough to wait for things to settle down. For example, I would not go for a bike ride during a severe thunderstorm. Instead, I would find something else to do and wait out the storm.
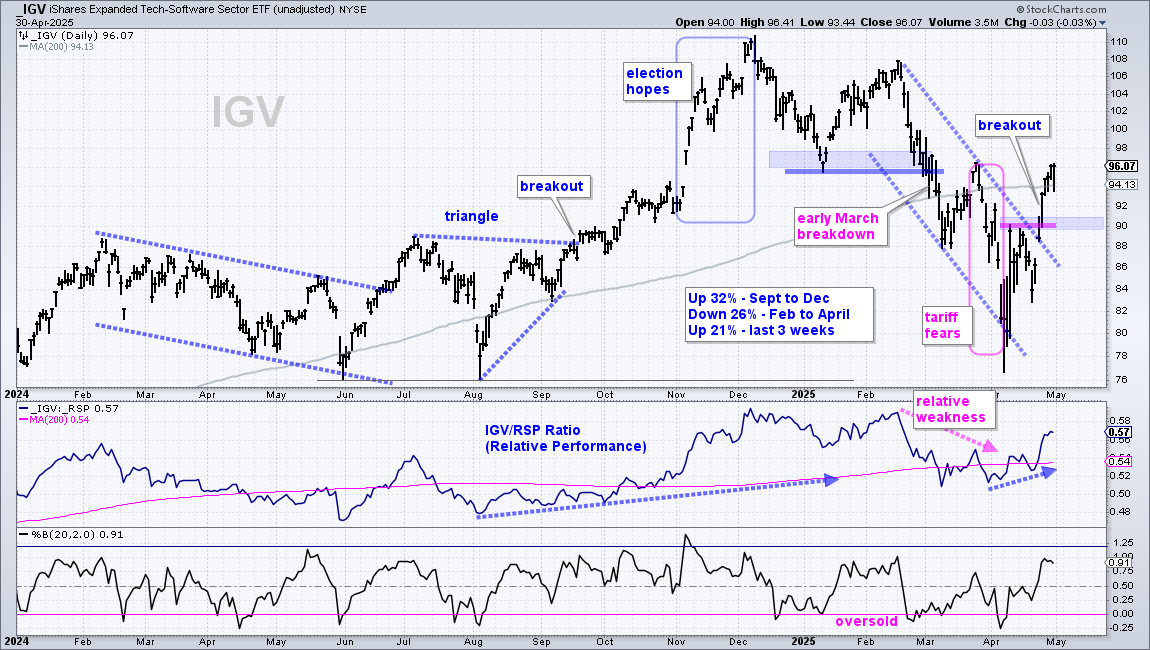
IGV is bullish now, but conditions are still tough. IGV broke resistance at 90 last week as it gapped higher on April 22nd (Fed blink) and surged on April 23rd (Zweig Breadth Thrust). The ETF also recaptured the rising 200-day SMA this week. The indicator window shows the price-relative turning up in April as IGV starts to outperform again. This ETF looks bullish, but risk remains above average. First, the weight of the market evidence is bearish and SPY is below its 200-day SMA. Second, volatility is above average.
There is no sense forcing a shot right now, unless you are Jimmy “Playoff” Butler. In trading terms, this would be like chasing the breakout. IGV is leading and shows a strong breakout, but within a severe thunderstorm. I will put it on my watch list for tradable pullbacks. Here are two items to watch. First, the breakout zone around 90 turns first support. A throwback to this area could provide a lower risk opportunity. Second, a %B dip below would show an oversold condition.
The idea here is to pick your spot ahead of time and let the market come to you.
Send feedback to support(at)trendinvestorpro.com or use the contact form.