
The next report will be on Thursday, May 8th.
Report Headlines
- Long-term Trend and Breadth Indicators are Net Bearish
- Zweig Breadth Thrust Remains Active
- SPY and S&P 500 Breadth: Net Bearish since March 13th
- QQQ/Nasdaq 100 Breadth: Bearish since March 31st
- RSP and S&P 1500 Breadth: Bearish since March 11th.
- Yield Spreads Plunge as Stocks Surge
- 3-month Yield Edges Higher (Fed on Hold?)
- TLT Remains with Downtrend and Wedge Break
Long-term Trend and Breadth are Bearish
Stocks plunged in historic fashion with long-term breadth indicators reaching extremes in early April. Stocks then surged in historic fashion with a Zweig Breadth Thrust and steep advance. The plunge is like stretching a rubber band and the rebound is the effect of letting go. The further the stretch, the bigger the snap back.
SPY, QQQ and RSP moved back into their Bollinger Bands and the long-term breadth indicators returned to their mid points. SPX %Above 200-day SMA is at 52.4% and SPX High-Low Percent is at +2.8%. These levels suggest that we have four ounces in our cup, which is eight ounces.
But is the cup half full or half empty? Until the long-term breadth indicators get to the six ounce level, I think the cup is still half empty because the bearish signals have yet to be reversed. For example, the percent above 200-day SMA indicators need to exceed 60% to turn bullish. NDX %Above 200-day did its part, but the S&P 500 and S&P 1500 are still short of signals.
Note that I added another indicator to the mix. The percentage of stocks above the 100-day SMA turns bullish with a move above 80% and bearish with a move below 20%. Each chart has five indicators. The evidence turns bullish when 3 of the 5 are bullish, and bearish when 3 of the 5 are bearish.
Zweig Breadth Thrust Remains Active
A Zweig Breadth Thrust triggered on April 24th and SPY also moved above the lower Keltner line (65,2,65). As laid out in this strategy report, the breadth thrust is bullish as long as SPY holds the lower Keltner line. Five consecutive closes below the lower Keltner line would negate the Zweig Breadth Thrust.
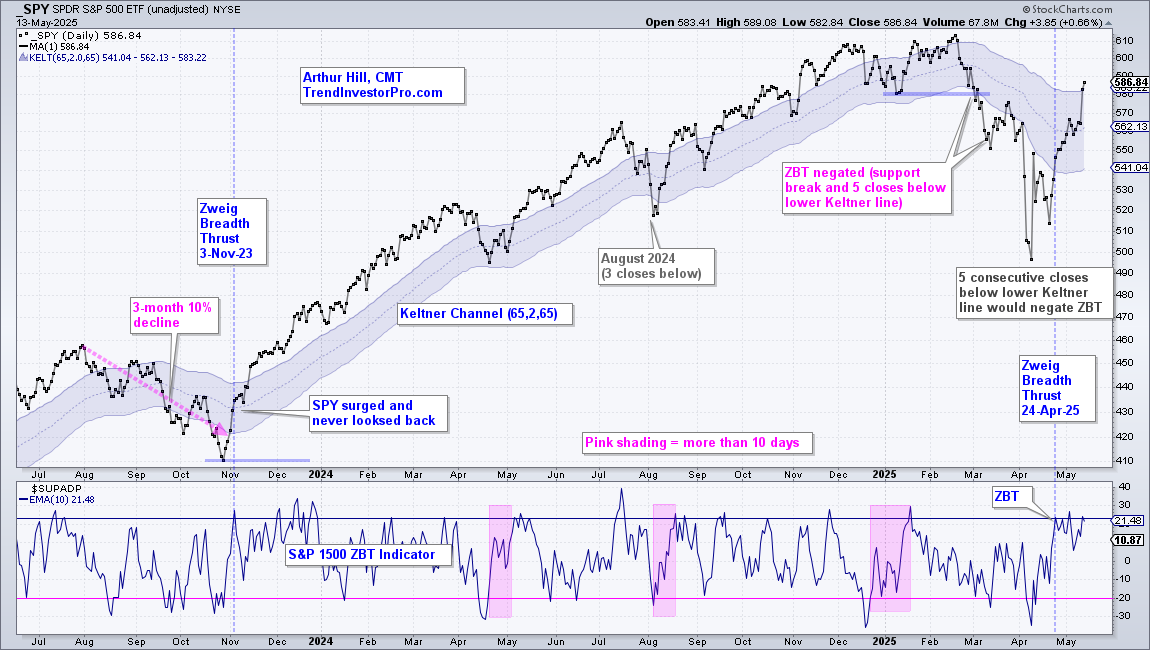
Note that the Zweig Breadth Thrust is not a trend-following indicator. It shows a sharp and material shift in upside participation within a 10 day window. ZBT signals are reversal signals that often trigger before the trend-following indicators turn bullish. While the long-term track record is good, keep in mind that the Zweig Breadth Thrust is not perfect and an exit plan is necessary. See this report for details on the ZBT indicator.
SPY and S&P 500 Breadth: Net Bearish since March 13th
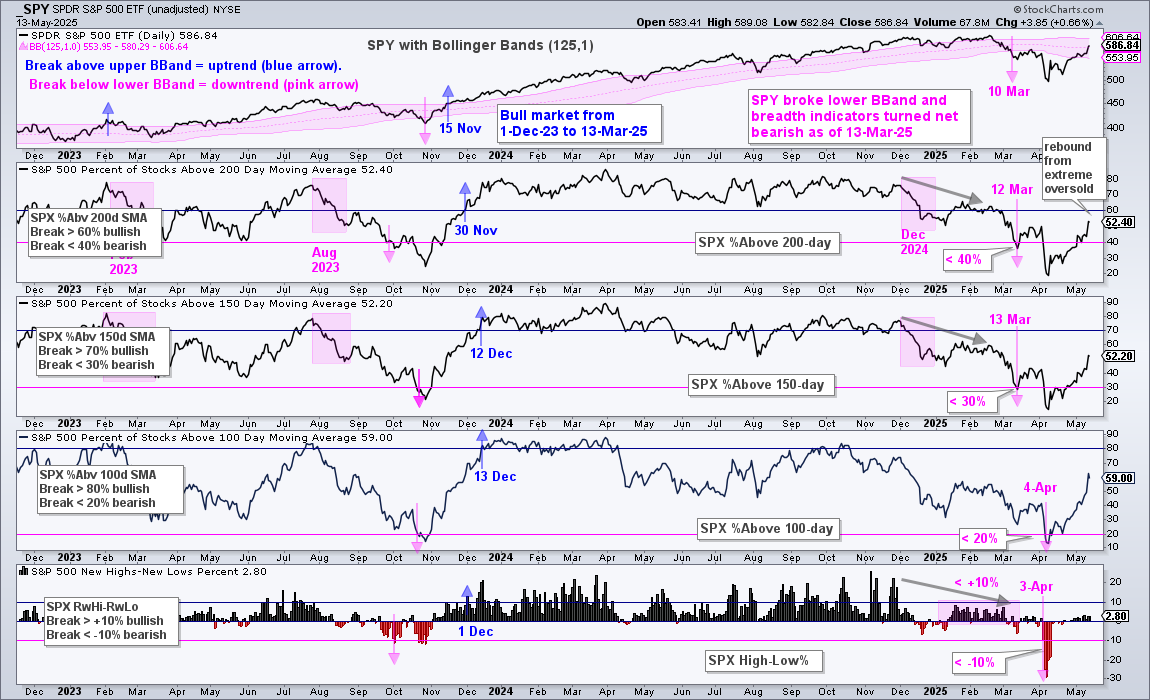
SPY and S&P 500 breadth turned net bearish on March 13th. Breadth indicators became extremely oversold in early April and then rebounded with a vengeance into mid May as SPX %Above 200-day SMA exceeded 50%. Further strength with a move above 60% would turn this indicator bullish again. SPX High-Low Percent plunged to -30% and also rebounded, but we have yet to see a serious expansion in new highs. There were 20 new highs on Tuesday and 6 new lows (20 – 6 = +14, +14/500 = +2.8%). A move above +10% would turn this indicator bullish again. Bottom line: the bounce is strong, but the indicators returned to neutral levels (at best) and the long-term evidence remains bearish (at worst).
Active Signals: Bears 5 – Bulls 0
- Bearish: SPY broke the lower Bollinger Band (125,1) on March 10th
- Bearish: SPX %Above 200-day broke below 40% on March 12th
- Bearish: SPX %Above 150-day broke below 30% on March 13th
- Bearish: SPX %Above 100-day broke below 20% on April 4th
- Bearish: SPX High-Low Percent Hit -10% on April 3rd
About the Major index ETFs and Breadth Signals
The top window on each breadth chart shows the corresponding major index ETF with Bollinger Bands (125,1). An uptrend signals when the ETF breaks above the upper Bollinger Band and a downtrend signals with a break below the lower band. The index ETFs are the S&P 500 SPDR (SPY), the Nasdaq 100 ETF (QQQ) and the S&P 500 EW ETF (RSP).
Each index has three breadth indicators. SPY uses S&P 500 breadth, QQQ uses Nasdaq 100 breadth and RSP uses S&P 1500 breadth. The percentage of stocks above the 200-day SMA triggers bullish with a move above 60% and bearish with a move below 40%. The percentage of stocks above their 150-day SMAs triggers bullish with a move above 70% and bearish with a move below 30%. The percentage of stocks above their 100-day SMAs triggers bullish with a move above 80% and bearish with a move below 20%. High-Low Percent triggers bullish with a move above +10% and bearish with a move below -10%. High-Low Percent is the percentage of stocks making 52-week highs less the percentage making 52-week lows.
These bullish/bearish signal thresholds are designed to identify significant changes in the stock market (bull market or bear market). As trend-following signals, they will lag and there will be whipsaws. Long-term, these signals keep us on the right side of the market. The idea is to be invested during bull markets (risk-on) and in cash during bear markets (risk-off).
QQQ and Nasdaq 100 Breadth: Bearish since March 31st
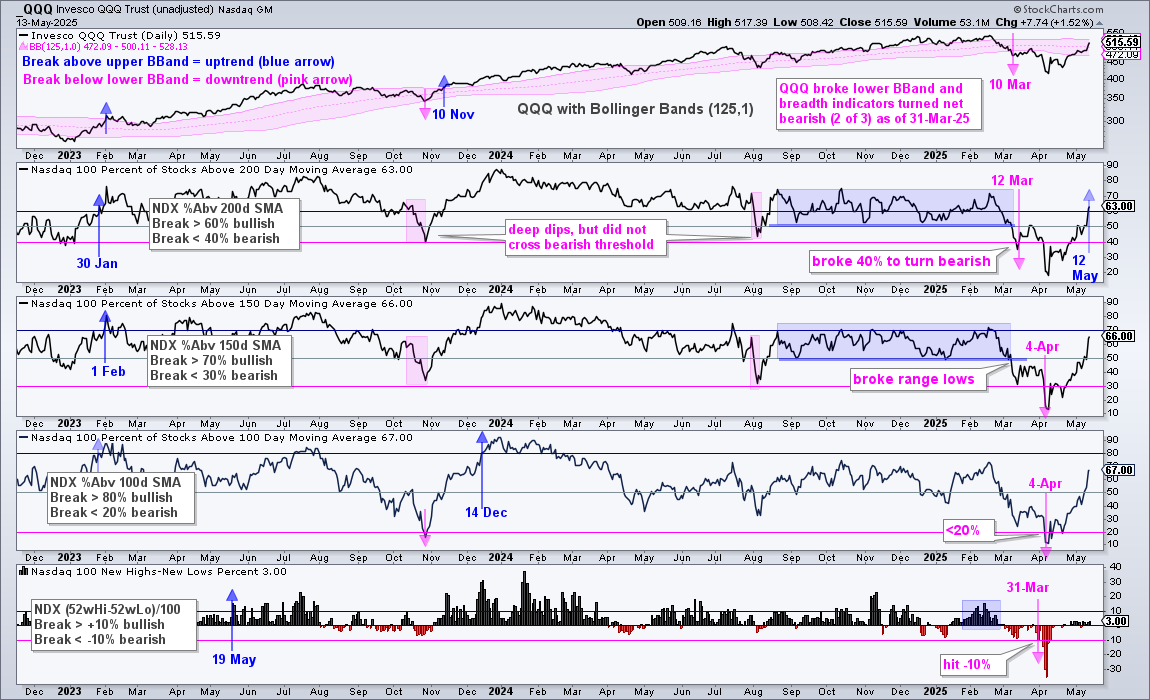
QQQ and Nasdaq 100 breadth turned net bearish on March 31st (at least 3 of 5 indicators bearish). All five indicators were bearish as of April 4th. Nasdaq 100 stocks are leading the V-Reversal as NDX %Above 200-day SMA surged above 60% on Monday (blue arrow). One bullish indicator is a start, but still in the minority.
Active Signals: Bears 4 – Bulls 1
- Bearish: QQQ broke the lower Bollinger Band (125,1) on March 10th
- Bullish: NDX %Above 200-day broke above 60% on May 12th
- Bearish: NDX %Above 150-day broke below 30% on April 4th
- Bearish: NDX %Above 150-day broke below 30% on April 4th
- Bearish: NDX High-Low Percent Hit -10% on March 31st
RSP and S&P 1500 Breadth: Bearish since March 11th.
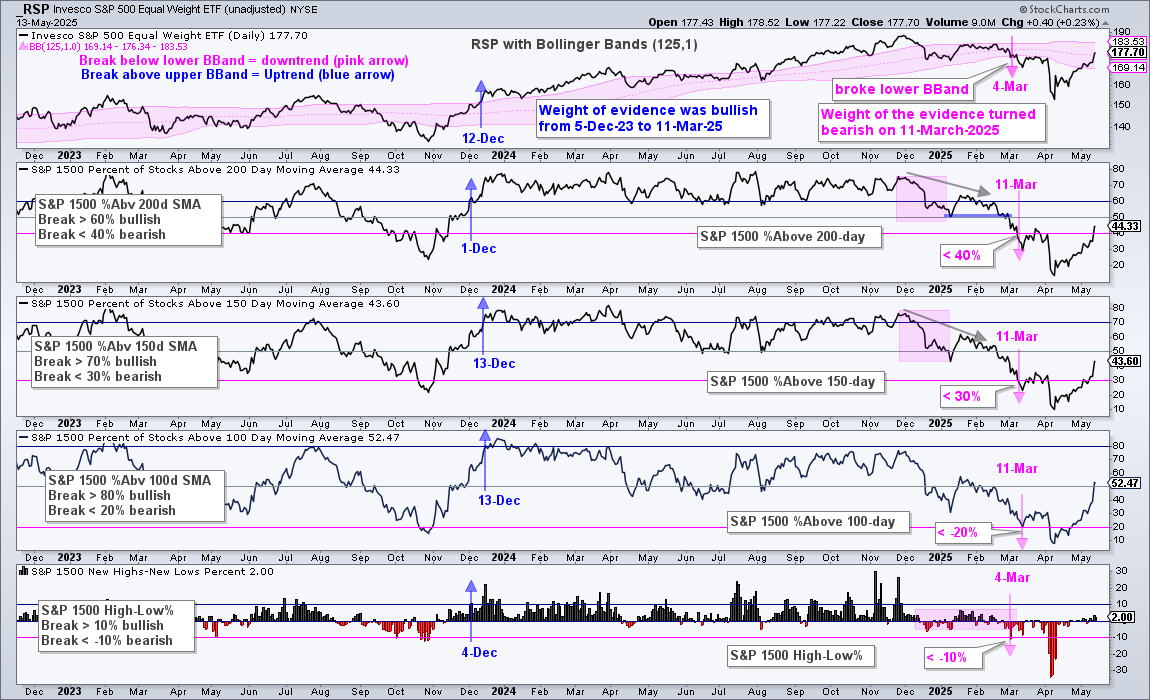
RSP and S&P 1500 breadth turned net bearish on March 11th (at least 3 of 5 indicators bearish). All five indicators were bearish as of March 11th. S&P 1500 %Above 200-day SMA ($SUPA200R) dipped to 10% in early April to become extremely oversold and surged above 40% in mid May. Over 50% of S&P 1500 stocks are now above their 100-day SMAs. These are strong rebounds, but not enough to flip these indicators bullish.
Active Signals: Bears 5 – Bulls 0
- Bearish: RSP broke the lower Bollinger Band (125,1) on March 4th
- Bearish: S&P 1500 %Above 200-day broke below 40% on March 11th
- Bearish: S&P 1500 %Above 150-day broke below 30% on March 11th
- Bearish: S&P 1500 %Above 100-day broke below 20% on March 11th
- Bearish: S&P 1500 High-Low Percent broke below -10% on March 4th
Yield Spreads Plunge as Stocks Surge
The chart below shows SPY, the Junk Bond Spread ($$HYIOAS) and the BBB Bond Spread ($$BBBOAS). Yield spreads sharply narrowed (fell) as stocks rebounded from early April to mid May. The BBB spread (bottom window) fell from 1.5 to 1.29, but remains well above the breakout zone in the 1.10 area. Similarly, the Junk spread fell from 4.7 to 3.15, but remains just above its breakout zone in the 3 area. The pink lines show the 200-day SMAs. Further narrowing below these levels would show a serious improvement in confidence.
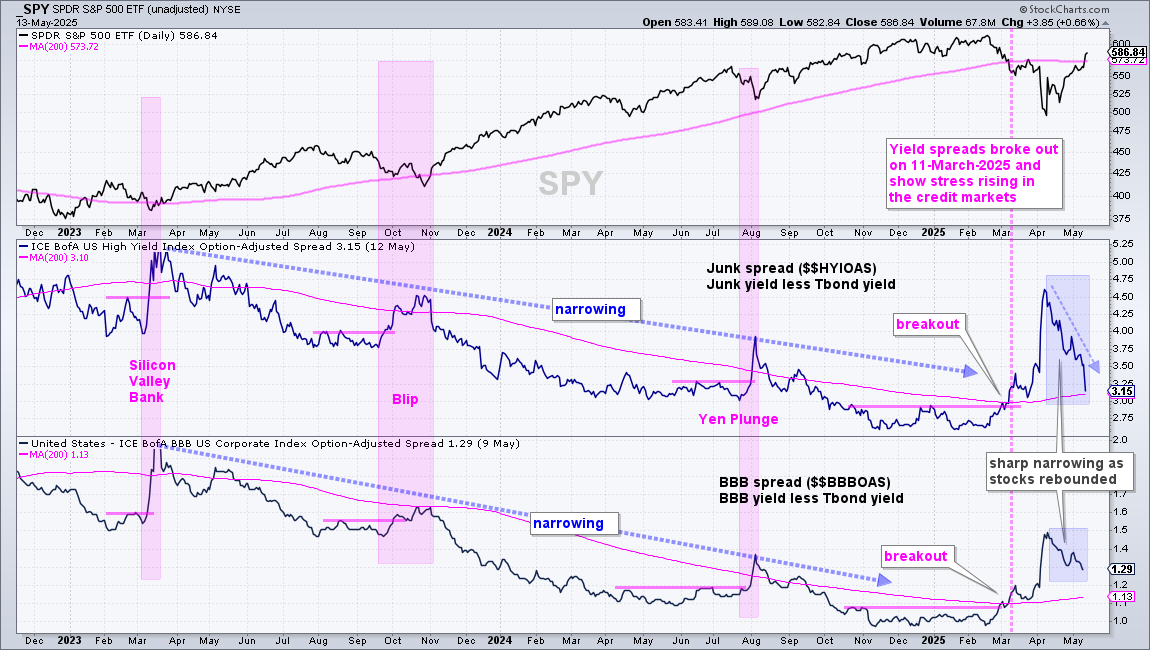
The yield spread is the difference between the Junk Bond Yield or BBB Bond Yield and a comparable Treasury Bond Yield. Junk and BBB bonds represent risk assets, while Treasuries represent relative safe-havens. The spread is the risk premium for holding the riskier assets. Narrow/narrowing spreads show confidence and this is bullish for stocks. Wide/widening spreads show stress and this is negative for stocks.
3-month Yield Edges Higher (Fed on Hold?)
The 3-month Treasury Yield ($UST3M) remains below 4.5%, but edged higher the last few days and a breakout would argue for a more hawkish Fed. area, and stuck here all year.
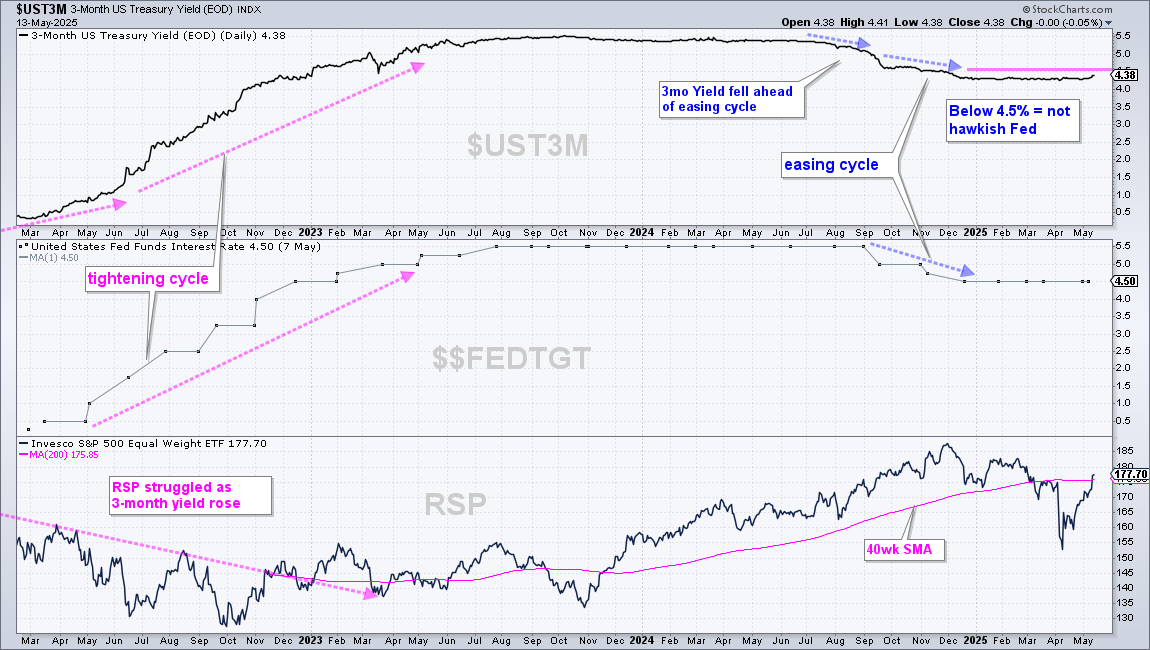
The middle window shows the Fed Funds Target Rate ($$FEDTGT) falling from September to December as the Fed cut rates (dovish). This Fed Funds target rate flattened this year, but has yet to turn up, which means the Fed has yet to raise rates (officially change their stance).
Several factors influence short-term Treasury yields, but they are still closely aligned with Fed policy and often lead the Fed. This means the yield often peaks (troughs) and turns down (up) before the Fed starts to lower (raise) rates. We use the 3-month Treasury yield to identify current Fed policy and anticipate the next Fed move
TLT Remains with Downtrend and Wedge Break
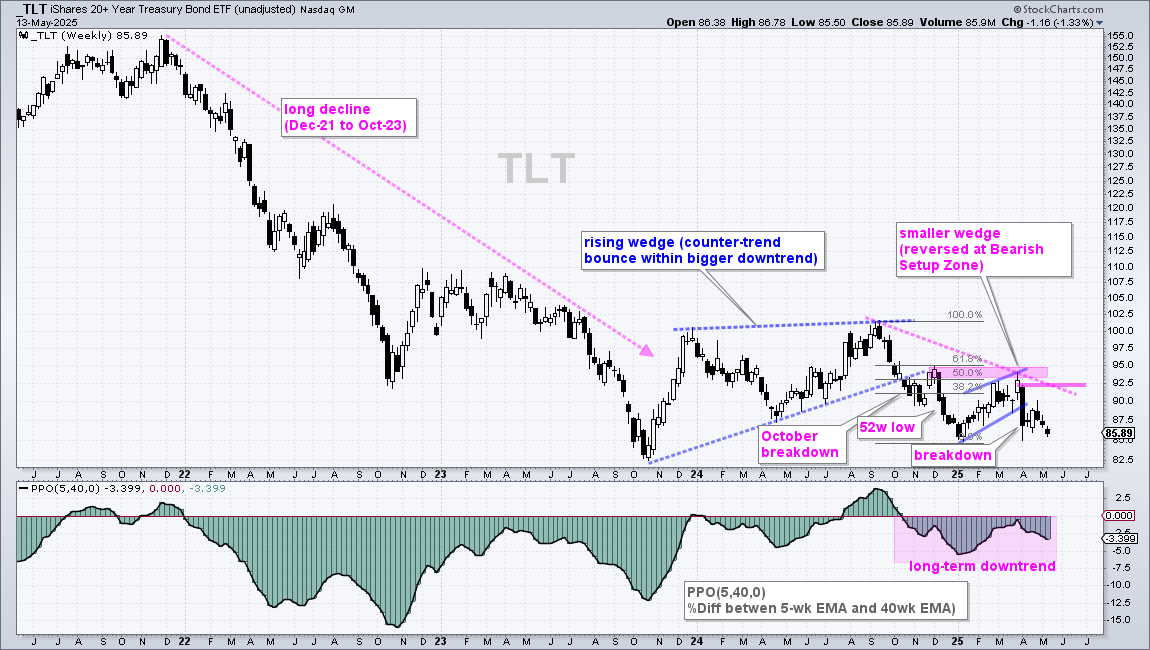
There is no change with TLT, which remains in a downtrend. TLT broke rising wedge support in October, hit 52-week lows in December and then rebounded in the first quarter. A rising wedge retraced 50-61.8% of the Sept-Dec decline and TLT broke the wedge line with a long black candlestick in early April. This breakdown remains in play (bearish). Re-evaluation resistance is set at 92.5 (pink line). The bottom window shows the PPO(5,40,0) in negative territory, which means the 5-week EMA is below the 40-week EMA (downtrend).
The next chart shows the 10-yr Treasury Yield in the top window and the 30-yr Treasury Yield in the lower window. The 10yr Yield broke out of a falling channel in mid April, edged lower with a short 3-week pullback and broke out with a move higher the last two days. The 30yr yield shows a wedge breakout in early April. The channel/wedge breakouts in early April are bullish until proven otherwise. This means the call is for higher yields. A close below 4% in the 10yr Yield and 4.4% in the 30yr Yield would negate these signals, and argue for lower rates.
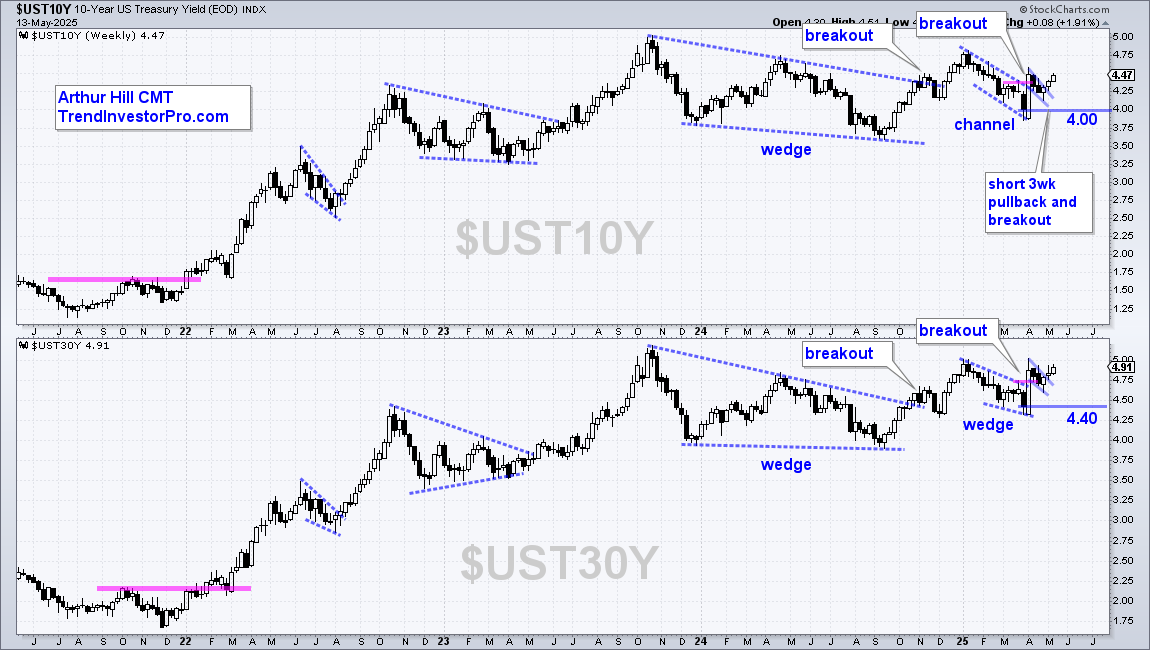
Several factors influence long-term Treasury yields, including growth expectations, inflation expectations, government debt levels, tariffs and foreign bond holders. The 10-yr Treasury Yield typically falls when the economic outlook dims and/or inflation expectations rise. Conversely, the yield typically rises when the economic outlook is bright and/or inflation expectation fall.