Market-ETF Report – Upswings Hold – Defensive ETFs Lead – Updates for GLD, IBIT, UNG, DBA

The next report will be on Friday,  May 9th

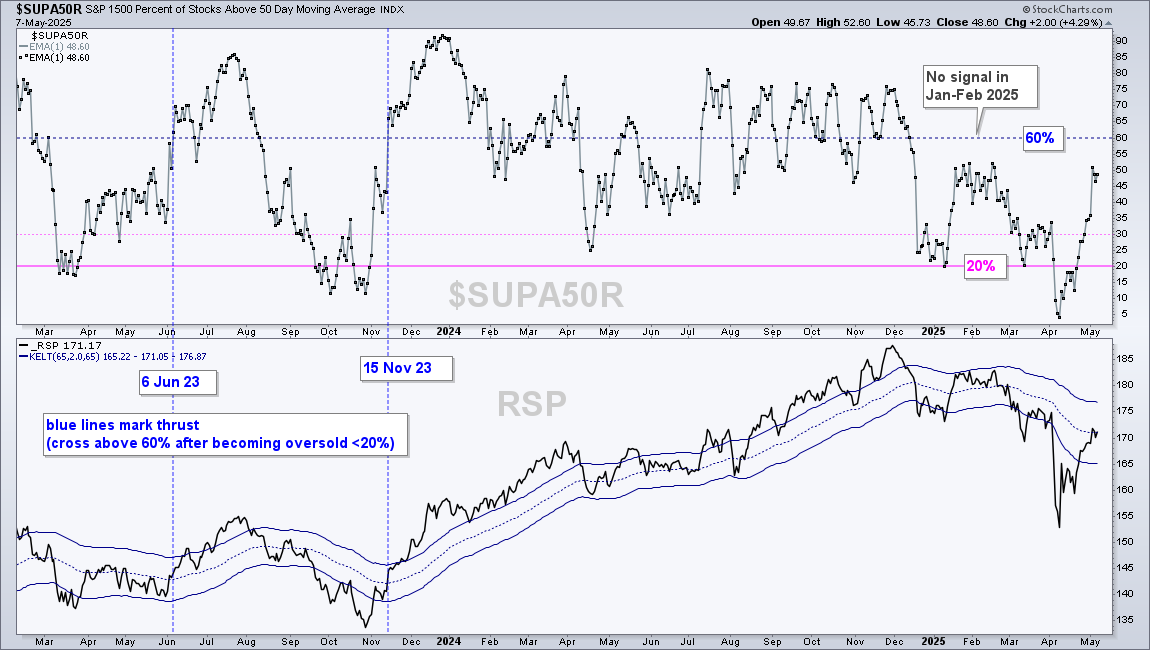
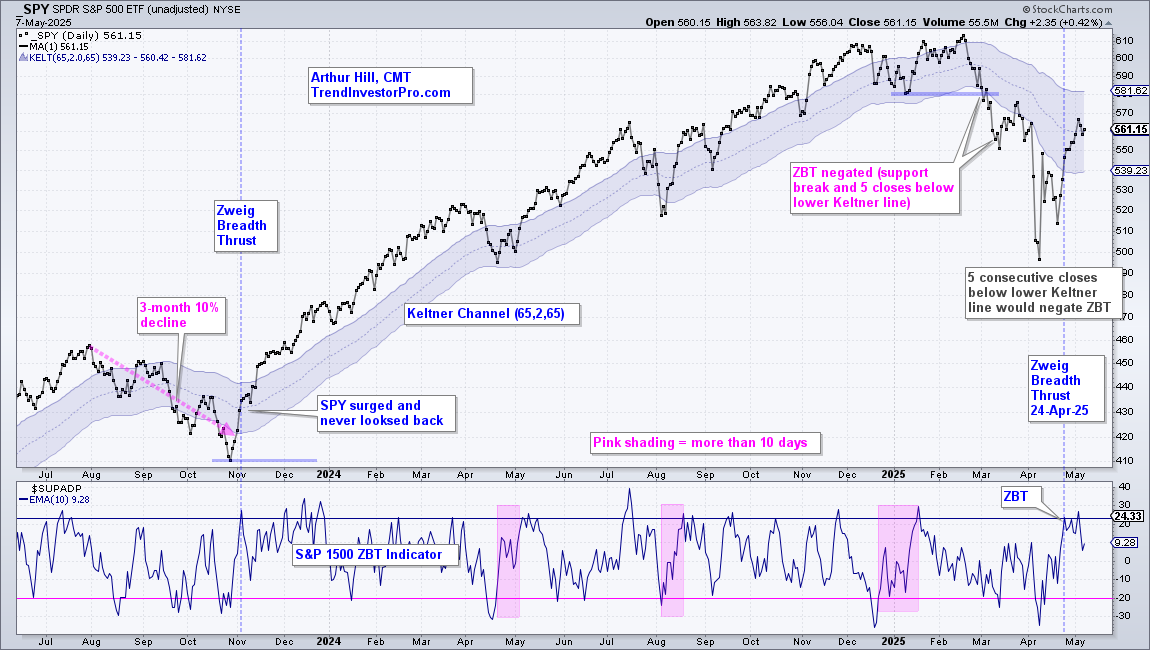
SPY and QQQ are in a short-term uptrend that include a Zweig Breadth Thrust on April 24th. Even though the long-term trends and breadth indicators remain bearish, this short-term uptrend remains in play as long as the wedges rise in SPY and QQQ. As noted in these first charts, I am looking for confirmation from S&P 1500 Percent Above 50-day SMA ($SUPA50R) as the next bullish step. Overall, I still see a relatively defensive market when looking at the leaders, which include utilities, defense, medical devices, food/beverage and precious metals. Today’s report will review the SPY/QQQ charts, show a leadership list and then review some commodity ETFs.

Friday Report – Tomorrow I will post a report comparing the V reversals in 2018 and 2020 with the current market. 

Report Headlines

  • Bullish Thrust Signals
  • Waiting on Confirming Signals
  • SPY and QQQ Maintain Upswings
  • Utilities SPDR Takes the Lead
  • ETF Leaders (MTUM, XLU, CIBR, ITA, IHI)
  • Bitcoin ETF Holds Strong
  • Gold SPDR Breaks Out of Small Wedge
  • UNG Holds April Reversal
  • DBA Stalls near Breakout Zone
  • MLP ETF Forms Bull Flag

Bullish Thrust Signals

S&P 1500 Zweig Breadth Thrust on April 24th. 

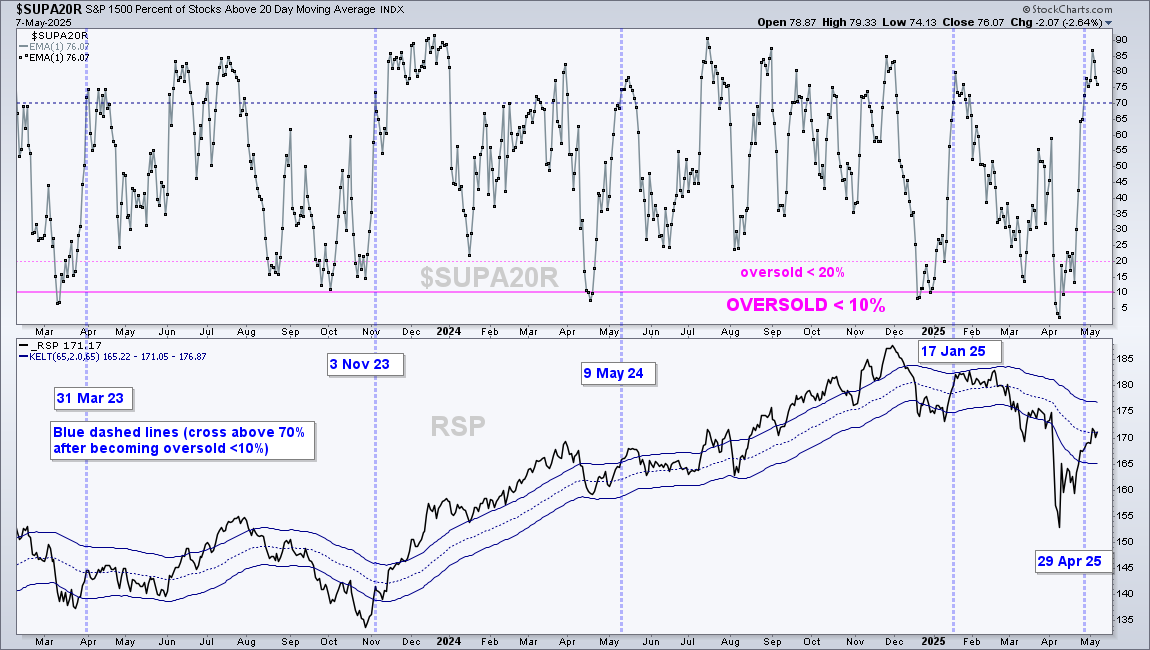
S&P 1500 %Above 20-day SMA Thrust on April 29th.

Waiting on Confirming Signals

S&P 1500 %Above 50-day SMA is at 50% and needs to exceeds 60% for a bullish signal.

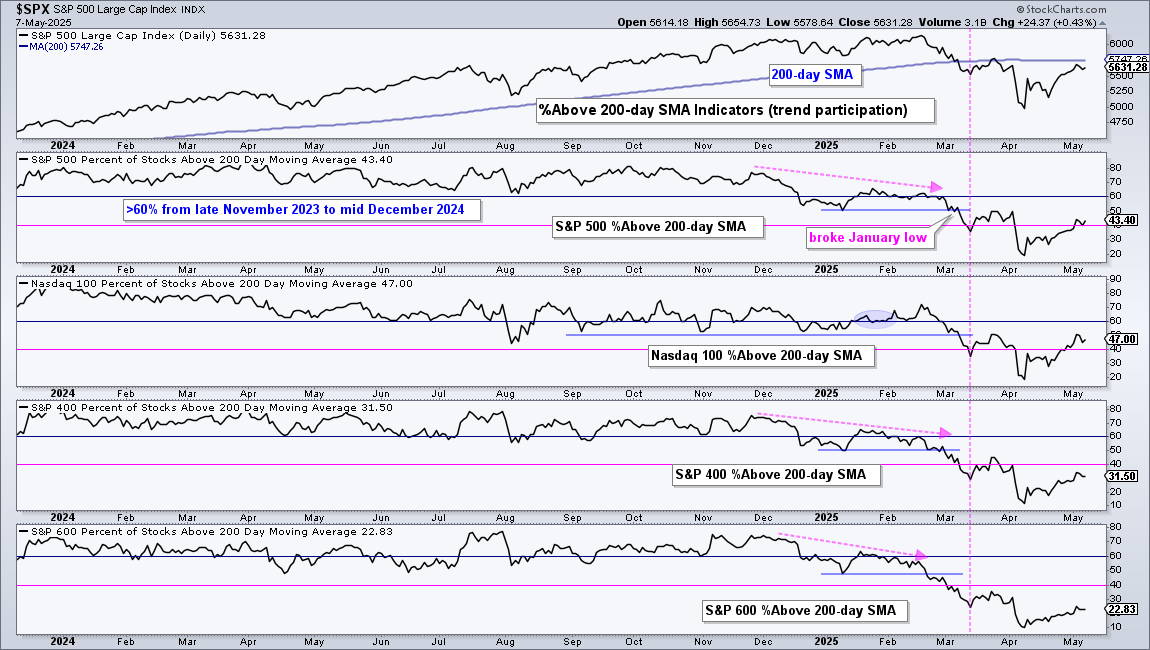
Long-term Breadth indicators in the Market Regime report are net bearish. The chart below shows the percentage of stocks above their 200-day SMA for four indexes. All are below 50% and only 23% of S&P SmallCap 600 stocks are above their 200-day SMAs.

SPY and QQQ Maintain Upswings

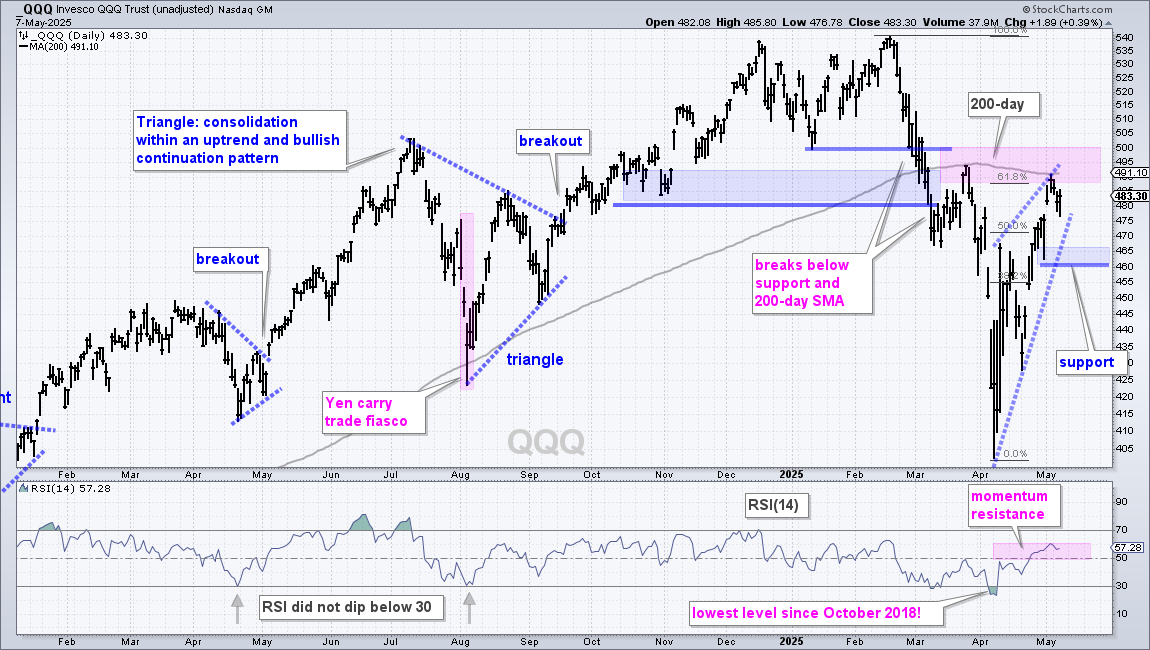
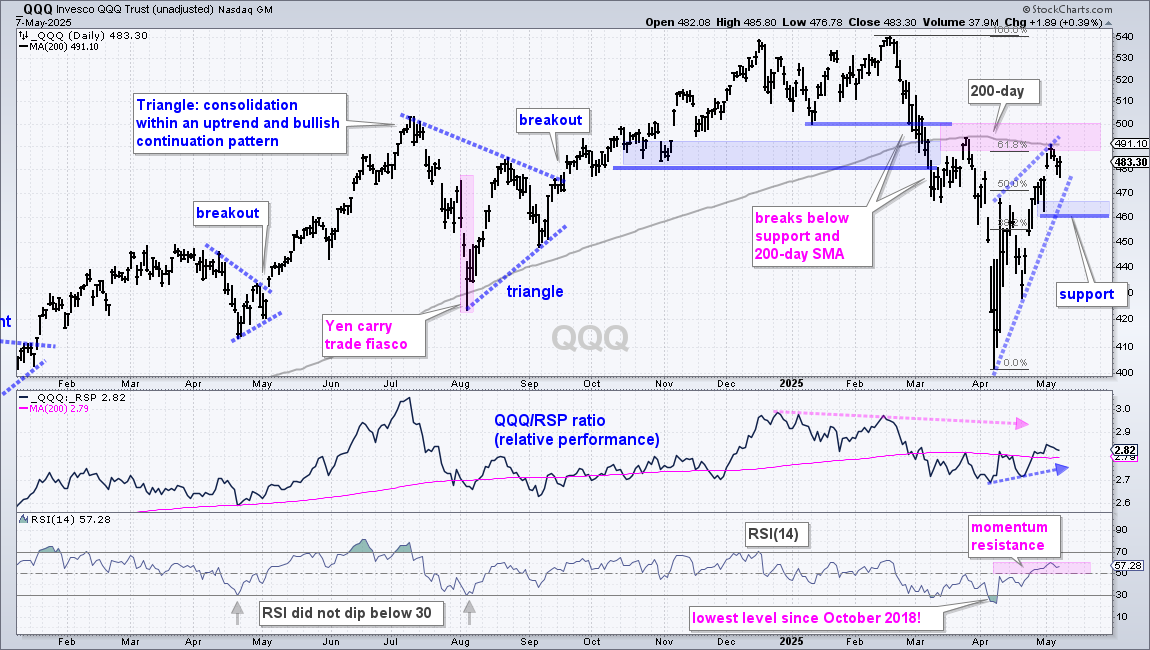
There is no change for SPY and QQQ. Both broke down in early-mid March, plunged into early April and surged into early May. They are trading near resistance zones marked by the 200-day SMAs (gray lines), 61.8% retracements, late March highs and prior support levels (pink shading). SPY is up 13% since April 8th (20 days) and QQQ is up 16%, which suggests short-term overbought conditions.

Summing it up, SPY and QQQ are in long-term downtrends, near resistance and short-term overbought. Even so, the short-term trends are up as long as the wedges rise. SPY and QQQ gapped up on May 1st and these gaps are largely holding. A decline that fills these gaps and closes below the April 30th close would be the first sign of weakness (550 SPY and 475 QQQ). A close below 540 for SPY and 460 for QQQ would break wedge supports and reverse the short-term upswings.

Utilities SPDR Takes the Lead

How do we find leaders using price charts? Leaders have four characteristics. First, they are trading above their 200-day SMAs. Second, their 200-day SMAs are rising. Third, they are trading above their late March highs. And finally, their price-relatives are rising and trading at or near new highs. QQQ is below its 200-day SMA, its 200-day SMA is falling, the ETF has yet to exceed its March high. The price-relative moved higher the last four weeks and broke its 200-day SMA, but the QQQ/RSP ratio is well below its February high.

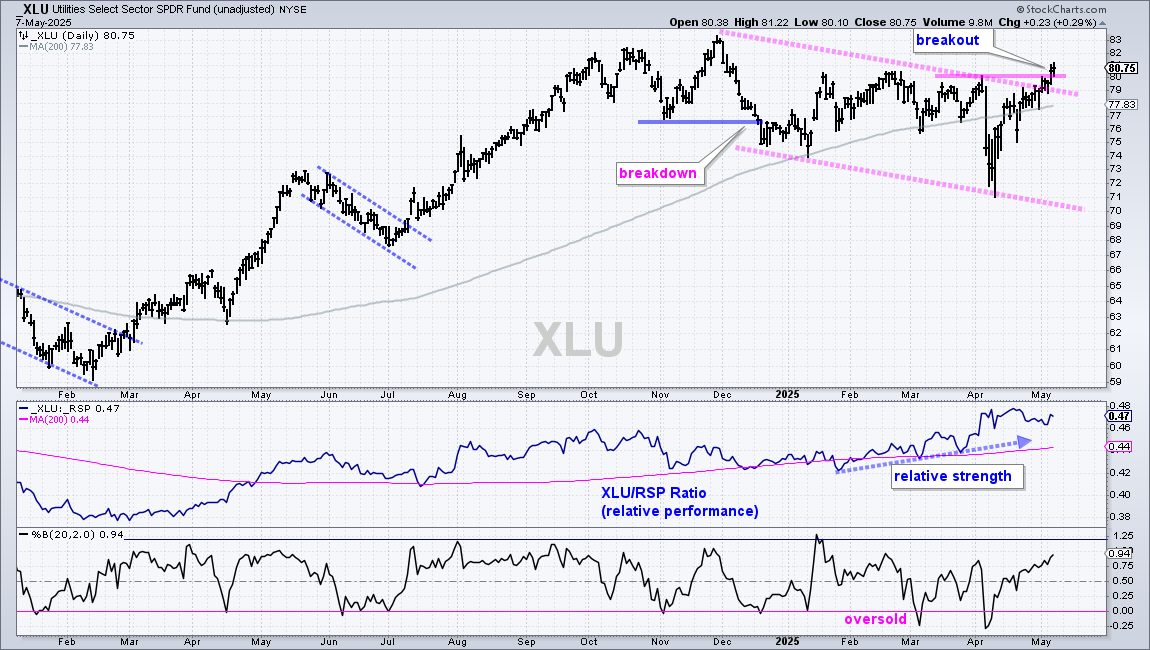
What about the Utilities SPDR (XLU)? XLU is trading above its rising 200-day SMA since April 22nd. The ETF broke its late March high on Tuesday and the price-relative (XLU/RSP ratio) is trading near its highs. QQQ is certainly sexier, but XLU has a stronger chart. The pink lines show a falling channel from December to April and a breakout occurring this week.

ETF Leaders

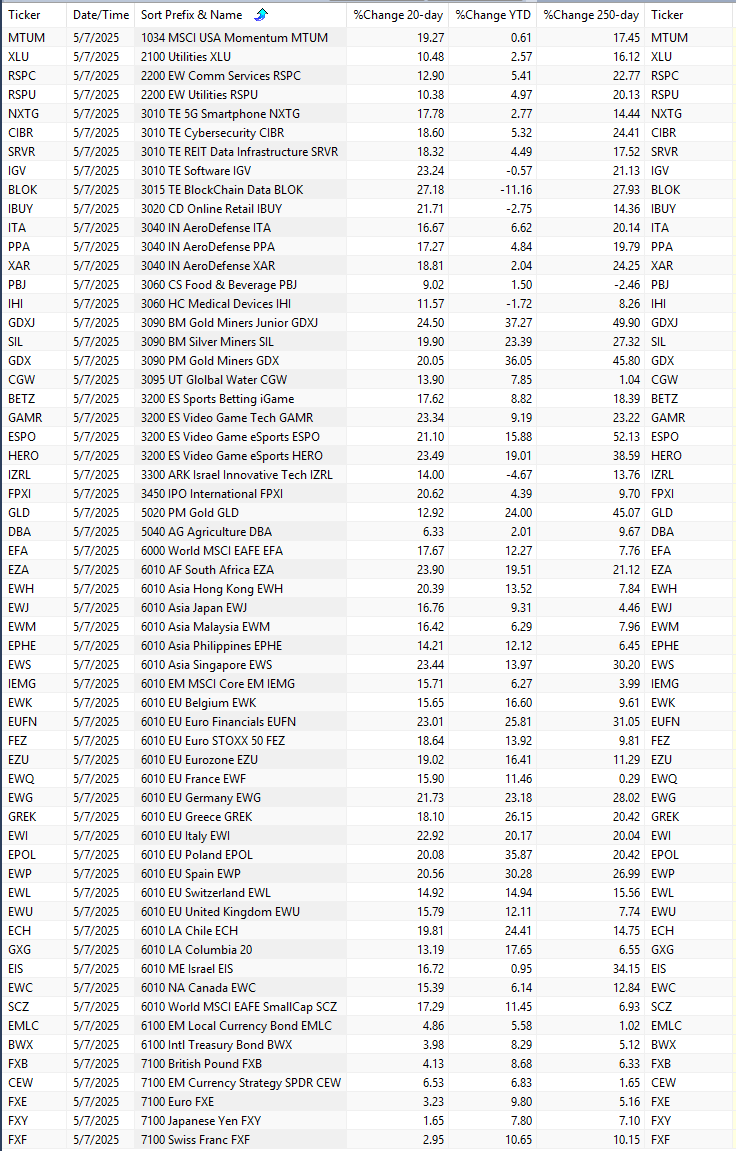
The image below shows ETFs that meet the leadership requirements:

  • Close is above 200-day SMA
  • 200-day SMA is rising (5-day ROC of 200-day SMA > 0)
  • Close is above late March high (30-day ROC > 0)
  • Price relative is above its 50 and 200-day SMAs (XLU:RSP ratio)

Notable qualifiers:

  • XLU is the only sector SPDR to qualify.
  • The S&P 500 Momentum ETF (MTUM) qualified.
  • Software (IGV) and cybersecurity (CIBR) are leading within the tech sector.
  • All three defense ETFs qualified (ITA, PPA, XAR)
  • Precious metals are leading (GLD, SLV, SIL, GDX)
  • The Medical Devices ETF (IHI) is the only healthcare-related ETF to qualify.
  • The Bitcoin ETF (IBIT) qualified.
  • Dozens of foreign ETFs are leading (EUFN, FEZ)*
  • (*Foreign ETFs are also benefitting from a weak Dollar).

MTUM, XLU, RSPC, RSPU, NXTG, CIBR, SRVR, IGV, BLOK, IBUY, ITA, PPA, XAR, PBJ, IHI, GDXJ, SIL, GDX, CGW, BETZ, GAMR, ESPO, HERO, IZRL, FPXI, GLD, DBA, EFA, EZA, EWH, EWJ, EWM, EPHE, EWS, IEMG, EWK, EUFN, FEZ, EZU, EWQ, EWG, GREK, EWI, EPOL, EWP, EWL, EWU, ECH, GXG, EIS, EWC, SCZ, EMLC, BWX, FXB, CEW, FXE, FXY, FXF, IBIT
Bitcoin ETF Holds Strong

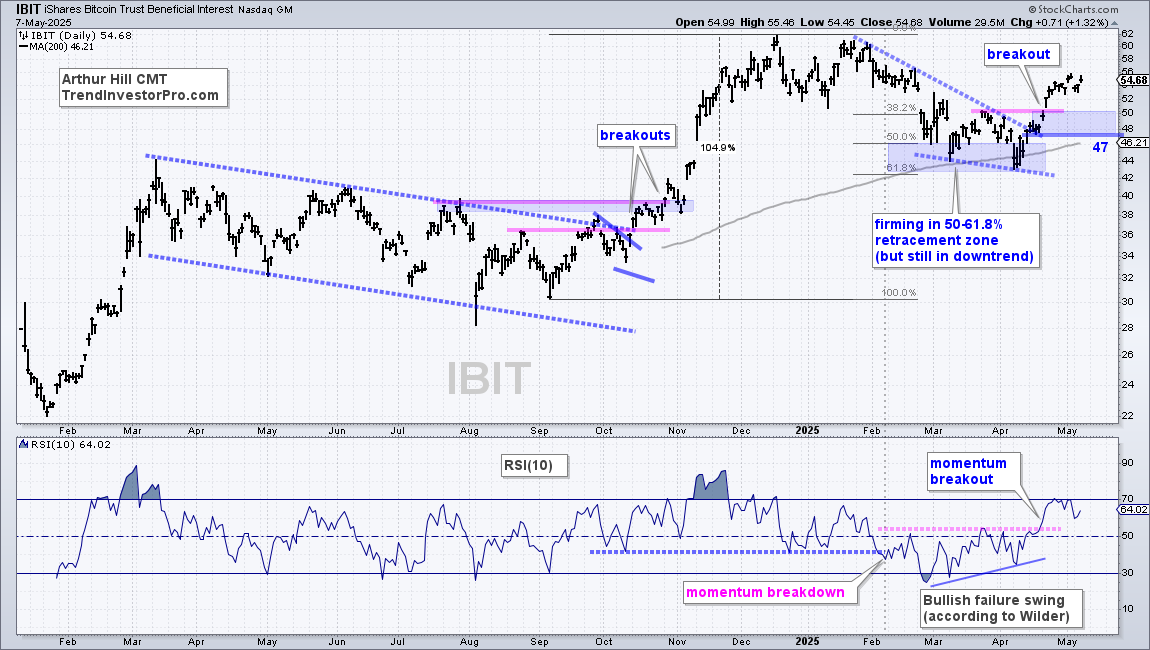
There is no change in the Bitcoin ETF (IBIT), which was featured on April 17th with a bullish setup. IBIT broke out with a surge on April 21st and exceeded its late March high on April 22nd. IBIT was one of the first to break its late March high. The breakout zone in the 47-50 area turns into first support. A close below 47 would negate this breakout.

Gold SPDR Breaks Out of Small Wedge

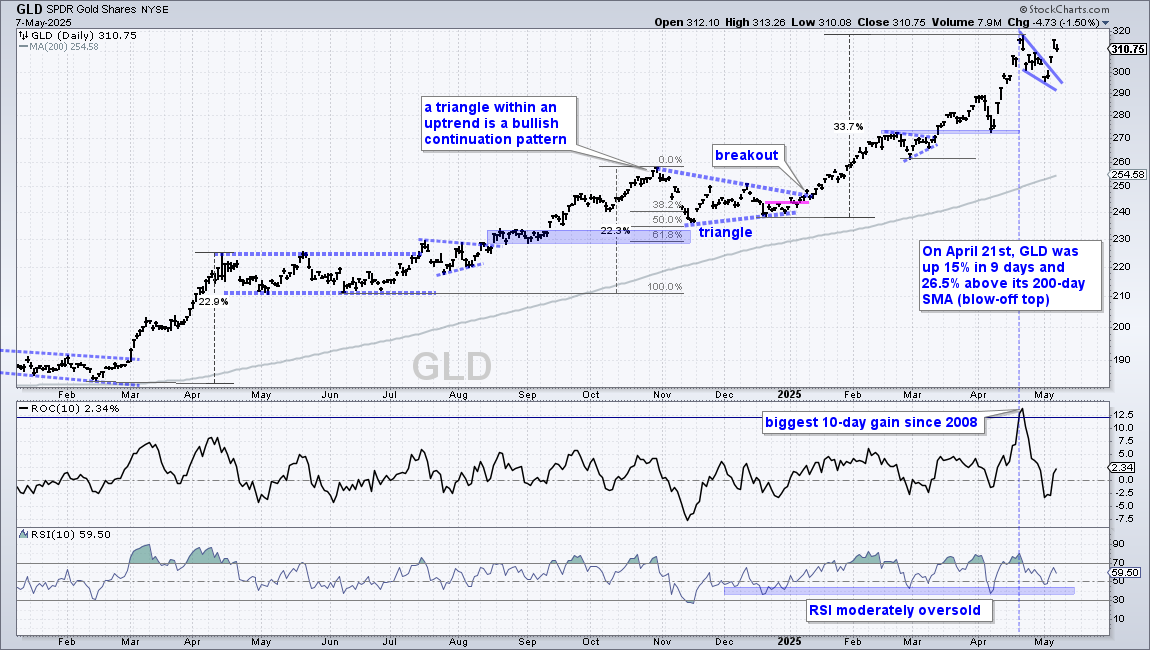
The Gold SPDR (GLD) surged to new highs with a 9-day 15% surge from April 7th to 21st. GLD was already looking frothy and added to the froth. There was a short falling wedge pullback last week and a breakout on Monday. GLD is back near its highs. I do not view the small falling wedge as a “decent” pullback because RSI did not become moderately oversold (~40) and %B (not shown) did not dip below 0. Overall, I still think gold experienced a blow-off on April 21st and is likely to consolidate or correct after this excess.

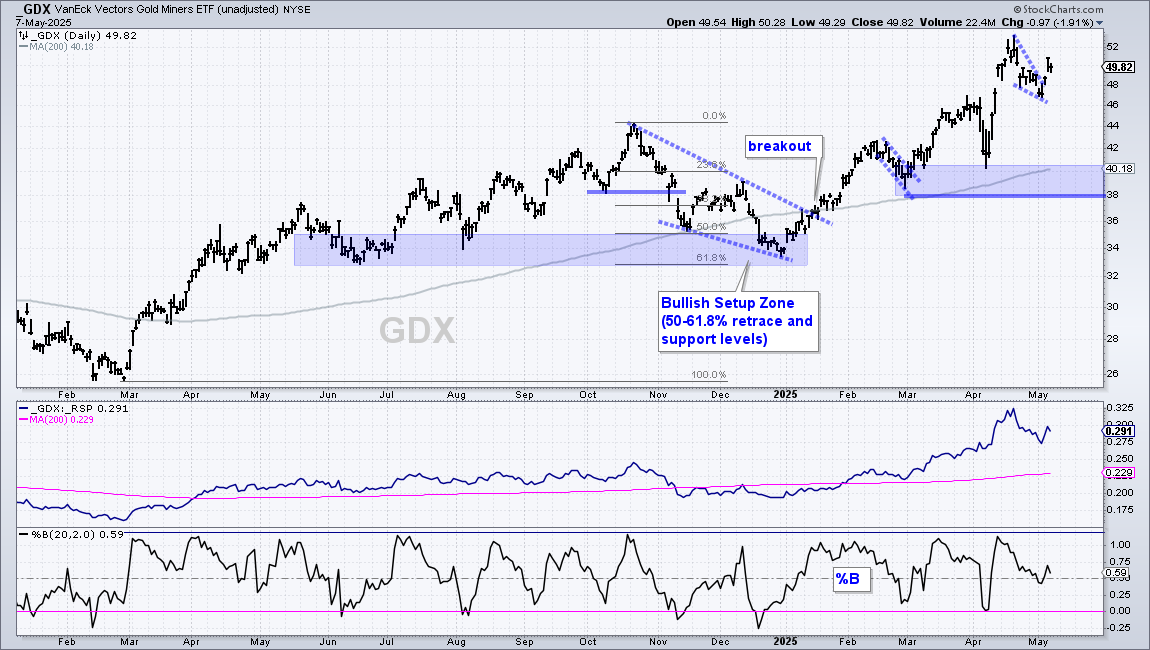
The next chart shows the Gold Miners ETF (GDX) with a small wedge breakout. It is hard to get excited about GDX when GLD just went through a blowoff top phase.

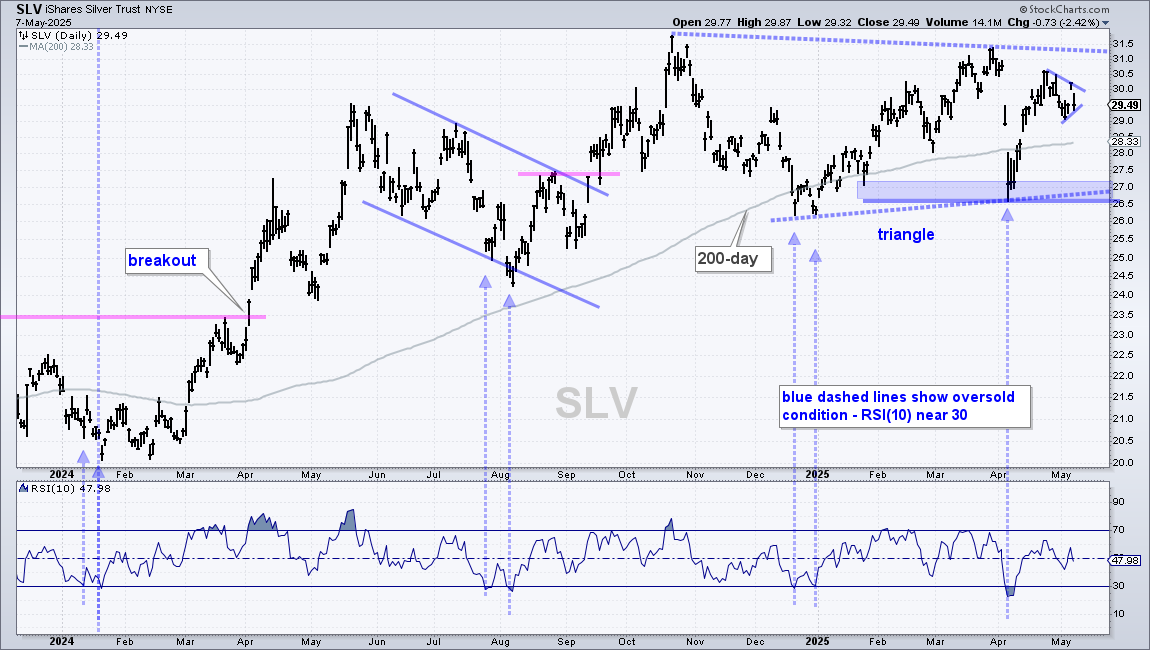
The next chart shows the Silver ETF (SLV) with a large triangle consolidation since November. SLV surged back above the rising 200-day SMA in mid April and then formed a pennant. A break above Tuesday’s high would be short-term bullish and increase the chances of a bigger triangle breakout.

UNG Holds April Reversal

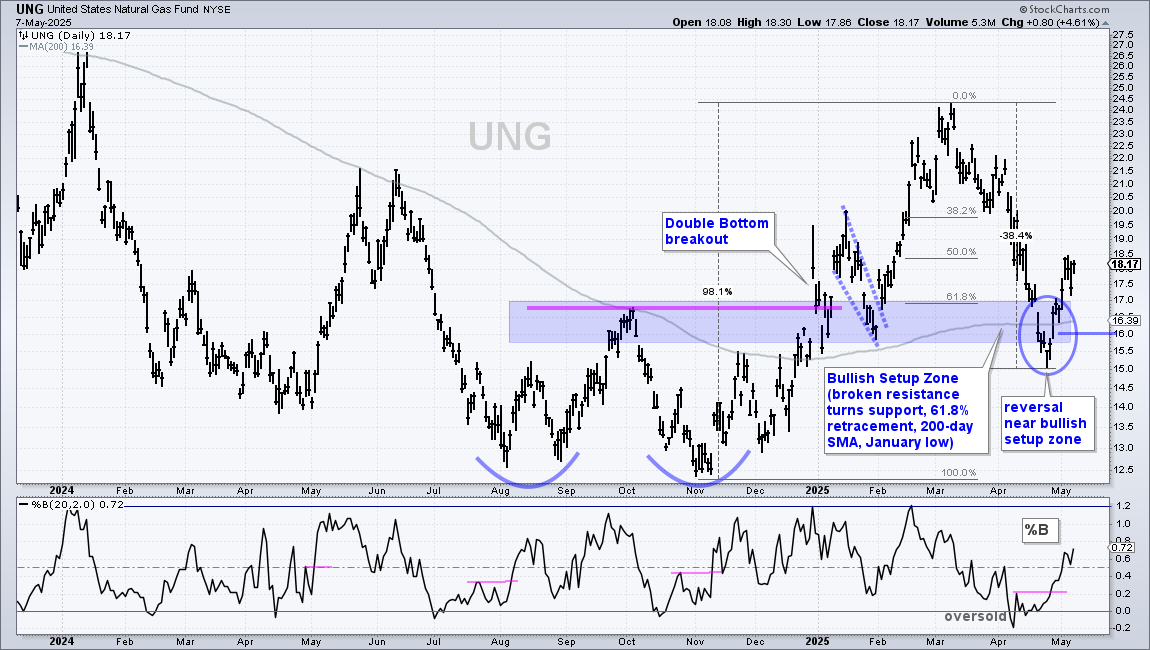
The next chart shows the Natural Gas ETF (UNG) with a reversal off the Bullish Setup Zone in late April. A close below 16 would negate this setup. UNG has above average volatility and risk. It is often a good idea to book some profits when possible (take 1/3 to 1/2 off the table). Traders can then set a stop-loss to ensure the entire trade does not evolve into a loser.

DBA Stalls near Breakout Zone

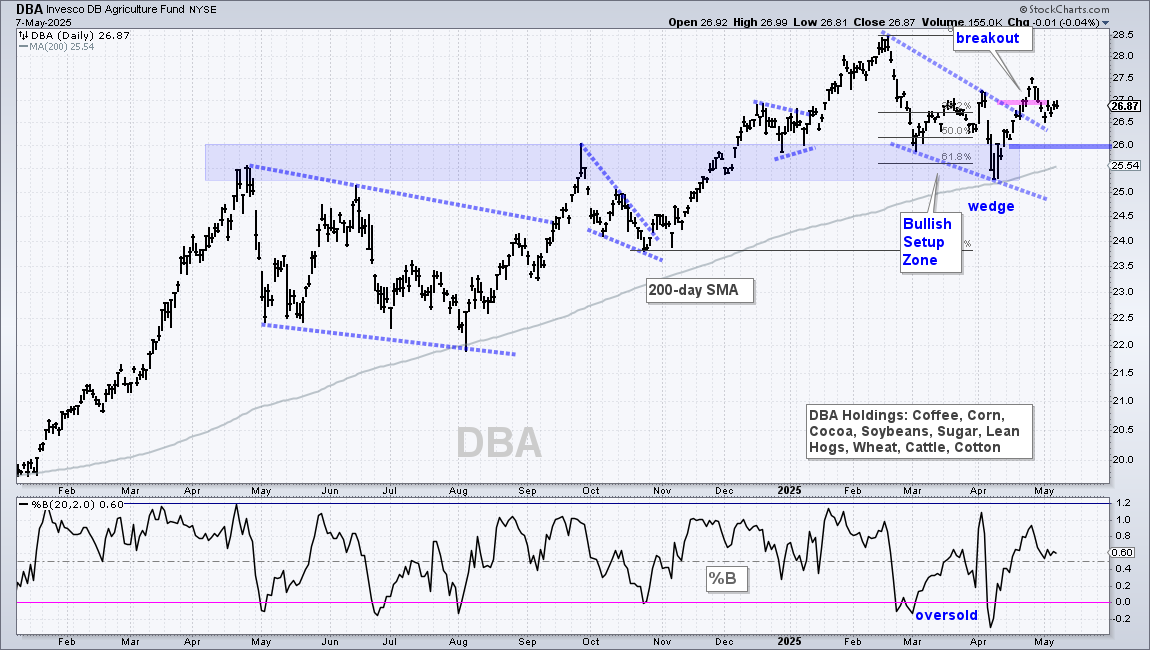
The next chart shows the DB Agriculture ETF (DBA) holding the rising 200-day SMA during the March-April pullback and breaking out in late April. DBA is stalling around the breakout zone, but I still view the breakout as bullish. A close below 26 would argue for a re-evaluation.

MLP ETF Forms Bull Flag

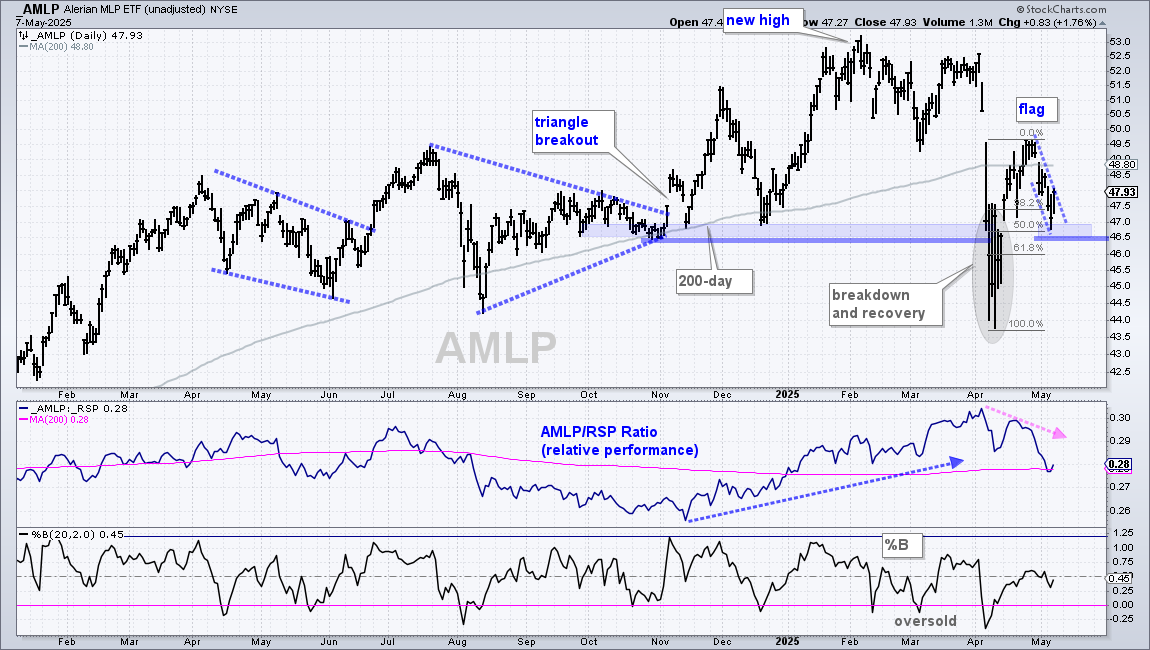
The MLP ETF (AMLP) was leading in the first quarter, but got clobbered in early April with a massive decline. The ETF recovered with a surge back above the 200-day SMA, and then fell back the last two weeks. I am featuring this chart because the decline looks like a bull flag and the ETF is in a Bullish Setup Zone. Falling flags represent corrections after a sharp advance (bullish continuation patterns). AMLP is in a bullish setup zone because this decline retraced around 50% of the April surge and there is support in the 46.5 area. AMLP is making a breakout bid with a 1.76% surge on Wednesday. A close below 46.5 would negate this setup.

Send feedback to support(at)trendinvestorpro.com or use the contact form. 

Thanks for tuning in and have a great day!
Scroll to Top