IFRA Breaks March Resistance with Relative Strength
AMLP Forms Small Wedge
Leading Uptrends without Setups (XLF, XLC, XLI, ITA, IHI, IYZ)
Stocks Extend on Thrust Signals
Here we go again. Negative tariff news on Friday weighed on stocks, and positive tariff news lifted stocks on Monday-Tuesday. Last week’s drop and today’s pop do not change the situation in the markets. SPY and QQQ broke out with gap-surges on May 12th. Even though May 12th represents another tariff-related event, these breakouts and gaps are holding, and bullish until proven otherwise.
Short-term, stocks were quite extended after big gains from April 7th to May 19th. There were short pullbacks last week, but these pullbacks were too short for bullish patterns to emerge and too shallow for short-term oversold conditions. This puts stocks in wait-and-see mode. Medium-long term, the breaks above the 200-day SMAs are bullish.
Short-term, stocks are still extended and ripe for a corrective period, which could involve a pullback or consolidation. After steep advances, we often see some sort of slow zigzag advance unfold. As the zigzag implies, there are pullbacks, higher lows and then higher highs. I will be watching for tradable pullbacks as long as SPY and QQQ hold their breakouts.
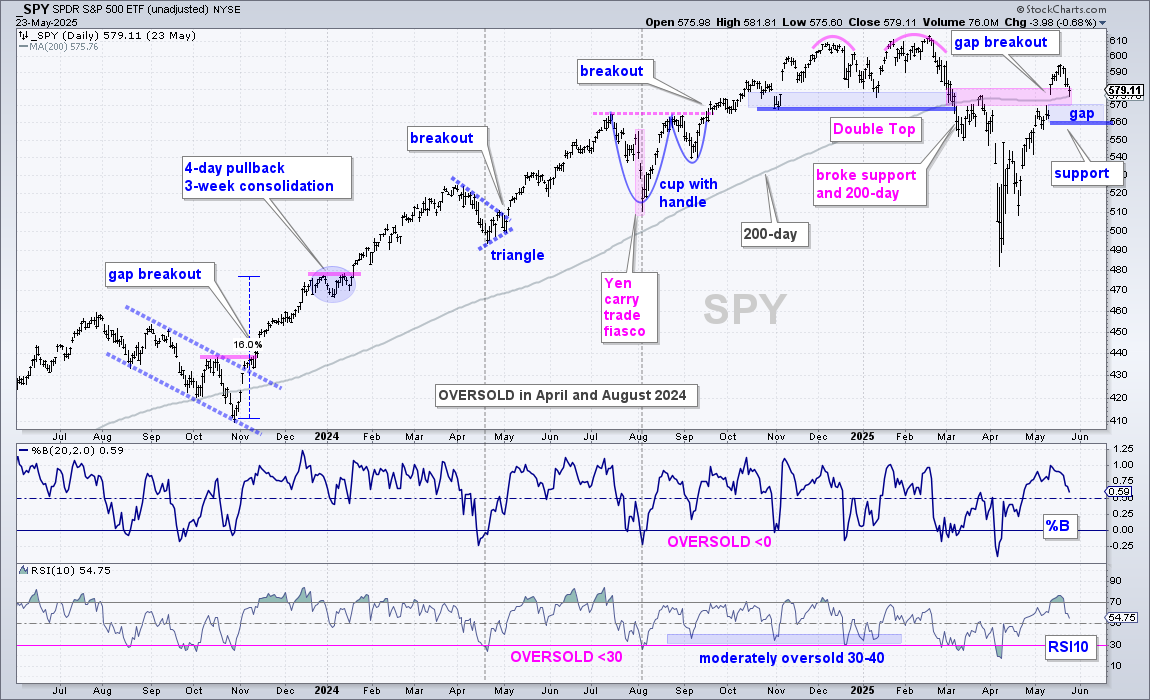
SPY turned bullish with a break above resistance at 580 and a gap-surge above the 200-day SMA, which turned up last week. This breakout also negated the Double Top breakdown. This breakout is bullish until proven otherwise with the gap-surge holding the key. A close below 560 would completely erase this gap-breakout and argue for a re-evaluation.
Short-term, SPY is testing the gap zone and 200-day SMA with a short 4-day pullback. %B and RSI(10) are not even moderately oversold at this stage. 4-day pullbacks are too short-term for me. I prefer an oversold condition and/or a 3-6 week pattern, which means waiting for a tradable setup. The blue oval shows a 4-day pullback in early January 2024, after the 16% surge. SPY quickly bounced, but this evolved into a 3 week consolidation with a breakout on January 19th.
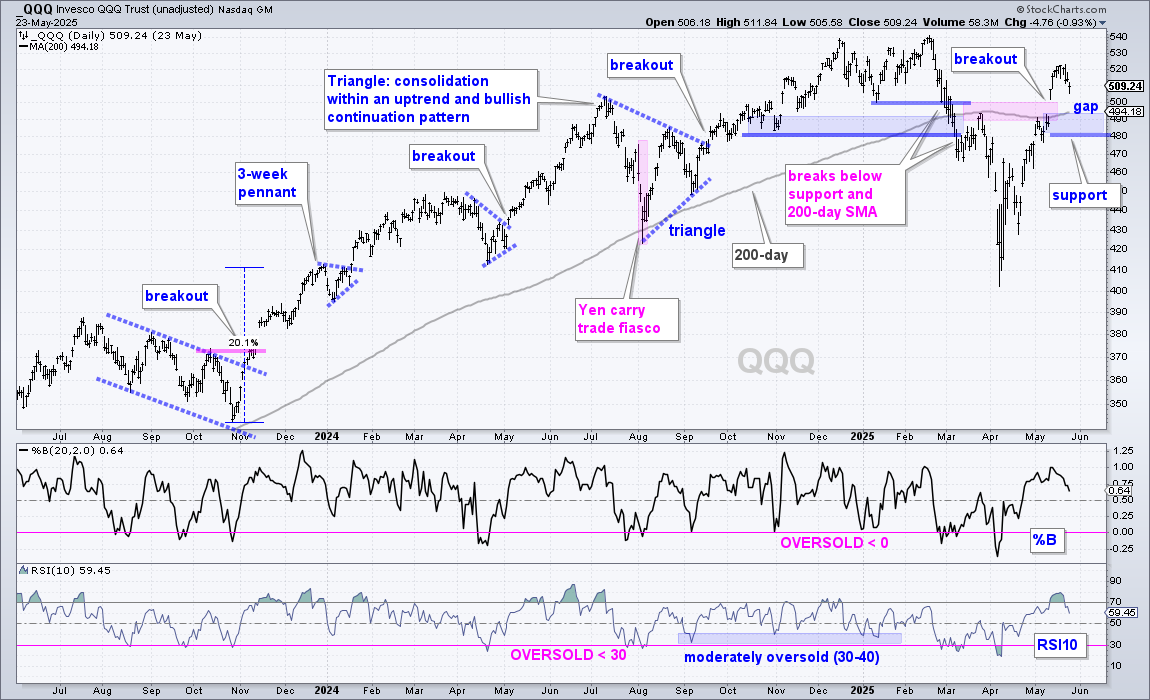
The next chart shows QQQ with a gap, surge and breakout at 500. This move broke the late March high and the 200-day SMA, which turned up this past week. Thus, SPY and QQQ are both above their rising 200-day SMAs. The gap zone, 200-day SMA and a buffer mark support in the 480-500 area. A close below 480 would erase this breakout and call for a re-evaluation.
QQQ surged 20% from late October to late December 2023 and then fell sharply for four days. The ETF quickly rebounded with a pennant taking shape and there was a breakout on January 19th. Right now, I only see a short 4-day pullback that could lead to a bounce. I do not see a short-term bullish pattern and the momentum oscillators are not even close to oversold levels.
Four Leading Groups
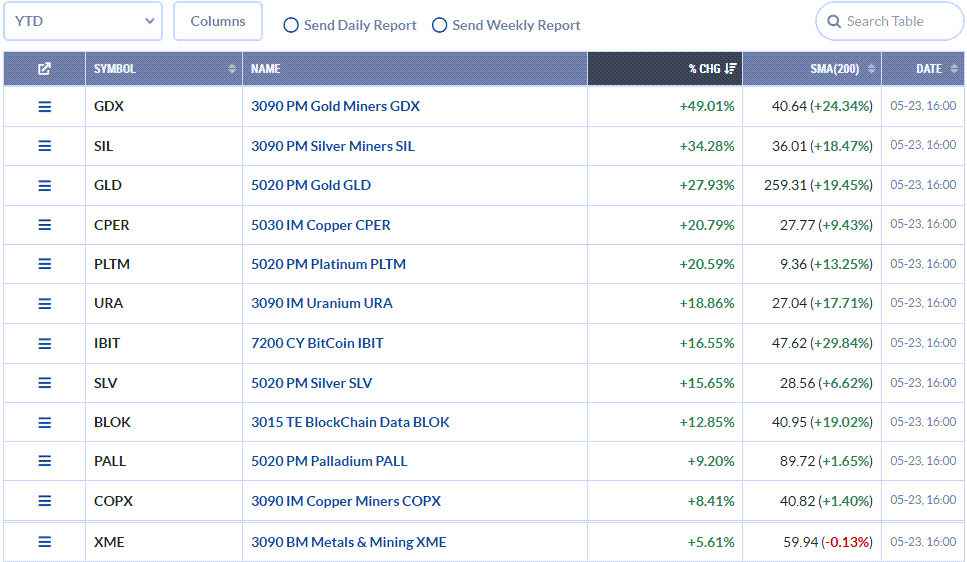
There are four leading groups year-to-date: commodities, crypto, defensive and tech. I am using year-to-date metrics because this five month period includes the meltdown into early April and melt-up into May. First, we have commodity-related ETFs and Bitcoin leading with the biggest year-to-date gains. These include the Gold Miners ETF (GDX), Gold SPDR (GLD), Silver Miners ETF (SIL), Copper ETF (CPER), Platinum ETF (PLTM) and Bitcoin ETF (IBIT). The image below shows these leaders sorted by the year-to-date change (%CHG).
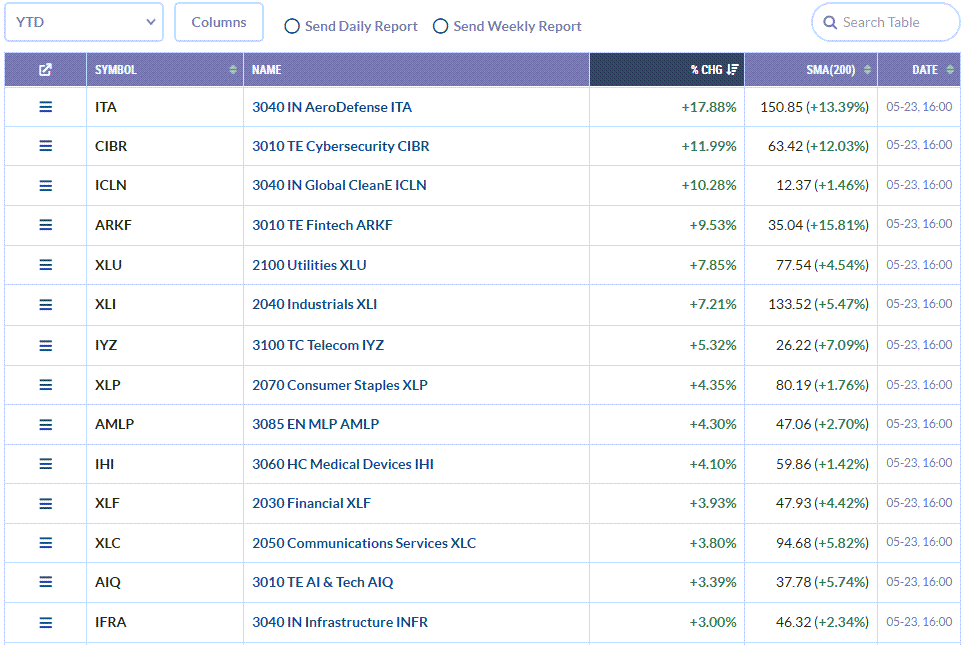
Second, the leading equity ETFs are defensive and tech related. Defensive ETFs with the leading year-to-date gains include the Aerospace & Defense ETF (ITA), Telecom ETF (IYZ), MLP ETF (AMLP), Utilities SPDR (XLU) and Consumer Staples SPDR (XLP). Tech ETFs with leading year-to-date gains include Cybersecurity ETF (CIBR), ARK Fintech Innovation ETF (ARKF), Communication Services SPDR (XLC), Global AI & Tech ETF (AIQ), Internet ETF (FDN) and Transformational Data Sharing ETF (BLOK). The image below shows these leaders sorted by the year-to-date change (%CHG).
Technology SPDR and AI ETF Hold Breakouts
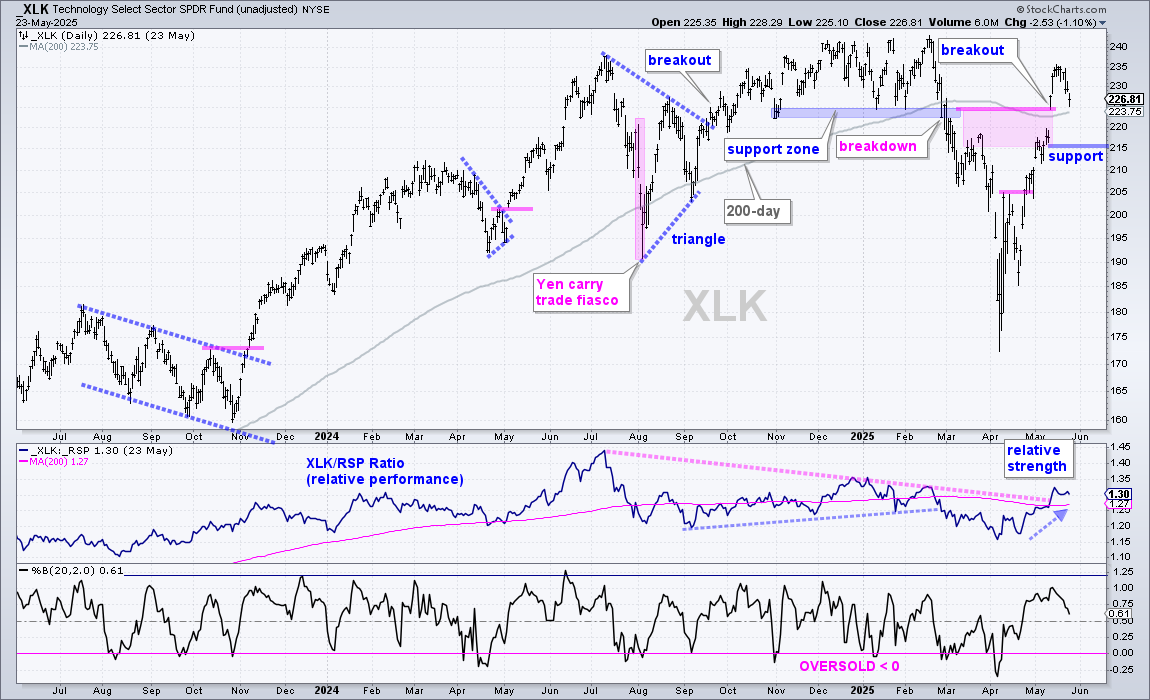
The chart below shows the Technology SPDR (XLK) dipping below 180 during the April meltdown and surging above 200 with the recovery. XLK is still below its January-February highs, but up year-to-date and above its 200-day SMA, which turned up this past week. As with SPY and QQQ, XLK is rated “long-term uptrend” as long as this gap-breakout holds. A close below 215 would negate the breakout, fill the gap and put XLK back below the 200-day SMA. The middle window shows the price-relative (XLK/RSP ratio turning up in late April and moving above its 200-day SMA in May. This means XLK is starting to outperform the broader market (RSP), which is positive for the sector.
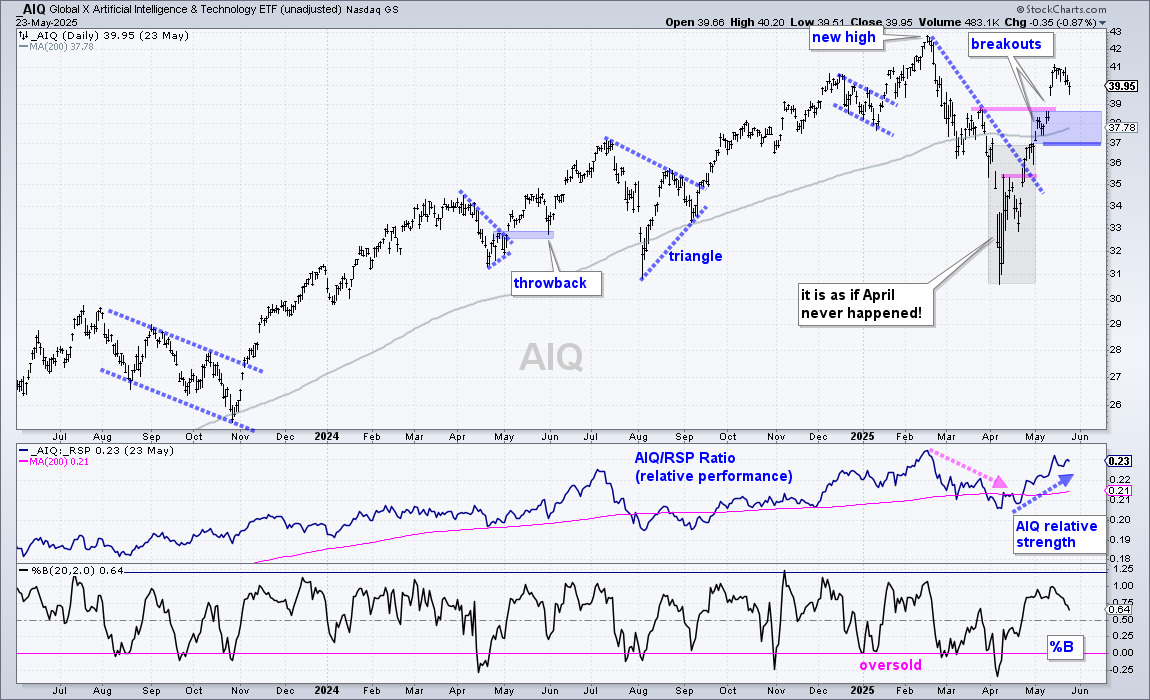
The next chart shows the Global AI & Tech ETF (AIQ) with a gap, surge and breakout in early May. The blue shading marks this breakout zone with support at 37.
Cybersecurity ETF Challenges February High
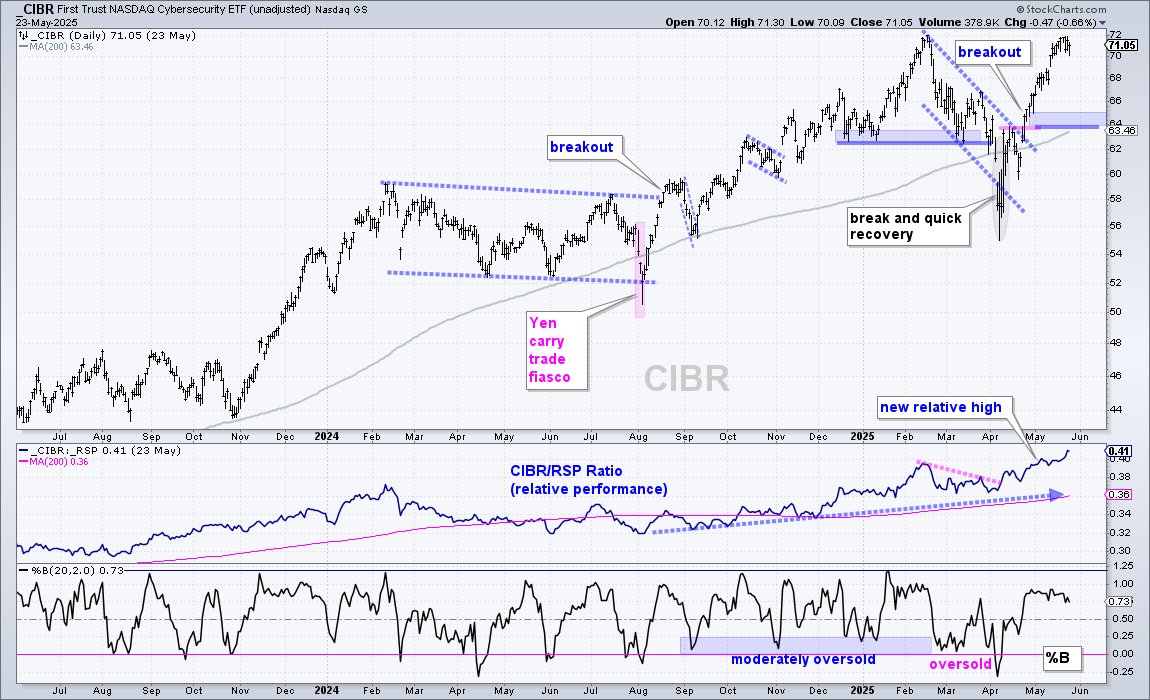
ETFs trading at or recording 52-week highs in May are leading (ITA). ETFs trading near their 2025 highs are next in line because they are poised to record 52-week highs. XLK is still well below its 2025 highs, but the CIBR is knocking on the door as it trades above 70. The February high is around 72 and a break here would forge a new high. The last setup was the falling wedge and quick recovery with the breakout in late April. I do not see a setup on this chart, just a leading uptrend. The middle window shows the price-relative hitting new highs throughout May as CIBR continues to show relative strength.
MAGS and ARKF Form Small Flags
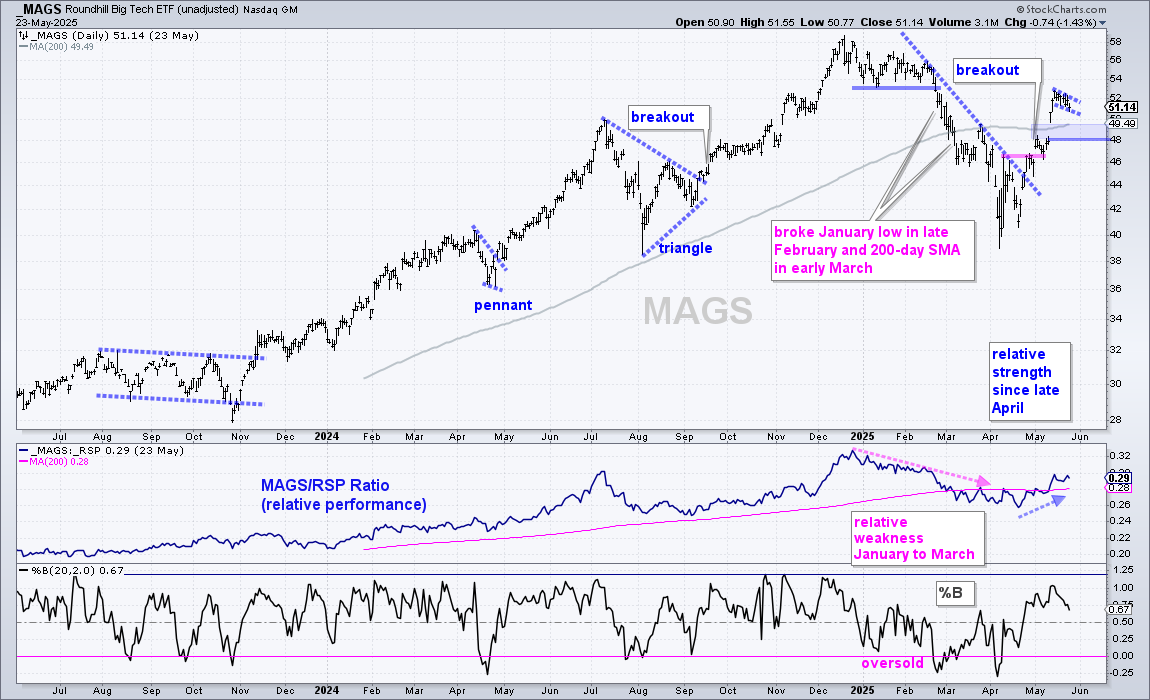
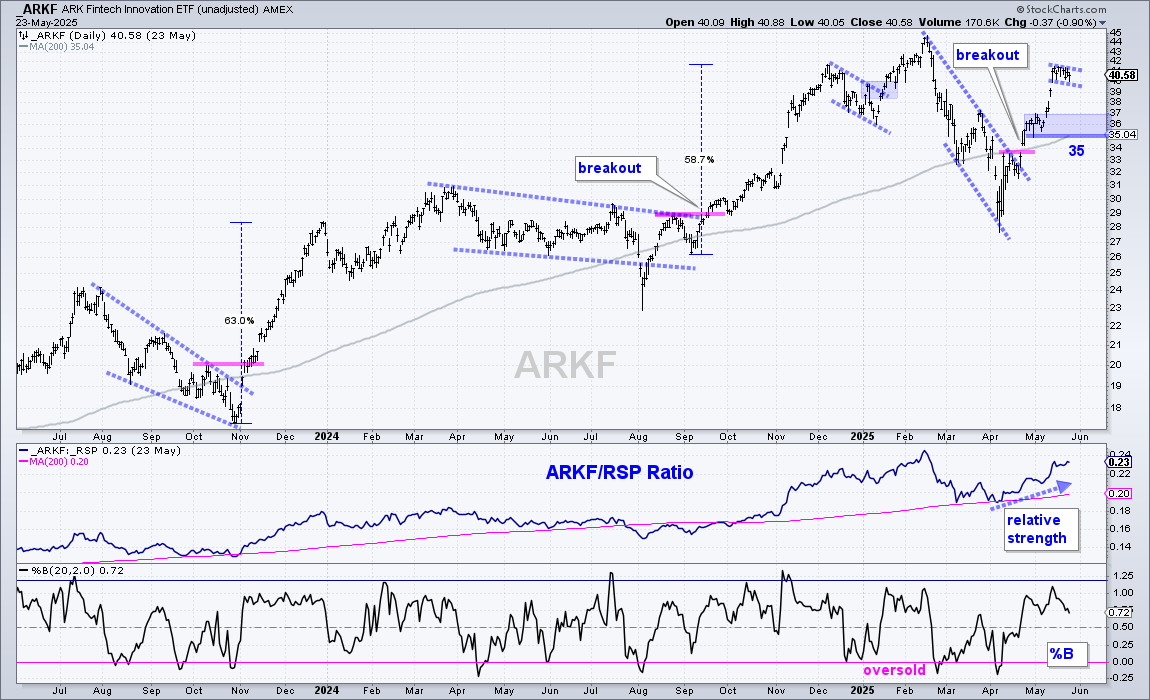
The next charts show the Mag7 ETF (MAGS) and ARK Fintech Innovation ETF (ARKF) with small flags forming last week. These are short-term bullish continuation patterns represent a rest after the surge and a breakout would open the door to further gains, perhaps even a challenge to the February highs. Keep in mind the short-term high and tight flags are just that, short-term patterns. Short-term price action is noisier and these patterns are more prone to whipsaws. A breakout and then move below the flag lows is an example of a whipsaw. A move below the flag lows would not affect the long-term trends. Instead, it would likely lead to an oversold condition that could provide another opportunity.
XLU Holds Breakout and Relative Uptrend
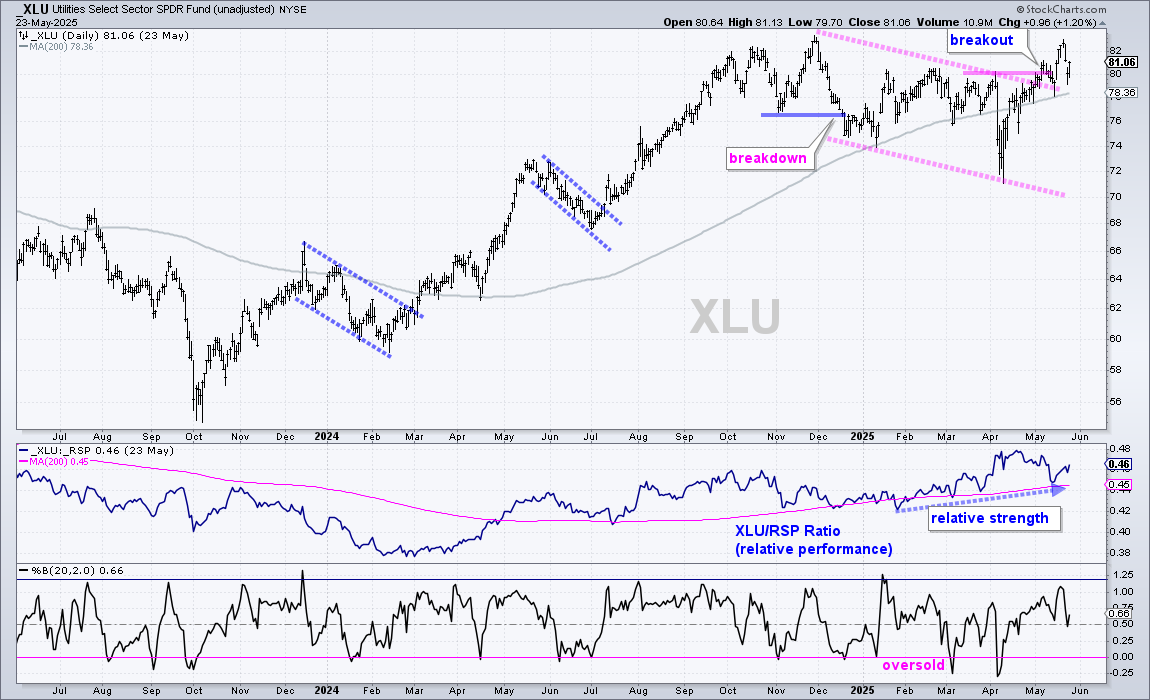
The Utilities SPDR (XLU) struggled from December to April, but struggled less than the broader market and showed relative strength. Overall, a falling channel formed from the December high to the April low and XLU broke out with a surge in early May. Trading turned choppy around the breakout zone, but the breakout is holding, and bullish. XLU is back above its 200-day SMA, which never stopped rising. The middle window shows the price-relative (XLU/RSP ratio) turning up in February and moving higher as XLU outperforms RSP.
IFRA Breaks March Resistance with Relative Strength
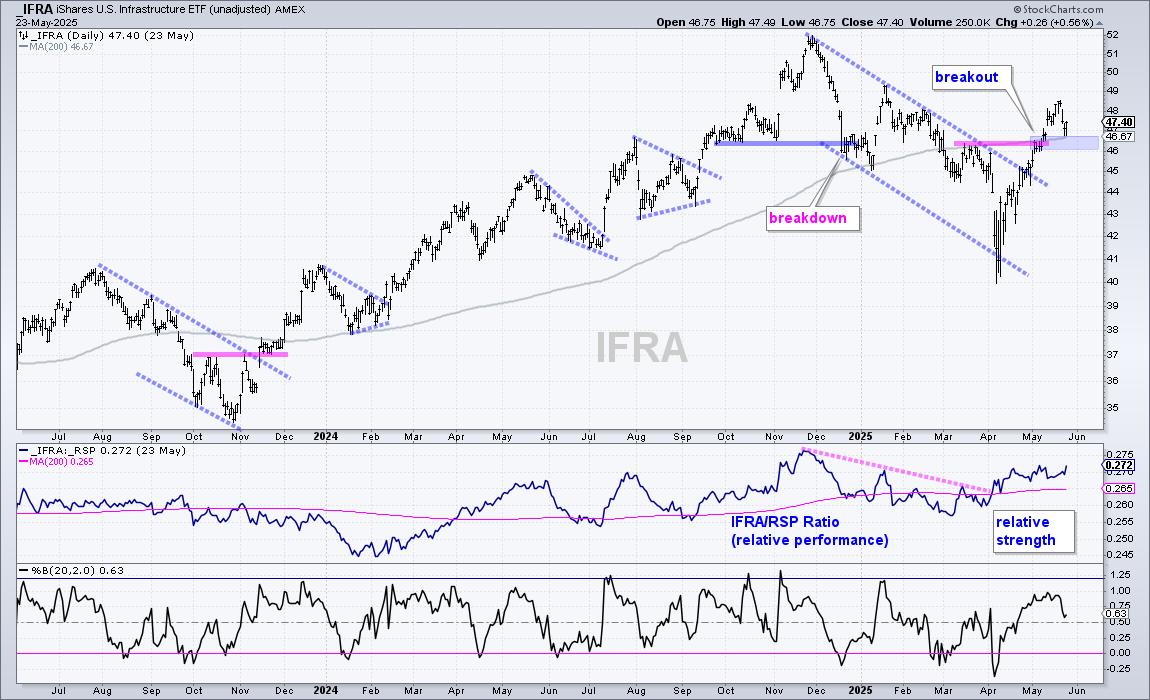
The Infrastructure ETF (IFRA) is dominated by three sectors: Utilities (41.68%), Industrials (32.50%) and Materials (18.55%). XLU and XLI are strong and these two sectors account for over 70% of the ETF. On the price chart, IFRA formed a long falling channel from December to April and broke out in early May. The breakout zone turns first support in the 46 area. A close below 46 would put IFRA back below the 200-day SMA and negate the breakout. The indicator window shows the price-relative (IFRA/RSP ratio) turning up in April and breaking above its 200-day SMA. IFRA is showing relative strength the last two months.
AMLP Forms Small Wedge
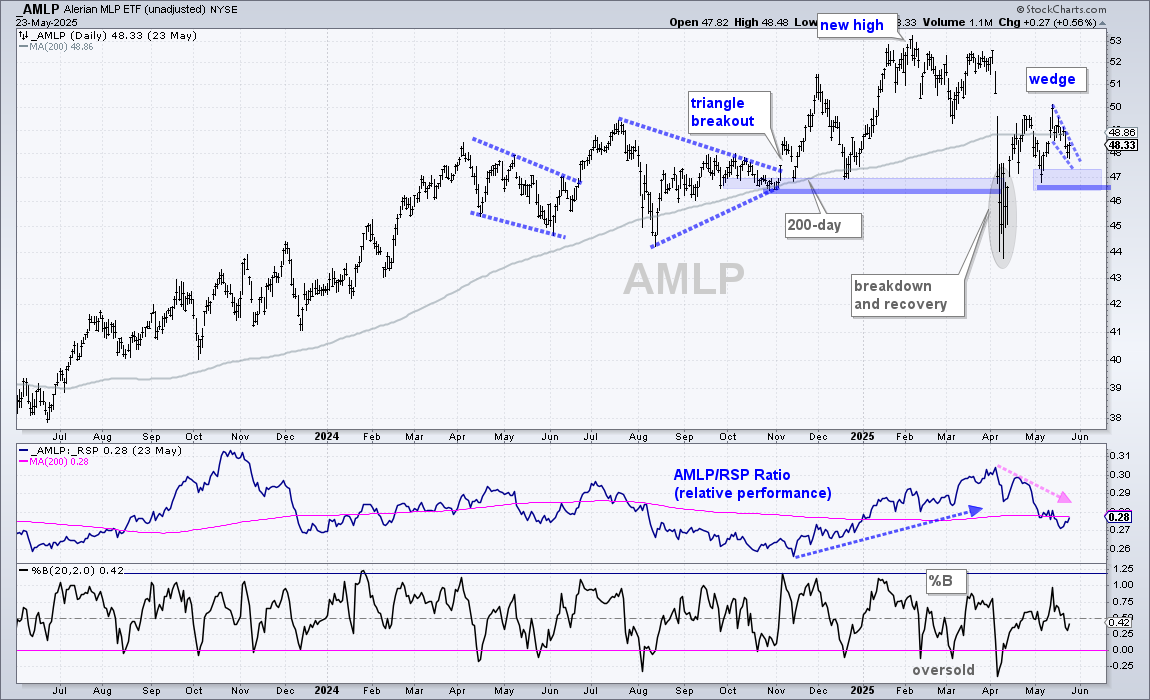
The MLP ETF (AMLP) broke down in early April, quickly recovered and consolidated above the recovery level (46.5). Overall, I still see an uptrend on this chart, but the 200-day SMA is flattening and the price-relative (AMLP/RSP ratio) moved below its 200-day SMA. Short-term, a small falling wedge formed as the ETF pulled back and I view this as a short-term bullish setup. A breakout at 49 would recapture the 200-day SMA and keep the longer term uptrend alive. A close below 46.5 would break support and be bearish.
Leading Uptrends without Setups (XLF, XLC, XLI, ITA, IHI, IYZ)
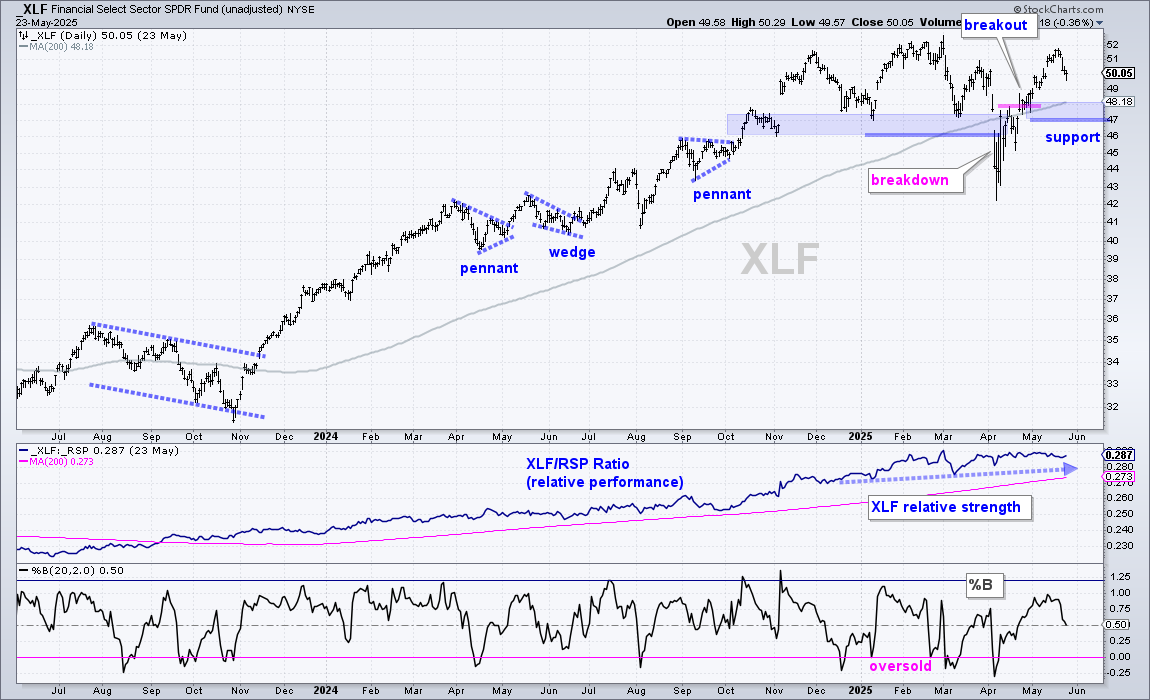
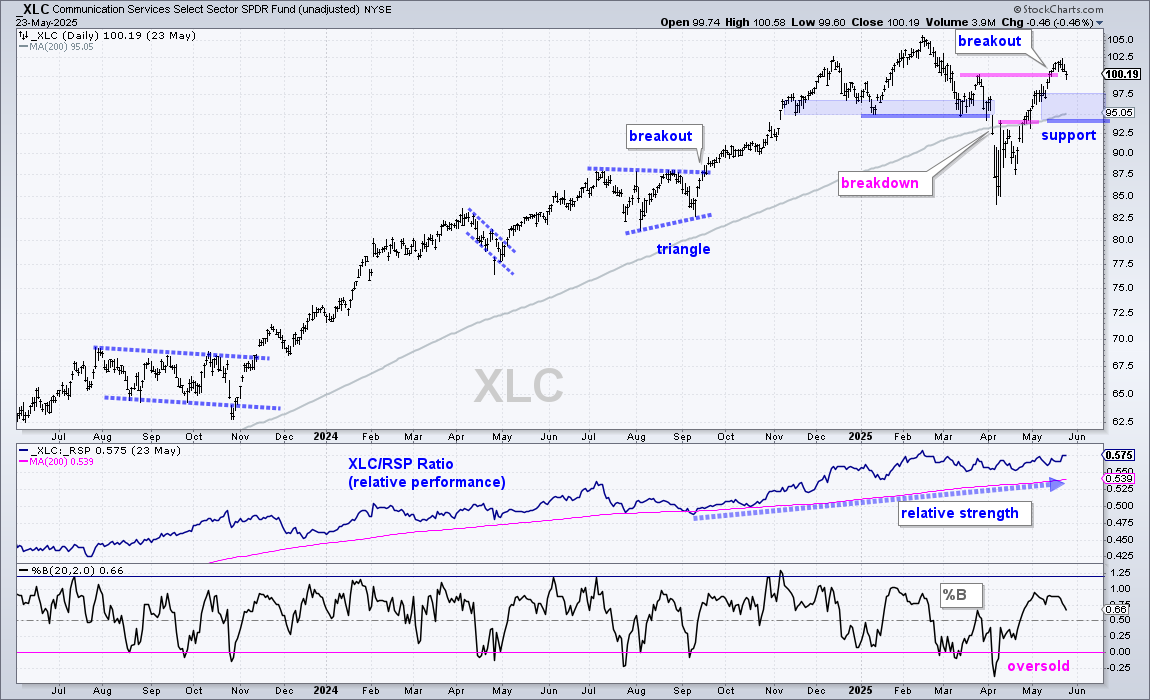
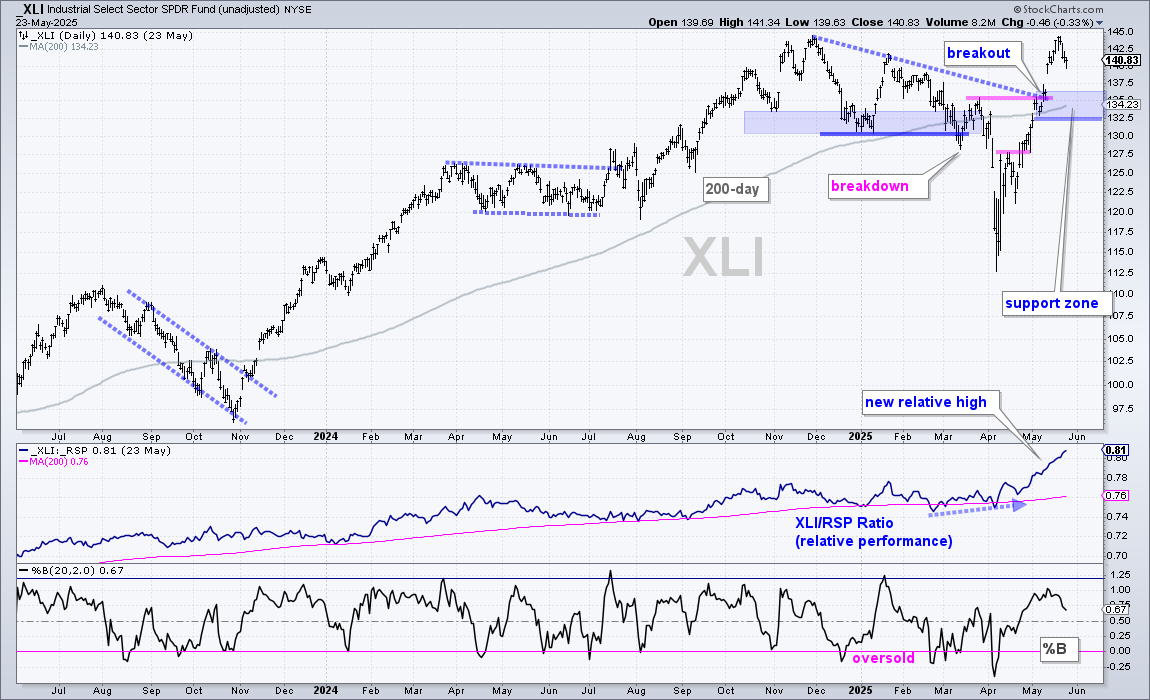
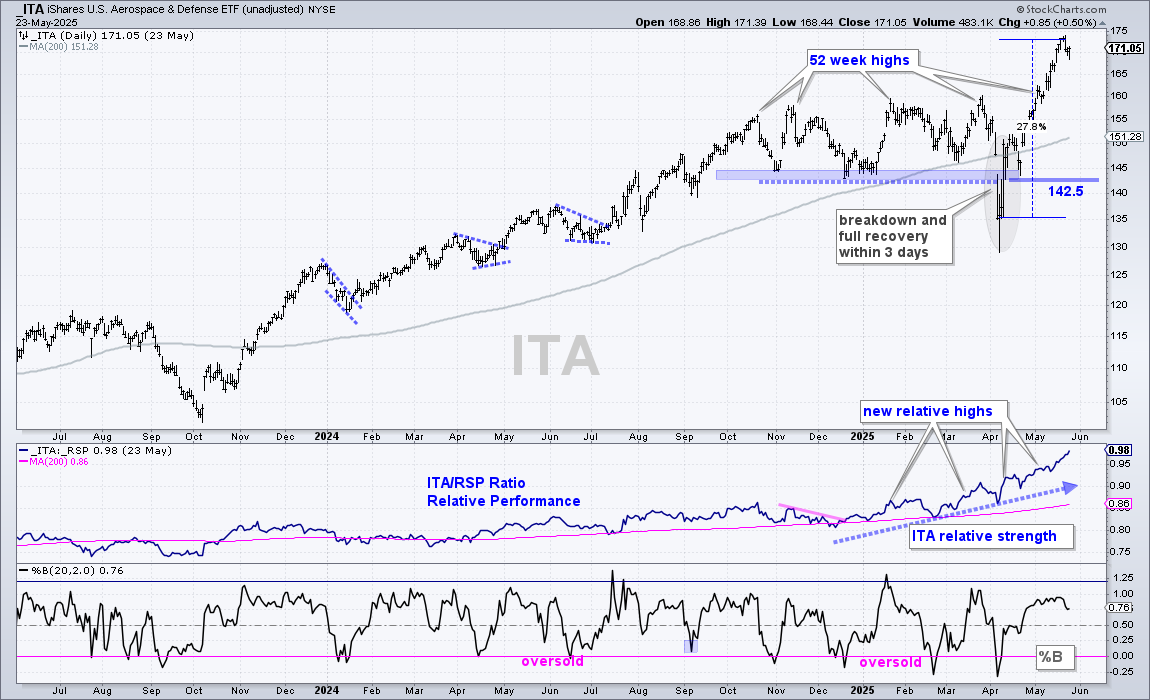
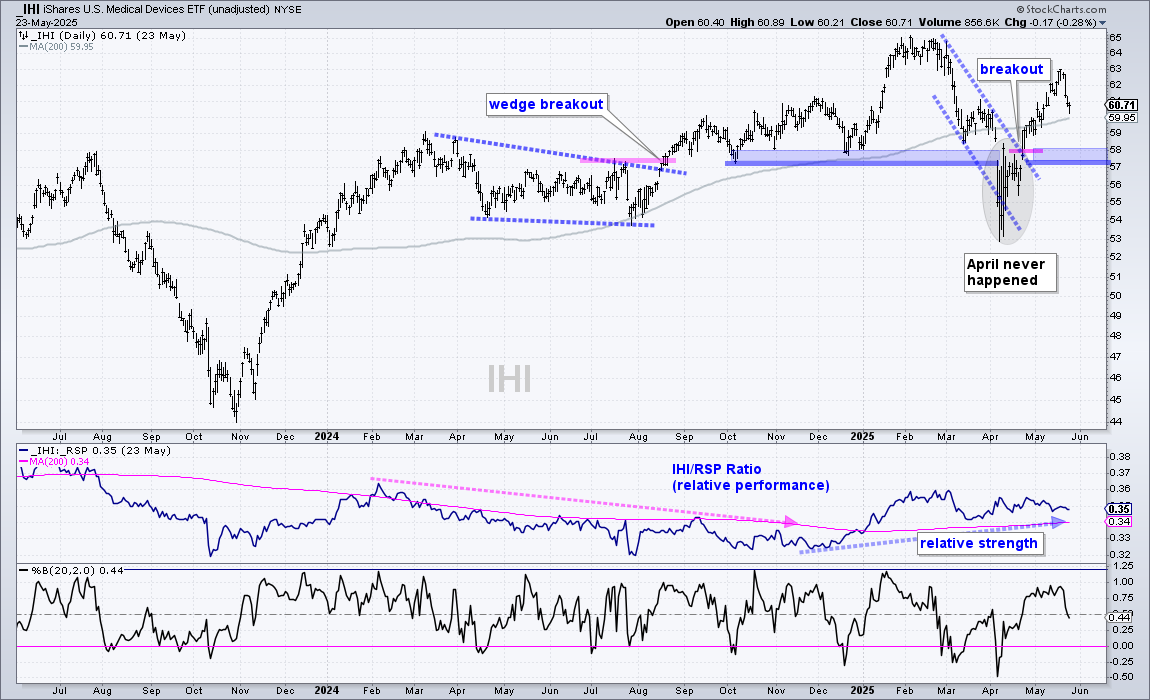
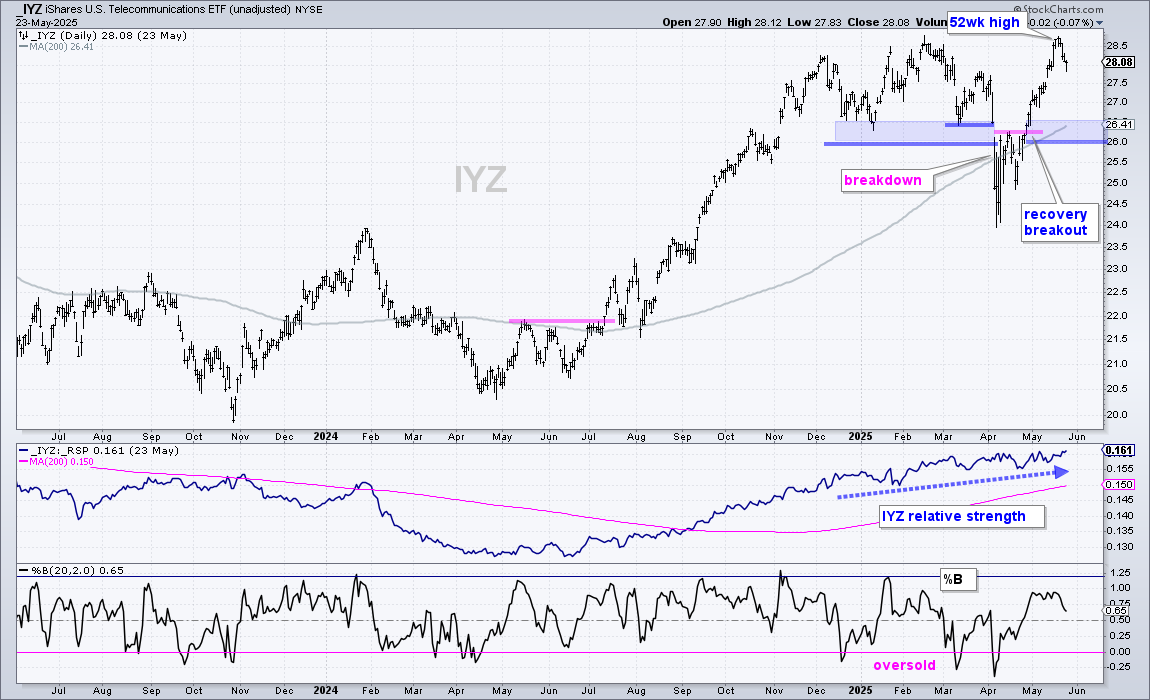
The next group of ETFs are leading the market with either a new high (ITA, IYZ) or strong recovery breakouts in May (XLF, XLI, XLC). The price-relatives (middle windows) are in uptrends and near new highs. This means they also show relative strength. Most pulled back last week with four day declines, but I do not see a short-term setup, such as a bull flag or falling wedge. These pullbacks could give way to a mean-reversion bounce, but I am holding out for a better setup.
Send feedback to support(at)trendinvestorpro.com or use the contact form.