")
This content is for subscribers. (Login or Subscribe)

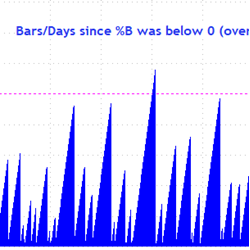
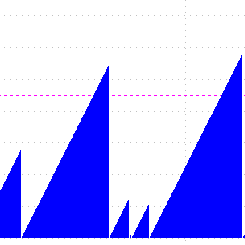
Market Conditions in One Chart – Plus XLV, IHI, XLU, KIE, URA, $BTCUSD, IBIT, BLOK
Today’s report starts with one paragraph and one chart summing up current market conditions, which are bullish. Techs are lagging the last five weeks, but other parts of the market are picking up the slack. Attention then turns to ETFs with bullish setups or signals. ETF related to Healthcare, Insurance and Blockchain
Market Conditions in One Chart – Plus XLV, IHI, XLU, KIE, URA, $BTCUSD, IBIT, BLOK Read More »