")
Moment of truth for Bonds – Copper and Base Metals ETFs Set Up – Bitcoin Oversold
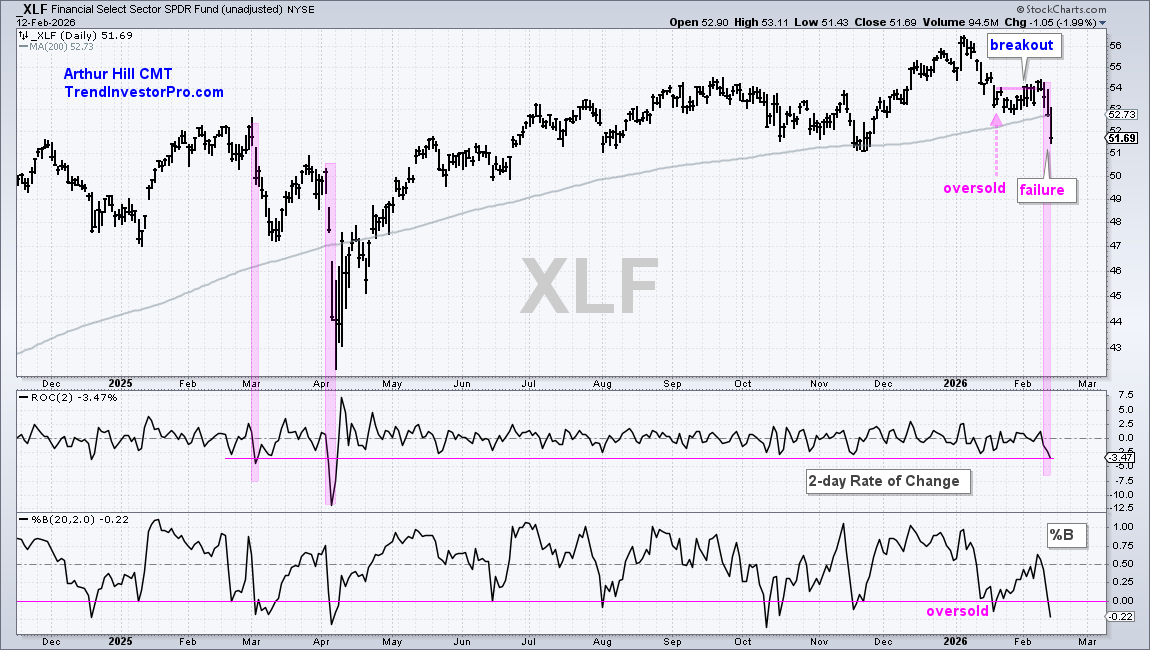
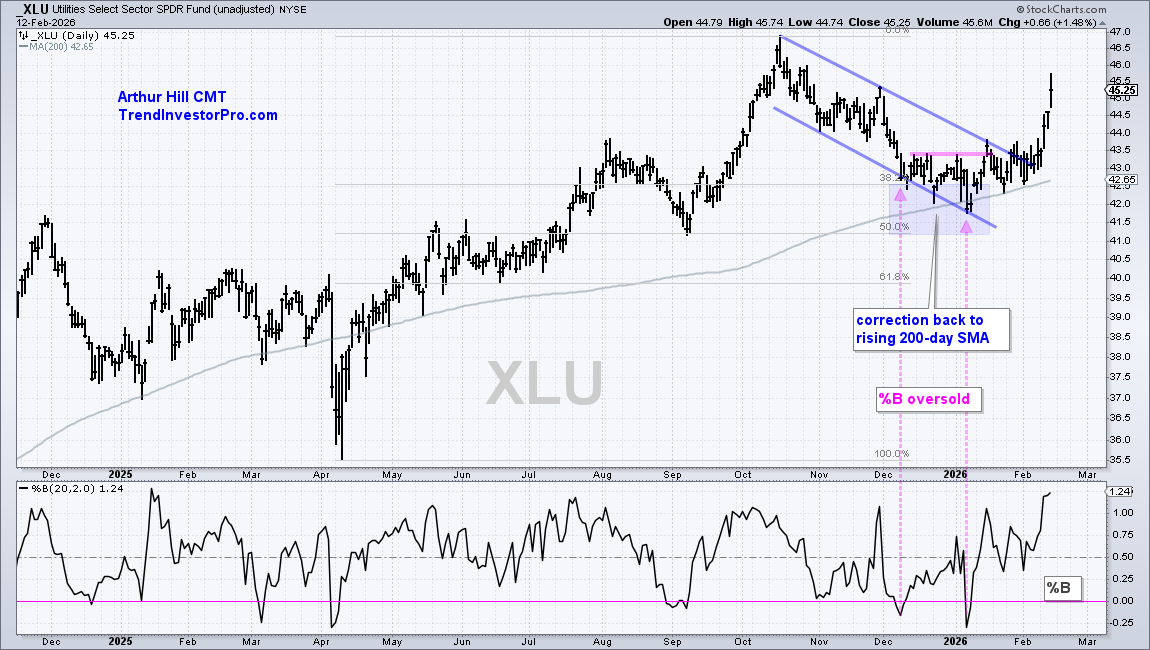
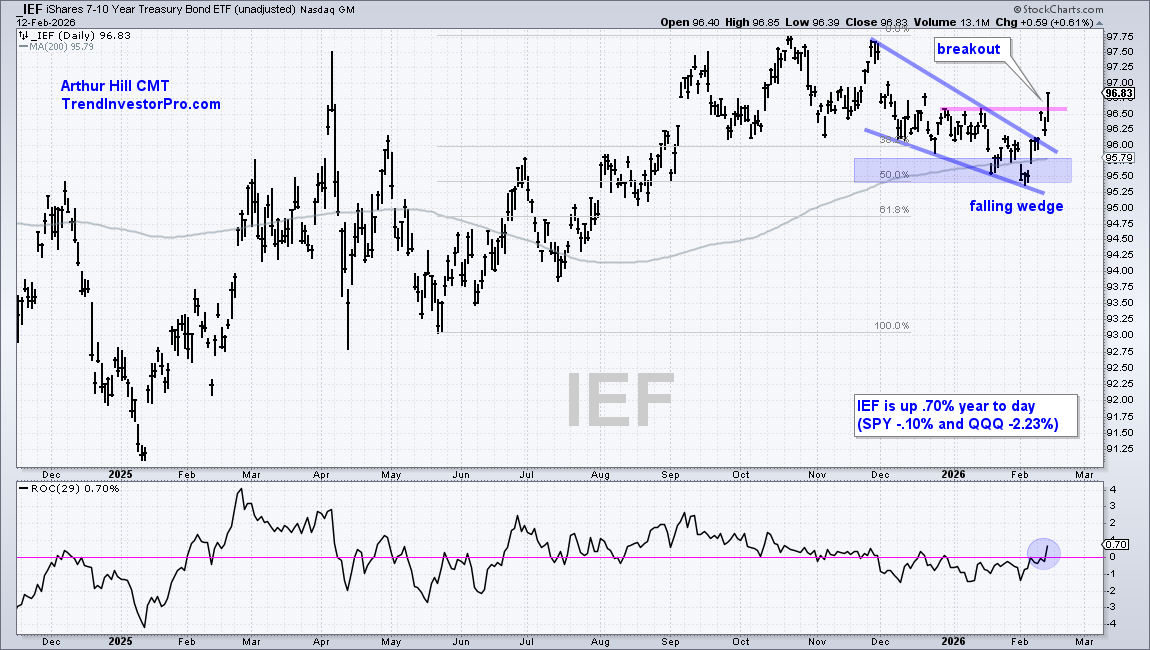
Precious and industrial metals continue to lead in 2026, but gold and silver turned very volatile the last few weeks. Meanwhile, copper and base metals are simply consolidating. Symbols covered: $IEF, $GLD, $SLV, $GDX, $SIL, $CPER, $DBB, $COPX, $SRUUF, $URA and $IBIT.
Moment of truth for Bonds – Copper and Base Metals ETFs Set Up – Bitcoin Oversold Read More »