
")


With some pretty sizable declines the last five days, a number of ETFs are now in the red for the year. 99 of the 118 ETFs in the Core list are down over the last five days and 38 are down year-to-date. This shows some pretty broad selling pressure. The biggest losers year-to-date include: Gold Miners ETF (GDX), Mobile Payments ETF (IPAY), Aerospace & Defense ETF (ITA), Airlines (JETS), Industrials SPDR (XLI) and Metals & Mining SPDR (XME).
While intermarket narratives make for interesting debate over a beer, we cannot possibly know all the factors driving asset prices and their weighted influence. Well, at least I cannot. How to we factor in Fed policy, interest rates, interest rate differentials, inflationary pressures, inflation differentials, fiscal stimulus, debt, trade flows, current accounts, economic growth, internal politics and geopolitics. You get the picture.
Bull Markets, Gold, Silver and Narratives Read More »

The Semiconductor ETF (SOXX) and several other ETFs are on a serious roll in 2021. For the fourth time since 2009, 14-day RSI was above 70 for ten or more days. This is an exceptional streak, but SOXX is not alone and there are even longer streaks. The following list shows some ETFs and the number of days RSI has been above 70: ROBO (39), DRIV (25), ARKQ (13), EWT (13), MOO (12), XRT (11), SOXX (10), YOLO (10). Note that these numbers are based on Thursday’s close.
SOXX and other ETFs with Extended Overbought Conditions Read More »

Today’s video starts with the post-breakout extensions in SPY, QQQ and IWM. The latter looks extended, while the breakout extensions in SPY and QQQ look pretty normal as the tight rising channels hold. We have two different milestones to cover: consecutive days above 70 for RSI and the 52-week lows in junk bond spreads. GLD, TLT and UUP are in downtrends overall, but firming and could be poised

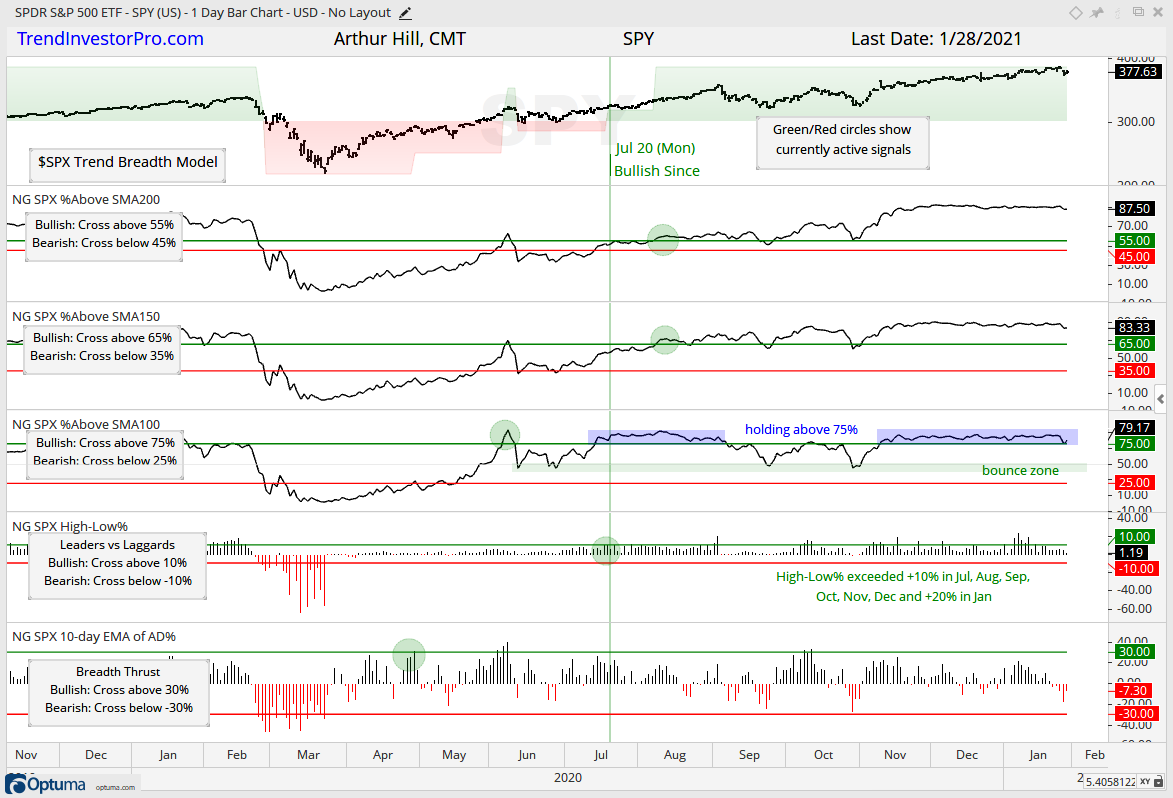
Just when you thought it could not get any better, we are seeing fresh new highs in SPY, a resurgence in QQQ, new lows in the yield spreads and a new high in the Fed balance sheet. Over 90% of stocks in the S&P MidCap 400 and S&P SmallCap 600 are above their 200-day SMAs and 150-day SMAs, while over 85% of stocks in the S&P 500 are above these moving averages. Breadth and price action are strong so what could go wrong?
Stocks as a whole remain overextended and strong. The big three (SPY, QQQ, IWM) are setting the tone for the overall market as they remain with tight rising channels and steady short-term uptrends. Some ETFs look quite ripe for a pullback (SOXX, PBW, TAN), but there are also ETFs that sport fairly fresh breakouts (XLI, KIE, XLU and REZ). In fact, we are seeing some money move bond-proxies with the breakouts in XLU and REZ

Visual chart analysis is prone to subjectivity and biases. While we cannot completely remove subjectivity, we can approach chart analysis in a systematic fashion and increase objectivity. This commentary will show an example using the Home Construction ETF (ITB) because the ETF has traded flat since mid October. Is this a top or merely a correction?
A Top or a Mere Correction? Read More »
Today’s video starts with the weekly charts showing a pretty normal post-breakout extension for SPY, but an overextended advance for IWM. We are also seeing signs of excess in the number of ETFs with RSI readings above 80 this year. Despite overbought conditions, two medium-term breadth indicators are holding strong and have yet to show any deterioration within the S&P 500. We then turn to the ETF
Stocks are in the middle of a strong advance with small-caps leading the charge. The middle, in this instance, refers to a point after the beginning because I do not know where the end will be. IWM appears quite extended after a 39% advance the last eleven weeks, but the price charts for SPY and QQQ do not look that extended. The latter two broke out in early November and continue to work their way higher. Even though small-caps, micro-caps and mid-caps are getting most of the attention right now, SPY and QQQ are holding their own just fine.
There are not a lot of setups this week because most equity-related ETFs moved higher the last two to three weeks. Most, but not all. There are still some setups working in XLU, REZ and ITB, but these three are lagging over the last few months. We are also seeing some relatively fresh breakouts in XLI and XAR, as well as hard throwbacks in GLD and SLV. These four are still in setup territory. All charts are covered below.
Bonds and gold were spooked last week as the 20+ Yr Treasury Bond ETF (TLT) fell 4% and the Gold SPDR (GLD) fell 2.81%. Note that GLD surged over 2% on Monday’s open and then fell over 5% the last three days of the week. Wow! Today we will look at the 10-yr Yield, Inflation, the Real Yield and gold. There is an interesting narrative at work, as always, but we are usually better off focusing on the chart of the underlying and ignoring the narrative.
Treasury Yields, Inflation, Real Yields and Gold – Setting Stops to Filter Out Noise Read More »
The post-breakout moves in SPY and QQQ look pretty normal, but the 10-week surge in the Russell 2000 ETF looks downright frothy. What else is new. Even so, two S&P 500 medium-term breadth indicators are holding strong and show no signs of deterioration that would suggest a correction. In the ETF Chartbook, we saw lots of consolidation breakouts this week and new highs (closing prices) in seven of the nine sector SPDRs. Bonds took it personal this week as the TLT fell 4%,

Chartists trading oversold bounces and short-term bullish continuation patterns have two basic choices when it comes to an exit: trailing stop or trend reversal. Trailing stops are used initially as stop-losses and then trail price if/when it moves higher. Trend reversal exits are used to accumulate during an uptrend and exit when the longer-term trend reverses. This article will cover the trend reversal exit and three trailing stop alternatives.
The rally is gaining steam (momentum), the leadership circle is broadening (new highs) and the riskiest stocks are leading (small-caps). We are also starting to see stories suggesting that this rally is unstoppable. Maybe it is, maybe it isn’t. There will be a pullback at some point, but it is much harder to time “overbought” pullbacks than oversold bounces. The big trend and bull market are the dominant forces at work in the

This is an update covering some recent setups on the ETF Ranking, Trends and Setups table. There were no new trend signals over the last two weeks. Only 6 of the 118 ETFs are in downtrends, which are based on StochClose signals. 52 ETFs scored 98 or higher on the 52wk Range score, which means they are at or close to 52-week highs. Even though
Highlights from the ETF Ranking, Trends and Setups Table Read More »
Stocks are on the march again with the re-open trade leading the way here in 2021. The year ended with small-caps, retail, banks and energy leading the last two months of the year and this theme picked up again this week. A new year and a new month translates into money ready to go to work and this money found its way into the momentum leaders of the last three months.
The bull market in stocks remains intact as we start 2021. The S&P 500 SPDR and Nasdaq 100 ETF finished the year at new closing highs, while the Russell 2000 ETF finished less than 2% from its December 23rd closing high, which was a 52-week high. For the year, IWM was up 18.34%, QQQ rose 47.57% and SPY gained 16.16% (sans dividends). Note the Silver ETF kept pace with QQQ in 2020.
We have an interesting mix of overbought ETFs and ETFs that are consolidating. ETFs that are overbought are not outright bearish, but they do not have tradable setups. The overbought ETFs are the current leaders because they are the ones with the biggest gains and the ones trading at 52-week highs. ETFs that are consolidating within uptrends have tradable setups, such as bullish flags, pennants
The broad market environment remains bullish, but the picture is turning mixed as fewer stocks follow the major indexes higher. The S&P 500 SPDR, Nasdaq 100 ETF and Russell 2000 ETF moved to new highs this week and are positive the last 16 trading days, but the S&P 500 Equal-weight ETF did not hit a new high this week is down around 1% the last 16 days. The equal-weight S&P 500 represents performance for the “average” stock in the S&P 500. I am also seeing some underlying weakness in short-term breadth for the S&P 500 and the technology sector.
Timing Models – Bulls in Control, but Short-term Participation Narrows Read More »
The bulls remain in the driver’s seat when it comes to stocks. Strength within the stock market is broad with the S&P 500, Nasdaq 100 and Russell 2000 recording new highs here in December. There is also broad strength within the stock-related ETFs with dozens of new highs. Tech-related ETFs reasserted themselves as the true leaders with breakouts in late November and new highs throughout December. Keep in mind that these ETFs also recorded new highs