Breadth Models and Indicator Charts
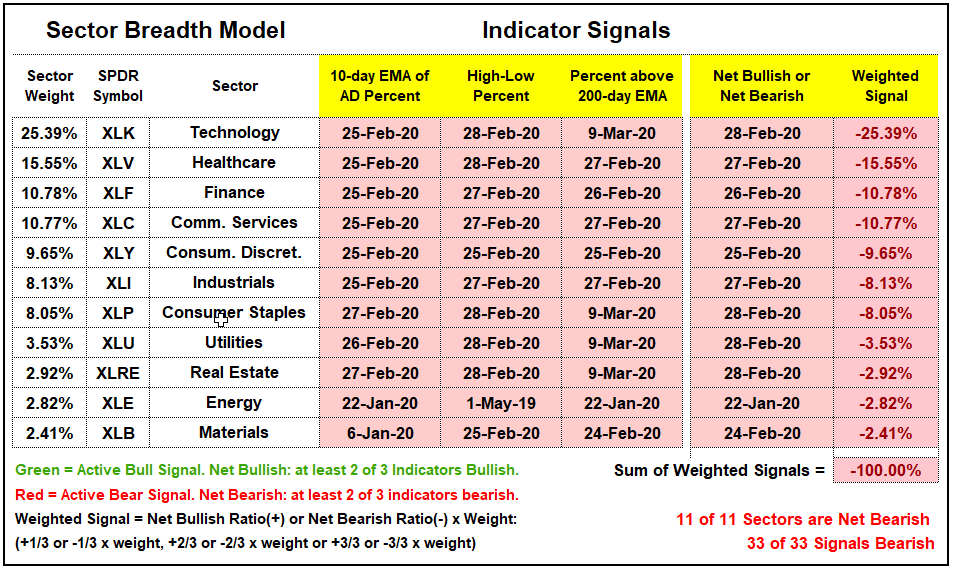
The next charts and images show the breadth model signals, breadth models and updated breadth charts. The bearish signal from February 26 remains for the stock market.
Click here for an article and video explaining the indicators, signals and methodology used in the Index Breadth Model. This article also includes the signals of the last five years.


Here is a link to the article and video dissecting the last two bear markets and the 1987 crash.
Here is a link to last week’s article discussing three trends and the three phases of a bear markets (aka Charles Dow).
Being There
Staying with the quote from Being There for now. We are currently in the fall-winter stage, but there will be spring and summer again. Until then, I will exercise a little patience and a work on the bear market projects.


