ETFs Ranked by WASS
Note that the ETF ranking tables at the top are separate from this commentary. The ranking tables are designed to help with trend-momentum strategies, while the analysis below is based on price structure, setups, chart patterns and pattern breaks. Click here for a detailed article and video explaining the Weighted Average Stochastic Score (WASS) and how it can be used for a rotation strategy.
Ignore the Noise and Focus on the Smooth
It may be darkest before the dawn, but it is still pretty dark out there. Furthermore, volatility remains out of control. The S&P 500 fell 4.4% on Wednesday and the futures are pointing to a 1+ percent gap higher on today’s open. We have not seen a dull open since mid February.
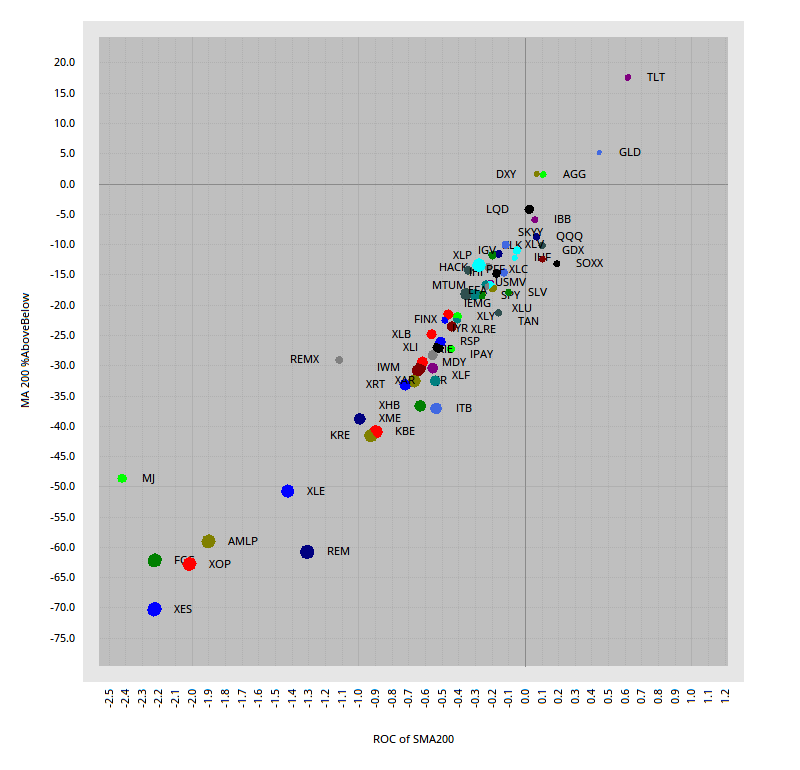
For a much smoother assessment, note that all stock-related ETFs are below their 200-day SMAs and most 200-day SMAs are falling. Only four non-stock ETFs are bucking this trend: the Dollar (UUP), the Aggregate Bond ETF (AGG), the Gold SPDR (GLD) and the 20+ Yr Treasury Bond ETF (TLT). Note that I am using the US Dollar Index (DXY) instead of UUP because of some special dividend issues.

The scatter plot above shows the percentage above/below the 200-day SMA on the y-axis and the 5-day Rate-of-Change for the 200-day SMA on the x-axis. ETFs in the upper right hand corner are still in uptrends overall. ETFs in the lower left are in downtrends. This plot does not scatter because there is an obvious correlation between %Above the 200-day SMA and direction of the 200-day SMA. The message here is clear: weakness is broad-based and this is bearish.
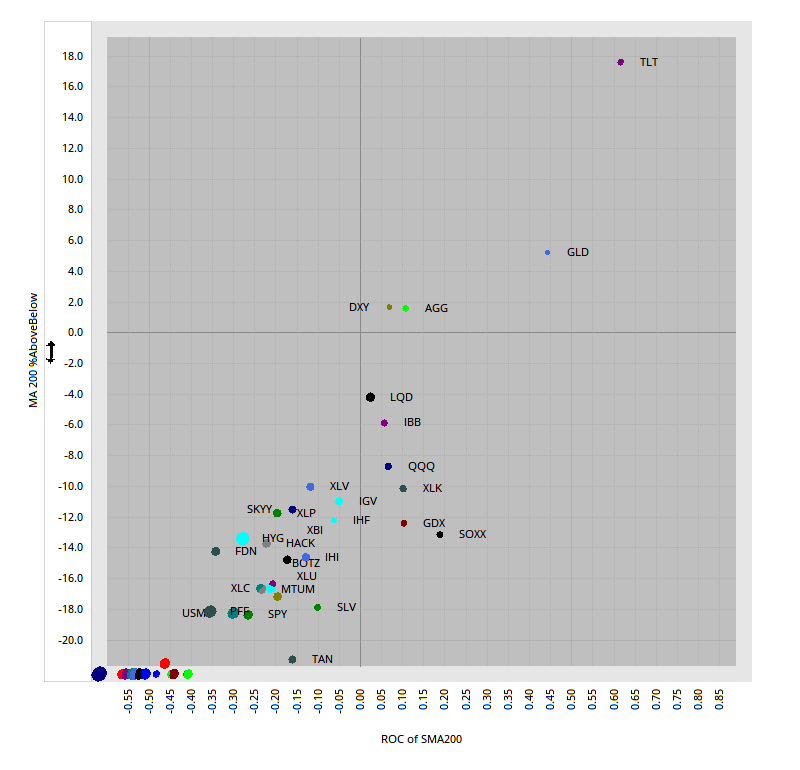
The second scatter highlights a few ETFs with rising 200-day SMAs. Note, however, that they are still in the bottom half of the charts and 5% or more below their 200-day SMAs. Some tech-related ETFs (QQQ, XLK, SOXX), Biotech ETF (IBB) and Gold Miners ETF (GDX) still have rising 200-day SMAs.

The scatter plots above were created with Optuma.
Retracements and Momentum
The ETF charts show the Fibonacci retracements and RSI(10) for comparison. ETFs that retraced 50% led the rebound and ETFs that retraced around 23.6% lagged. Leading and lagging does not matter much right now because we are in a bear market. Leading in this case just means less weakness, NOT actual strength. Relative strength works great in bull markets, and not-so-great in bear markets.
RSI(10) is shown on the charts with the danger zone marked in the 50-70 area. RSI dipped to an extremely low level in mid March and some ETFs are having trouble even making it back to the 50 area. ETFs with RSI moving back above 50 show relative strength, but this is not a bullish indication because we are in bear market and the bigger trends are down for these ETFs. Instead, RSI in the 50-70 zone is dangerous because this where momentum sometimes peaks.
Small-caps: Weak Bounce and Strong Decline
The S&P SmallCap 600 SPDR (IJR) took one of the biggest hits with a 40+ percent decline from mid February to mid March. The shear size of the decline means it takes a big advance to retrace a big portion. IJR retraced around 25% with last week’s high, but then fell a whopping 7% on Wednesday. This is not normal! RSI did not even make it to the danger zone (50-70) before selling pressure took hold.
Large Techs: Strong Bounce and Sharp Decline
The Nasdaq 100 ETF (QQQ) managed to exceed the 38% retracement line on this bounce (bravo), but then fell over 4% on Wednesday (boo hiss). Note that QQQ broke its 200-day like every other stock-related ETF and hit a 52-week low in mid March. QQQ may be holding up better than average, but it is not actually holding up and is not immune to broad market weakness. Also note that QQQ did not come close to the 200-day and RSI backed off the danger zone (50-70).
XLU Hits 50% Retracement, BUT …
The Healthcare SPDR (XLV), Utilities SPDR (XLU) and Biotech ETF (IBB) hit the 50% retracement level with strong bounces. Even so, all three recorded 52-week lows in March and are below their 200-day SMAs. XLV and XLU are below their falling 200-day SMAs. Also notice that RSI reached the danger zone on Tuesday and all three turned back on Wednesday. XLU led with a whopping 6% decline. Even Utilities are not safe.
Tech-Related ETFs Led Rebound, BUT …
Several of the tech-related ETFs led last week’s rebound with three day gains that exceeded 20% and the 38.2% retracement level, but these same ETFs were pummeled on Wednesday with declines exceeding 4%. The Semiconductor ETF (SOXX) and Software ETF (IGV) both exceeded their 38% retracement levels, but did not come close to their 200-day SMAs and turned sharply lower on Wednesday. Also notice that RSI failed in the 50-70 zone.
The Mobile Payments ETF (IPAY) is all over the place and bearish. Even though the ETF surged some 25% last week, it did not quite make it to the 38.2% retracement line and RSI did not exceed 50. IPAY then fell 6.9% on Wednesday, which is par for the course now. IPAY fell ~40% from mid February to mid March, surged ~25% in three days and fell ~12% over the last four days. IPAY is extremely volatile, ~27% below the 200-day SMA and the 200-day SMA is falling. This is not a bullish configuration.
Software and Mobile Payments are two groups to consider when we come out of this bear market (secular bullish themes). Related stocks include Microsoft (MSFT) and Mastercard (MA). Nope that these stocks are not immune to bear markets and broad economic weakness. Microsoft Teams may be booming right now, but other parts of the business will be hit with a broad downturn in the economy.
Big Declines, Shallow Retracements and Sharp Drops
The Retail SPDR (XRT) and the Regional Bank ETF (KRE) were lagging heading into February and fell over 40% from mid February to mid March. They bounced with the market last week, but their retracements were on the short end (~25%) and RSI did not make it back above 50. Both were pummeled on Wednesday with declines exceeding 5% and these two remain very week. This also explains weakness in small-caps because the finance sector is the second biggest sector in IJR and IWM.
GDX Backs off Resistance
The Gold Miners ETF (GDX) is all over the place, but in a downtrend once we filter out the noise. The ETF broke support and the 200-day SMA twice (late February and early March). After a 52-week low, the ETF rebounded back to the 200-day and turned back near broken support, which turned resistance (28 area). RSI also turned back in the 50-70 zone.
GLD and TLT Continue Wild Uptrends
The Gold SPDR (GLD) and the 20+ Yr Treasury Bond ETF (TLT) remain in long-term uptrends and are both relatively close to 52-week highs (~7%). Close is a relative term with all this volatility. Nevertheless, both are above their rising 40-week SMAs. The first chart shows GLD bouncing with a move back above the 40-week SMA last week. Weekly RSI(10) also bounced off the 40-50 zone.
TLT formed a massive bearish engulfing candlestick four weeks ago, but this was a bearish candlestick in a long-term uptrend. It signaled an increase in volatility, but did not reverse the overall uptrend. The following week TLT dipped below 140 and closed above 155. Bonds are not for the faint at heart either. In any case, this chart also sports a bullish configuration.


