Bear markets are difficult because there are big, and opposing, forces competing for control. The big trends are down for the major stock indexes, credit markets are chaotic, the economy is deteriorating and covid-19 is raging. These negatives are countered with unparalleled responses from the Fed and Congress. Throw in a roller coaster news cycle and we have a market environment that is lethal for both bulls and bears. Nobody wins in a bear market.
I updated the ChartList and Ranking Tables, but will not be covering the charts in today’s video. Why? Because I covered gold and bonds on Thursday, and the market environment is lethal. Today’s video will focus on the S&P 500, the Index Breadth Model indicators and stink bid levels.
I put the Fibonacci retracements tool on most ETF charts to measure the retracement of the current advance. For example, the Real Estate SPDR (_XLRE) retraced a little less than 38% of the prior decline. Chartists can also measure this with the Fast Stochastic Oscillator (60,1). A 60 day Fast Stochastic reflects the level of the close relative to the high-low range over the last 60 days. _XLU has the strongest retracement (44) and _XLE has the weakest retracement (14).
Ranking Tables
The ranking tables are updated, but stock-related ETF rankings are of little value in a bear market. Even though gold and bonds are still holding up, volatility is above average for both and risk is high across the board. Click here for a detailed article and video explaining the Weighted Average Stochastic Score (WASS) and how it can be used for a rotation strategy.
Highs, Lows, Leaders and Laggards
81 of the 200 ETFs in my core list recorded new lows this week (mostly on Monday). The Vanguard Mortgage-Backed Securities ETF (VMBS) was the only ETF to record a new high (thanks to the Fed).
96 of the 200 ETFs in the master list were up 10% or more this week. Despite big gains, almost all of these ETFs are still down 10% or more over the last six weeks. Stock-related ETFs were extremely oversold on Monday and this is an extreme oversold bounce.
The last six weeks have been extraordinary, to say the least. The S&P 500 fell 33.92% in 23 days, surged 17.55% in 3 days and then fell 3.37% on Friday. This month, which consists of 20 trading days, the index has moved 4% or more 13 times (7 up and 6 down). In case you are wondering, it would take a 51.4% gain to fully recover the 33.9% loss. Yes, the gain needs to be 50% more than the loss to fully recover.
Also consider that a 100% gain is required to recover from a 50% loss. As an example, a decline from 100 to 50 is a 50% loss and a move back to 100 is a 100% gain. This is why capital preservation and limiting losses is so important. Moreover, as we saw here in March, the stock market tends to take the stairs higher and the elevator down.
I could suggest that a 17.55% gain in 3 days is atypical for bull markets, but note that big gains in short periods often signal the end of bear markets or exceptionally deep corrections (December 2018, September 2011, March 2009, September 2003, March 2003, October 1998, January 1991). These will be covered in today’s video.
Big Bounce from Extremely Oversold Levels
I do not think the 17.55% surge in three days changes the broad market environment. The S&P 500 was down 33.9% and this decline seriously stretched the rubber band. The further you stretch a rubber band, the harder it snaps back and this is just a hard snap back. As the chart below shows, the index was more than 25% below its 200-day SMA. Also note that the 200-day SMA turned down on March 12th. The chart links to a StockCharts chart with the 200-day EMA and PPO(1,200,0) for reference.
Also note that this 17.55% gain did not come close to recording a 20-day high and did not even break the 20-day EMA. And, just 30% of stocks in the S&P 500 were above their 20-day EMAs on Thursday. Thus, this is still considered a bear market bounce. I am also ignoring this week’s big bullish engulfing candlestick. As noted before, I ignore bullish candlestick patterns, bullish setups and short-term oversold conditions when the bigger trend is down.
Index Breadth Model Remains Red
The Index Breadth Model remains 100% bearish because a three day bounce is not enough to turn even the most sensitive indicators bullish. The model turned net bearish on February 26th when seven of the nine signals were bearish. This reversed a bullish signal that was in effect since September 5th. The S&P 500 was the last holdout as High-Low Percent and %Above 200-day EMA triggered bearish on February 27th.
Click here for an article and video explaining the indicators, signals and methodology used in the Index Breadth Model. This article also includes the signals of the last five years.
Well Short of a Breadth Thrust
The 10-day EMA of Advance-Decline Percent for the S&P 500, S&P MidCap 400 and S&P SmallCap 600 surged into positive territory on Thursday, but fell well short of the 30% level required for a bullish breadth thrust.
The High-Low Percent indicators returned back to the zero area as new lows dried up with the three day bounce. However, there was only one new high in the S&P 500 (Citrix CTXS) and one new high in the S&P SmallCap 600 (Luminex LMNX). This indicator needs to clear +10% to start triggering some bullish signals.
The percentage of stocks above the 200-day EMA bounced off its lows this week, but did not even clear the 10% level. This suggests that more than 90% of stocks in the three indexes are in long-term downtrends. This indicator needs to get back above 60% to start triggering bullish signals.
As the Index Breadth Model and indicators show, it is going to take more than a 3-day oversold bounce to turn this ship. Also note that this model is similar to trend following models. It will not call the bottom and will only turn when there is clear evidence of broad strength in the stock market. As a trend-following type model, it is also not immune to whipsaws.
Sector Breadth Model Remains Red
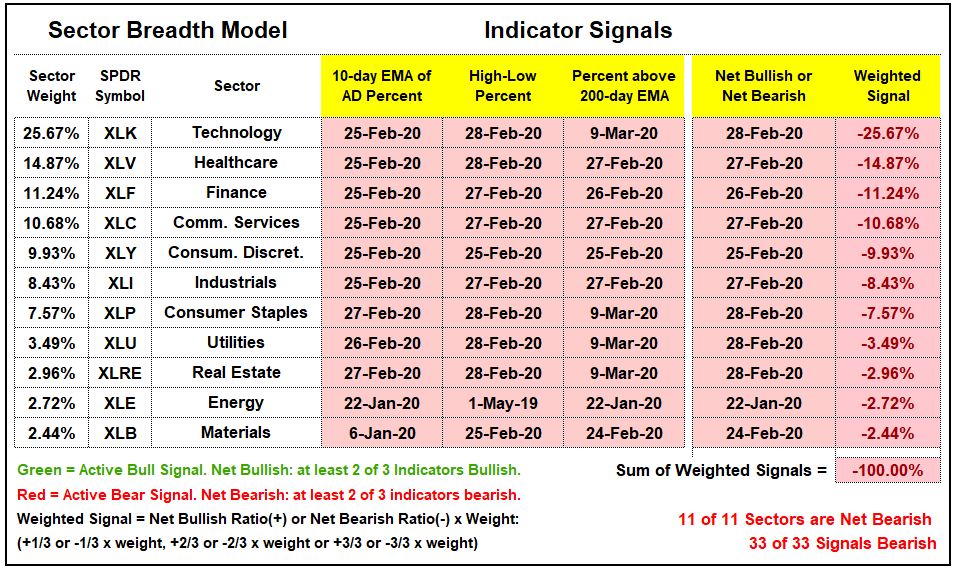
All indicators in the Sector Breadth Model are on active bearish signals. Each column shows the date of the signal and red boxes denote a bearish signal. The Net Bullish or Net Bearish column show when at least two of the three indicators were on bearish signals. Energy turned net bearish on January 22nd, while the rest turned net bearish towards the end of February. It is a sea of red right now. Finally, note that the weighting of the Technology sector is back above 25% because XLK is holding up better than most. But still bearish. The Energy sector is now the 2nd smallest sector (2.72%) as it dropped below REITs.
Considering a Stink Bid
There are two possible strategies at this stage: wait for the weight of the evidence to turn bullish or consider a “stink” bid, which is a bottom picking bid far below current prices. I posted a link to a Bloomberg interview with Bruce Richards of Marathon Asset Management. Richards notes that his firm was placing bids well below the market and these bids were getting hit because sellers wanted out at any price. Richards deals with distressed debt and this is not quite the same as stocks. However, the principle of the stink bid applies. Find a stock or ETF that you like for the next few years and place a stink bid. This idea is that it might just get hit if we get further weakness or a washout.
The chart below shows the S&P 500 with my stink bid target around 1700. While I cannot prove this with a backtest, the S&P 500 seems to bounce after breaking an “important” low. The index bounced this week after breaking the December 2018 low and the index bounced in 2009 after breaking the 2002 low. Also notice that the S&P 500 started the base building process after breaking the 1998 and 2001 lows in July 2002.
Thus, I think a break below the January-February 2016 lows and an RSI(14) move below 30 could be the stink bid going forward. Keep in mind that this is monthly RSI(14) and readings below 30 are rare, very rare. In any case, we are not there yet and I will monitor this chart on a regular basis.
")