")


Market volatility was also high and seemed to get even higher the last two weeks. Moreover, volatility and selling pressure are not just in the stock market. We saw selling pressure in almost all groups over the last five
The Composite Breadth Model remains bearish and we are in a bear market environment for stocks. Oil and agricultural commodities remain relatively strong, but industrial metals were hit pretty hard the last two weeks. Downside participation

The weight of the evidence remains bearish for stocks and participation to the downside expanded significantly over the last six trading days. Even the low volatility leaders were hit hard and there were few places to hide as correlations rose among stocks. Bonds managed to firm, but do not offer an alternative to stocks
The Market Regime is bearish and this means there is a headwind for stock-related ETFs. At the very least, we should be extremely selective and reduce exposure to stocks. Even though we will still have sharp oversold bounces,
It is not pretty out there. The Composite Breadth Model is bearish and yield spreads are rising. We are also seeing large-techs (QQQ) and small-caps (IWM) lead the broader market lower. Selling pressure intensified with lopsided down days on Friday and Tuesday. Basically
The broad market environment for stocks was more bearish than bullish early last week and became even more bearish after the sharp decline on Thursday-Friday. Downside participation broadened as many of the market leaders were hit hard. We are talking about the Metals & Mining SPDR, the
Today we are going to dive into the subjective world of chart analysis. The weight of the evidence is bearish for stocks, but it is not overwhelmingly bearish because the S&P 500 breadth models are still net bullish. The market is quite divided and this is why SPY has been flat since September. The January-March decline
The weight of the evidence for the stock market remains more bearish that bullish. More stocks are below their 200-day SMAs than above, volatility is above average for SPY and the Composite Breadth Model is net bearish. Nevertheless, the S&P 500 SPDR and the S&P 500 EW ETF are trying to forge short-term reversals with big moves on Tuesday.
The broad market environment for stocks is more bearish than bullish. The Composite Breadth Model is negative, more stocks are below their 200-day SMAs than above and the S&P 500 is below its 200-day. Also note that yield spreads are rising again, offensive groups are lagging and defensive groups are leading.

Sector PerfCharts provide clear performance snapshots of the market mood and the market mood is defensive. The PerfCharts below show the percentage change for the S&P 500 SPDR (SPY) and the eleven sectors. These sectors can be divided into three groups: offensive sectors, defensive sectors and other.
A Defensive Picture No Matter How you Slice It (Free) Read More »
There are often crosscurrents in the market and these can create confusion. For example, the Trend Composite for SPY is positive, but the 5-day SMA is below the 200-day SMA. On the price chart, SPY appears to be in a downtrend in 2022, but there is a short-term bullish
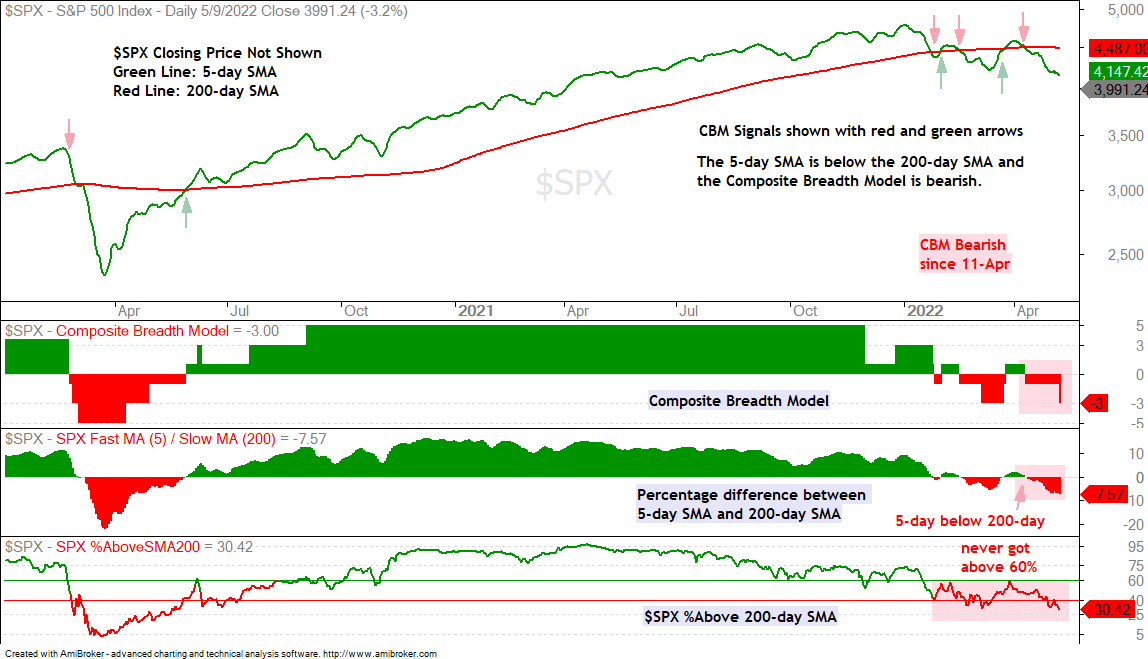
The Composite Breadth Model flipped back to bearish as the 5-day SMA for SPX crossed below the 200-day SMA. Despite whipsaws in the model, the percentage of stocks above the 200-day SMA and High-Low Percent paint a picture of weakness in 2022. SPY and RSP may be holding up, but the
Weakness under the surface and weakness within the Nasdaq 100 is weighing on the S&P 500, which cracked again. The weight of the evidence was already bearish for small-caps, mid-caps and

After a big surge in the second half of March, stocks fell back this week as the S&P 500 declined around 2%. This modest decline is warranted after the March surge, but it was not enough to push sentiment to an extreme. The AAII Bears are back above 40%, but two other sentiment indicators barely budged.
Using Sentiment to Measure Short-term Extremes (Free) Read More »
The broad market ETFs were hit with selling pressure on Wednesday with growth oriented groups leading the way lower. SPY fell 1%, QQQ was down 2.17%, the Semiconductor ETF fell 2.5% and the Russell 2000 Growth ETF was down 1.88%. In contrast, groups associated
The Composite Breadth Model is net bullish, but the stock market is as split as ever and some key groups are leading the way lower. Large-caps are leading and small-caps are lagging. We are even seeing a serious split
There are large pockets of strength in the stock market, but also large pockets of weakness. In fact, these pockets are almost equal and this is the reason the S&P 500 has gone nowhere since Thanksgiving. The Composite Breadth Model is net bullish and split. The S&P 500 trend model is net bullish

Volatility is through the roof for many commodities and commodity-related ETFs, but this does not mean we have to abandon technical analysis and classic setups. High volatility does, however, imply higher risk and we probably need to give setups a little more wiggle room.
Wild Swings and a Classic Setup for Palladium (Free) Read More »

Today’s article is the eighth installment of the Trend Composite strategy. Last week we looked at ATR Trailing Stops and time-based exits, but these did not add much value. Today we will add various profit targets based on percentage gains. The strategy will still sell when/if the Trend
This video starts with broad market analysis and then moves to the individual ETFs. The broad market section includes the Composite Breadth Model, Fed balance sheet and yield spreads. Breadth indicators, SPY, QQQ, bonds, gold and the Dollar are also covered. Analysis, then turns to the ETFs charts with leading trends, emerging trends and setups.