There were lots of downtrend signals this past week and over the past month. Selling pressure expanded and broadening participation on the downside was enough to push the Composite Breadth Model back into bear market mode. Note that I will update the Market Regime page on Friday morning. For now, the pickings are slim among the equity-related ETFs because most are in downtrends. The market and many of these ETFs are quite oversold short-term so we could see a bounce or consolidation (choppy trading).
CBM Turns Bearish
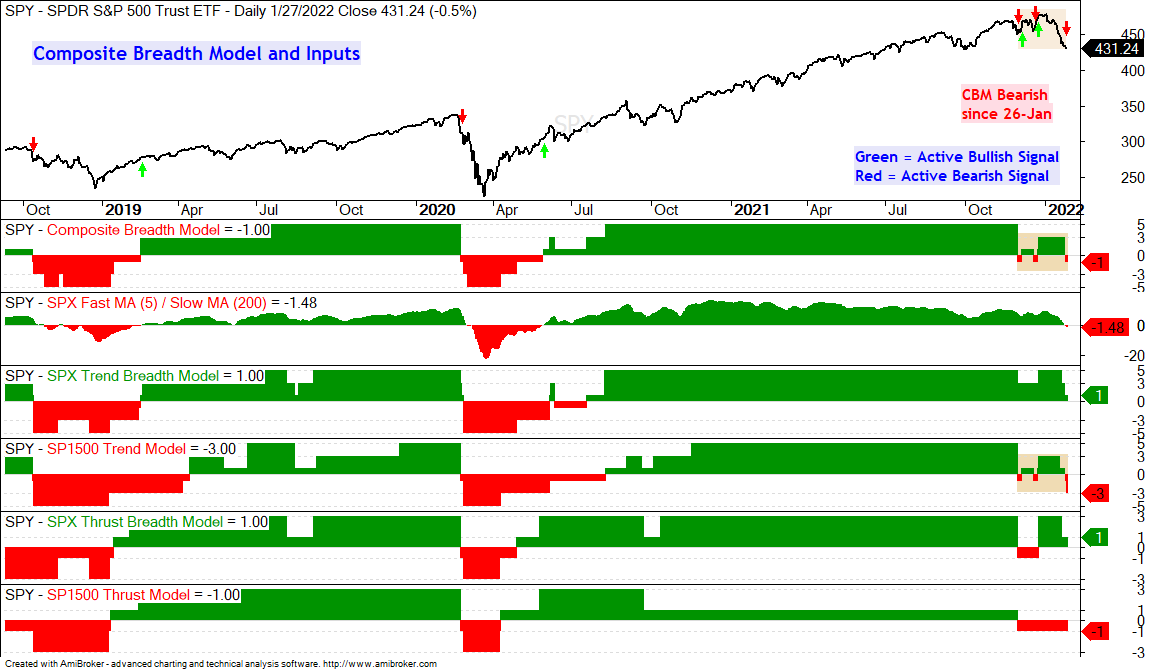
The Composite Breadth Model flipped back to bearish with Wednesday’s close. The five inputs are the 5/200 Cross for the S&P 500, the S&P 500 Trend Model, the S&P 500 Thrust Model, the S&P 1500 Trend Model and the S&P 1500 Thrust Model. The chart below shows the signals with the red and green arrows. The first indicator window shows the model turning negative (-1). SPY is currently down 9.3% from its early January high.
The Composite Breadth Model is weighted towards the S&P 500 and strength outside of tech, communication services and consumer discretionary kept the S&P 500 afloat. I expected the model to turn bearish and it is officially bearish. Of note, S&P 500 %Above 200-day SMA triggered bearish with a move below 45%, the S&P 1500 Trend Model is net bearish and only 35% of S&P 1500 stocks are above their 200-day SMAs. The chart below shows the %Above SMA indicators turning red (below 45%) here in January.
What now? Short positions are not an option for me. I tested Composite Breadth Model signals with short positions and these increased the drawdowns and reduced the returns. Treasury bonds seem like a viable alternative, but the 20+ Yr Treasury Bond ETF (TLT) and 7-10 Yr Treasury Bond ETF (IEF) are in downtrends. TrendInvestorPro is about participating in uptrends and avoiding downtrends.
Bear market signals are like a box of chocolates: you never know what you are going to get. We could get another whipsaw, there could be an extended correction (SPX 15-20%) or we could even see a bear market. Nobody really knows. At the very least, a bearish signal in the Composite Breadth Model means risk is above average for equity-related ETFs. Pickings are slim because the majority of stocks are in downtrends.
Equity-related ETFs should be viewed with caution right now. There are dozens of non-equity ETFs and these can be monitored for trend signals and bullish setups. In particular, several commodity related ETFs are in uptrends.
The next chart shows SPY breaking the December lows on January 20th and the Trend Composite turning bearish on January 24th (bottom indicator). The Momentum Composite has been oversold six days in a row and this is testament to strength in downside momentum. SPY is oversold and ripe for a consolidation or even a bounce. However, I am not looking for short-term oversold conditions or bullish setups right now because the Composite Breadth Model is bearish and the ETF is in a downtrend. Time to exercise some patience and avoid forcing a trade.
The next chart shows QQQ with an impulse move lower. This is an Elliott Wave term, even though I do not really use Elliott Wave. An impulse move often triggers trend indicators because of its magnitude, up or down. The indicator window shows Normalized ROC, which is the 20-day absolute Rate-of-Change divided by ATR(20). If QQQ is down 50 points and ATR(20) is 10, then normalized ROC would be -5 because the 50 point decline is five ATR (20) values. Normalized ROC is currently -6.29, which is an outsized move that was enough to turn the Trend Composite bearish too.
The chart below shows two prior retracements. The covid crash retraced 67% of the prior advance (+65%) and the 2018 decline retraced 50% of the prior advance (+93%). A 50% retracement of the advance from March 2020 to November 2021 would carry QQQ back to the 285 area, which is another 17% lower. Take price targets with a bucket of salt because they are educated guesses. The trend and price action are what really matter and I will stay bearish until the evidence changes.
The Trend Composite is bearish for the Russell 2000 ETF (IWM), S&P SmallCap 600 SPDR (IJR) and Russell Microcap ETF (IWC). These ETFs are also leading the way lower. The S&P MidCap 400 SPDR (MDY) turned bearish last week and the S&P 500 EW ETF (RSP) also succumbed to selling pressure as it broke the December lows and the Trend Composite turned bearish.
The downtrend signal in RSP is a reminder that correlations rise when the broad index ETFs turn down. Note that ten of the eleven sectors are down year-to-date. XLE (+17.5%) is the only gainer. On a closing basis, XLI, XLF, XLU, XLE and XLP are holding above their December lows. The other six broke their December lows.
Focus on Uptrends
Stocks and ETFs that were hit the hardest will probably have the sharpest oversold bounces. However, these stocks and ETFs are in downtrends and bottom picking is a different strategy. Per the Trend Composite, here are the ETFs from the core list (129 ETFs) that are still in uptrends:
The DB Agriculture ETF (DBA) remains in an uptrend with new highs on 19-20 January. The trend since the channel breakout in July is pretty consistent and the triangle/wedge breakout in late January was the last signal. There is no setup or signal right now, just an uptrend.
The DB Base Metals ETF (DBB) is also in a clear uptrend with breakouts in late December. The ETF has yet to hit a new high and is somewhat overbought after a double digit advance since mid December. There is no setup on the chart, just an uptrend.
The Copper ETF (CPER) is also in an uptrend, but it’s uptrend is not as consistent as the first two. Notice how the Trend Composite whipsawed over the last few months. Even so, the Trend Composite is now bullish and CPER broke out of a falling wedge in late December. Trading since the breakout has turned choppy, but the breakout is still holding. A close below the January low would argue for a re-evaluation.
I guess the Global Carbon ETF (KRBN) is part of the commodity group, even if it is the only commodity we are trying to get rid of. KRBN remains in an uptrend and the ETF held up fairly well over the last several weeks. After a 43% surge in December, the ETF formed a triangle consolidation into January. A consolidation within an uptrend is typically a bullish continuation pattern and the ETF is attempting to turn up within the triangle.
You can learn more about my chart strategy in this article covering the different timeframes, chart settings, StochClose, RSI and StochRSI.
Oil and Energy ETFs Continue to Lead
West Texas Intermediate ($WTIC) remains in a strong uptrend as the ETF hit a new high this week ($88.23). The only negative is that oil is up over 30% since early December and getting a bit extended. This is a luxury problem. There is no setup on the price chart, just a strong and leading uptrend.
The energy-related ETFs are a little mixed as the Energy SPDR (XLE) followed WTI to a new high, but the Oil & Gas Exploration & Production ETF (XOP) remains below its November high and the Natural Gas ETF (FCG) did not exceed last week’s high. XLE is the leader on the price chart and the Oil & Gas Equipment & Services ETF (XES) is biggest gainer for 2022 (+20.5%). The chart below shows XLE with a channel breakout on January 3rd and new highs the last few weeks. Again, there is no setup right now, just a strong and leading uptrend.
The next chart shows a long-term picture for XES. The ETF surged some 160% and then formed a large triangle into January. The ETF broke resistance within the triangle with the early January surge and is breaking the upper trendline. This triangle represents a big consolidation and a bullish continuation pattern. The breakout, therefore, signals a continuation higher. Note that XES has above average volatility and can be prone to big swings.
You can learn more about exit strategies in this post, which includes a video and charting options for everyone.
Sharp Pullbacks after New Highs
There are still some ETFs in uptrends and some are even trading in short-term reversal zones (short-term oversold, near a key retracement, near support and/or returning to the prior breakout zone). Volatility is the 800 pound gorilla in the room though. The declines from January 6th to 21st were sharp and price action over the last three days has been very choppy. There was a reversal day on Monday, a volatile stall on Tuesday and a pop-drop on Wednesday. The Fed meeting certainly did not help. There are perhaps some oversold setups out there, but the declines over the last few weeks were not orderly and I do not see tradable patterns out there (falling flag, wedge, triangle). The seas are choppy so keep this in mind if taking the boat out.
The Momentum Composite aggregates signals in five momentum indicators. RSI(10) is oversold below 30 and overbought above 70. 20-day StochClose is oversold below 5 and overbought above 95. CCI Close (20) is oversold below -200 and overbought above +200. %B (20,2) is oversold below 0 and overbought above 1. Normalized ROC (10) is oversold below -3 and overbought above +3. Normalized ROC is the 10-day absolute price change divided by ATR(10). -3 means three of the five indicators are oversold and +3 means three of the five are overbought.
The Momentum Composite and StochClose are part of the TIP Indicator Edge Plugin for StockCharts ACP. Click here for more details.
Defensive Groups Take a Hit
REITs, Utilities, Staples and Healthcare were hit over the last few weeks as well. I am not considering REITs and Utilities because they are high-yielding bond proxies and bonds are in downtrends. Rising interest rates create a headwind for these two groups. The Consumer Staples SPDR (XLP) and Food & Beverage ETF (PBJ) remain in uptrends and pulled back the last two weeks. Again, I do not see tradable bullish continuation patterns at work, but they are short-term oversold and near a key retracement. XLP retraced 50-67% of the prior advance (11%) and is near support from the prior resistance break.
Semiconductor ETF Retraces 2/3 of Prior
The chart below shows the Semiconductor ETF (SOXX) breaking the December lows with a sharp decline and becoming oversold four of the last six days. This ETF also retraced 50-67% of the prior advance. The decline was sharp and looks more like an impulse move, but oversold conditions could give way to a bounce and the Trend Composite has yet to turn bearish. The swings over the last three days were quite violent and this shows above average volatility (risk).
You can learn more about exit strategies in this post, which includes a video and charting options for everyone.
Regional Bank ETF Returns to Breakout Zone
The finance related ETFs are benefitting from the rise in interest rates as the 10-yr Treasury Yield broke out of a big triangle in early January and appears headed to 2% (currently 1.84%). The next chart shows the Regional Bank ETF (KRE) with a 17% surge to new highs and a 67% retracement of this surge as it fell back to the breakout zone. This is the first area to watch for support and a possible reversal.
Materials and Infrastructure are below May Highs
The Materials SPDR (XLB) and the Infrastructure ETF (IFRA) remain with similar charts. Both hit new highs in early January and fell back with sharp declines over the last few weeks. They are not immune to broad market weakness, but they are still in uptrends per the Trend Composite. Even so, they are both below their May 2021 highs and these uptrends are hardly consistent. The only setup is short-term as the ETFs are in possible reversal zones. The Trend Composite is bullish, the ETFs are oversold and they near the 67% retracement.
CIBR and XLV Hold Up Relatively Well
Several tech-related ETFs hit 52-week lows here in January. These include the Cloud Computing ETF (SKYY), Cyber Security ETF (HACK), FinTech ETF (FINX), Internet ETF (FDN), Mobile Payments ETF (IPAY) and Robotics & Artificial Intelligence ETF (BOTZ). The Software ETF (IGV) is close to its March low and the Cybersecurity ETF (CIBR) remains well above its March low (some 15% above). The Communication Services SPDR (XLC) is also well above its 52-week low, but it peaked well before the other tech-related ETFs. IGV is not really holding up, but the ETF has yet to record a 52-week low on a closing basis.
The chart below shows CIBR with the Trend Composite turning bearish on January 13th and price breaking a support zone a few days later. CIBR is now down 20% and the current decline retraced around 67% of the prior advance (+45%). The trend is clearly down right now, bit this could be a massive correction and there could be a bottom picking opportunity here (damn, did I just write that?). Bottom picking is dangerous and you best have a plan in place before making a trade. Personally, I would rather see a breakout and trend change first, and then look for the playable pullback. CIBR remains on my radar because it held up the better than most other tech related ETFs.
The Trend Composite turned bearish for the Healthcare SPDR (XLV) this week as it fell some 11% from the recent high. XLV is trading near the October lows and the decline retraced around half of the prior advance (+29%). Without a trend indicator on the chart, one could conclude that the big trend is still up because XLV recorded a 52-week high less than a month ago. XLV is also above the October low. Thus, XLV is at support, near a key retracement and oversold. This could give way to a bounce.
")