Note that I aim to post new commentary between 8 and 8:30 AM ET.
Normalization Can Lead to Volatility
Last Tuesday, I wrote about the transition phase currently underway in the markets. Actually, there are a number of transitions underway and perhaps they are linked. While I do not like to dive deep into the fundamentals, the macro backdrop for 2022 is looking very different from 2020 to 2021.
2020 was driven by the reaction to covid, which included a sharp increase in the Fed balance sheet, big fiscal spending and the work from-home-trade. ETFs related to clean-energy, cloud computing, software (SaaS) and cutting edge tech (ARKs) soared.
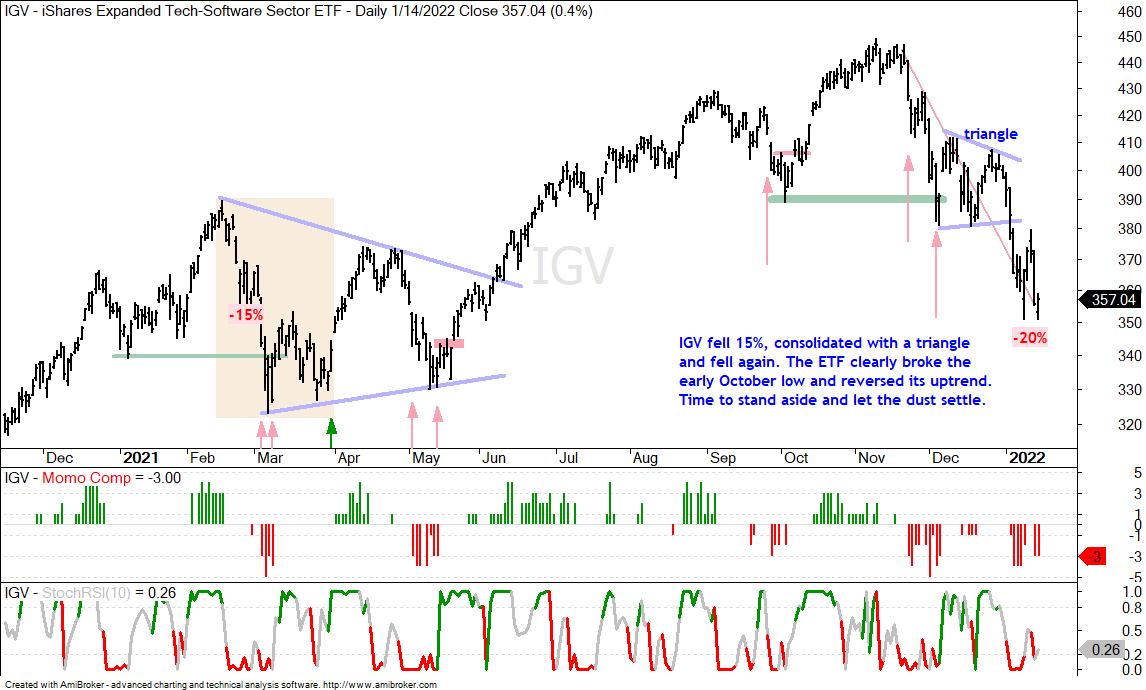
2021 was driven by the same drivers for part of the year and then we saw a shift away from the work-from-home trade. Inflation also reared its ugly head. ETFs related to banks, energy, materials and industrials performed well in the second half. Meanwhile the parabolic leaders of 2021 soured and moved into downtrends. Of note, the tech-related ETFs broke down in December with market leading declines (IGV, SKYY, FDN).
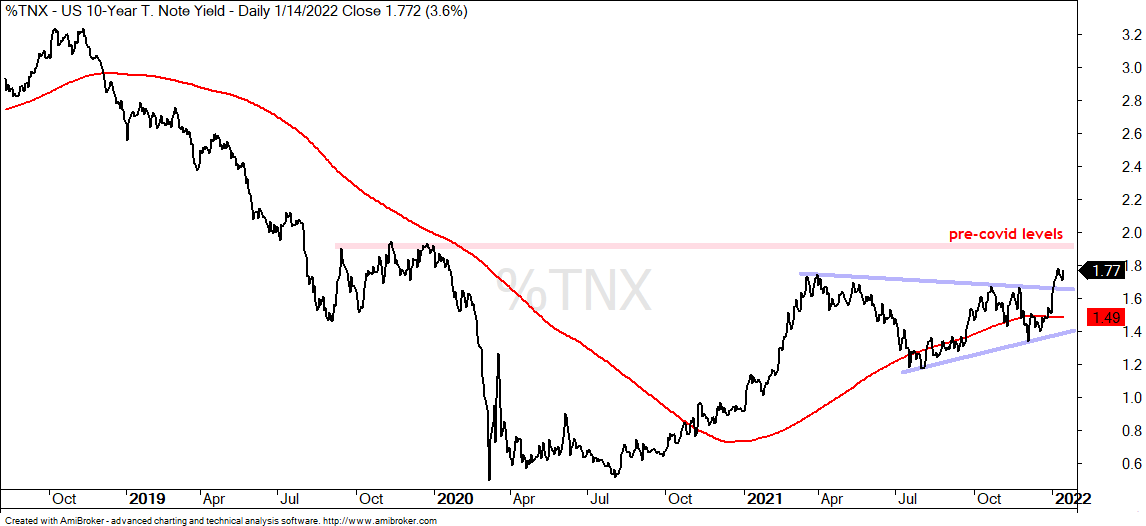
That was then, this is now. 2022 will bring in yet another playbook. There is already talk of the Fed normalizing and contracting its balance sheet. The 20+ Yr Treasury Bond ETF (TLT) broke down and the 10-yr Treasury Yield broke out. Thus, rising Treasury yields and normalization are on the horizon.
There will be no fiscal stimulus as the pandemic moves to endemic. As an aside, the combination of Fed tightening, rising interest rates and lack of fiscal stimulus makes me think that the inflation trade was last year, not this year. Remember, the markets are looking forward and pricing in the news that has yet to be reported.
Overall, the markets are normalizing and returning to an environment more akin to 2019, pre pandemic. I don’t know about you, but we are planning to normalize and treat covid like the flu, which is endemic. This also means a return to spring-summer activities, going out on a regular basis and a real summer vacation for many of us.
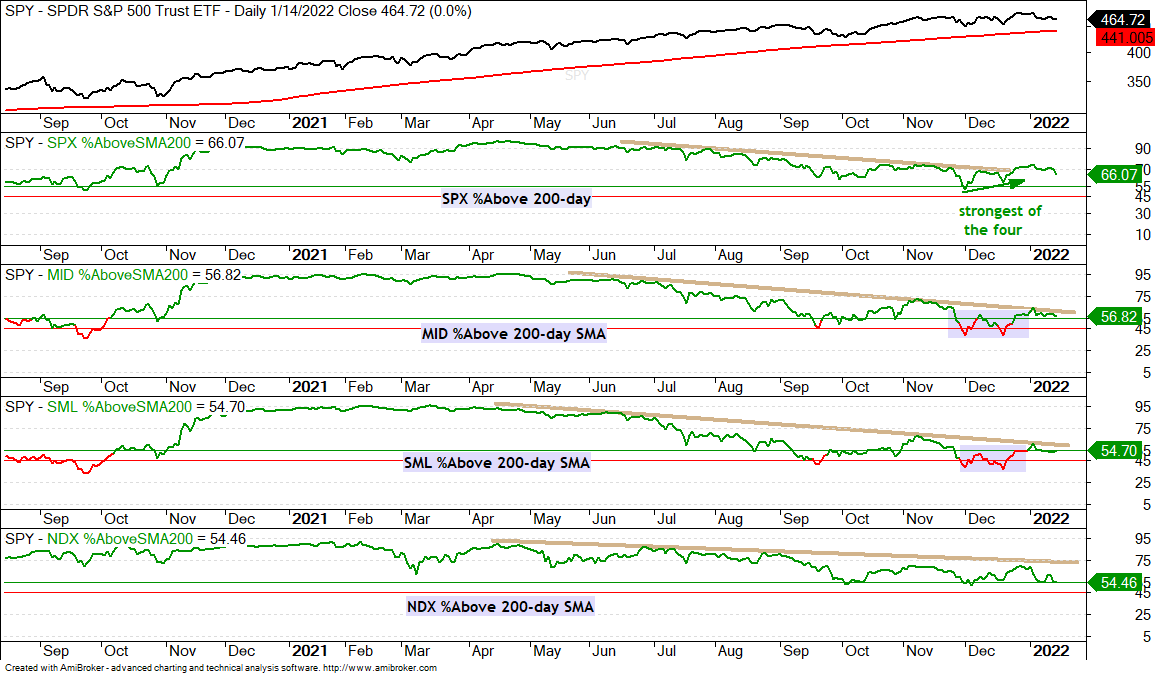
As noted on the Market Regime page, the Composite Breadth Model is net bullish and we are still in a bull market, largely thanks to strength in the S&P 500. Small-caps and mid-caps are struggling more than large-caps, which indicates that there are still some large pockets of weakness within the stock market. This makes it a challenge to pick winning stocks and ETFs. It could be rough sledding for a few months.
The chart below shows the percentage of stocks above the 200-day SMA. 66% of S&P 500 stocks are above, which means 34% are below. SPX is doing fine and is the strongest of the four. The S&P MidCap 400, S&P SmallCap 600 and Nasdaq 100 range from 54.5% to 56.8%, which means more than 40% of stocks in these indexes are below their 200-day SMAs. Those are sizable pockets of weakness (percentage of stocks in long-term downtrends).
I do not know how long the transition will last, but the rotations within the market are clear. Tech and high beta are out. Boring and value are in.
Transition phases can be difficult for trading because it usually involves an increase in volatility. Traders can mute volatility by trading less, trading smaller positions and/or widening stops.
A Choppy Channel for SPY
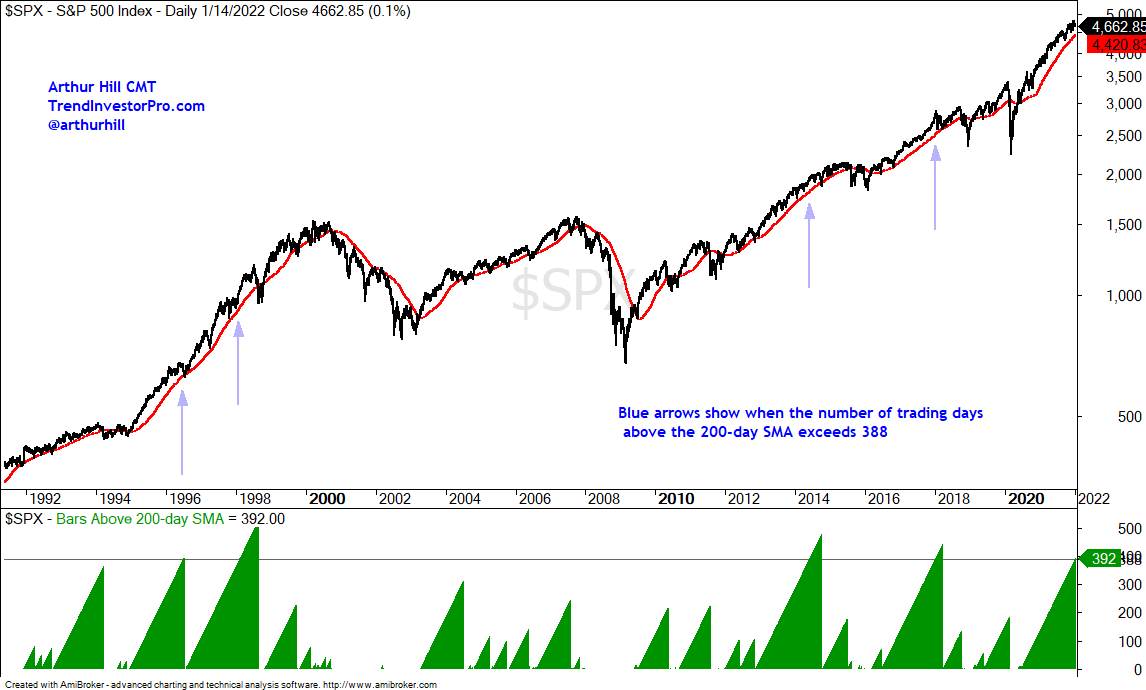
The S&P 500 remains in an uptrend. SPX hit a new high less than a month ago and is above the rising 200-day SMA. It has been 392 days since SPX touched its 200-day SMA and this is the fifth longest streak since 1990. This streak simply tells us that SPX is overdue for a test of the 200-day SMA. It does not help much with actually timing of the test.
The next chart shows SPY breaking out of a falling wedge correction in October, hitting new highs into November and chopping higher. Perhaps a channel of sorts formed and a channel break could usher in a test of the 200-day SMA, which is around 5.5% below Friday’s close.
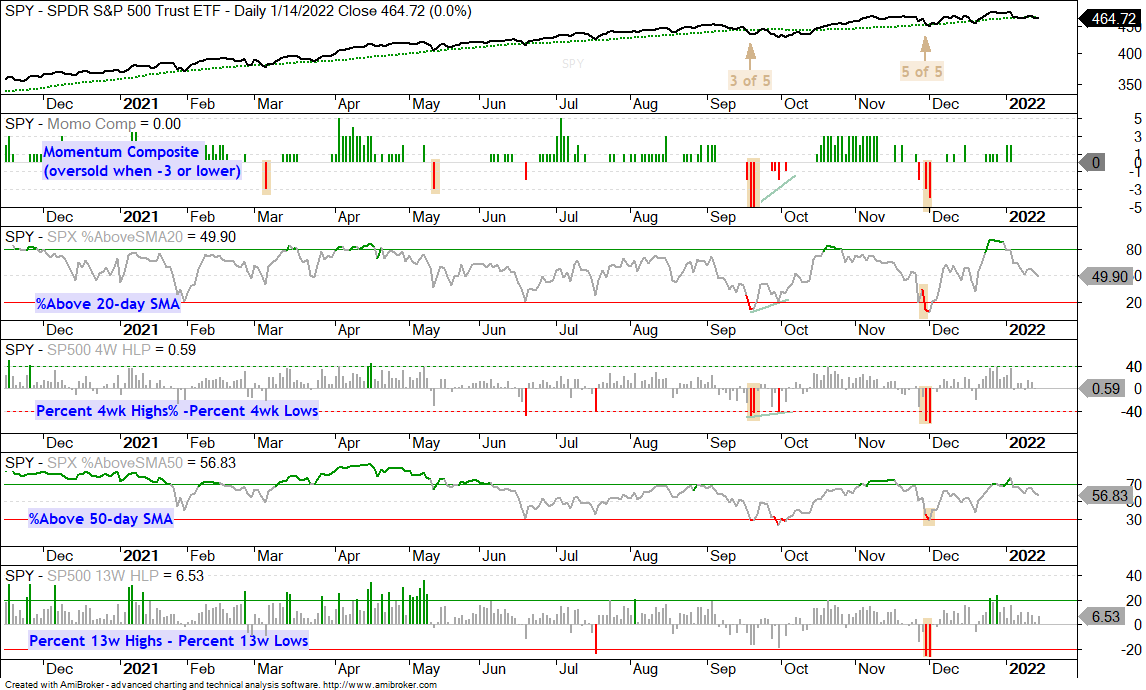
Admittedly, predicting pullbacks within uptrends is quite difficult. Traders are usually better off predicting the end of a pullback. New highs are nice to hear about, but there is no setup or tradable pattern when trading at a new high. The setups and tradable patterns form after a pullback and oversold condition. The chart below shows SPY with five indicators and not one is oversold. I will wait for some oversold conditions and a pullback before looking for a setup.
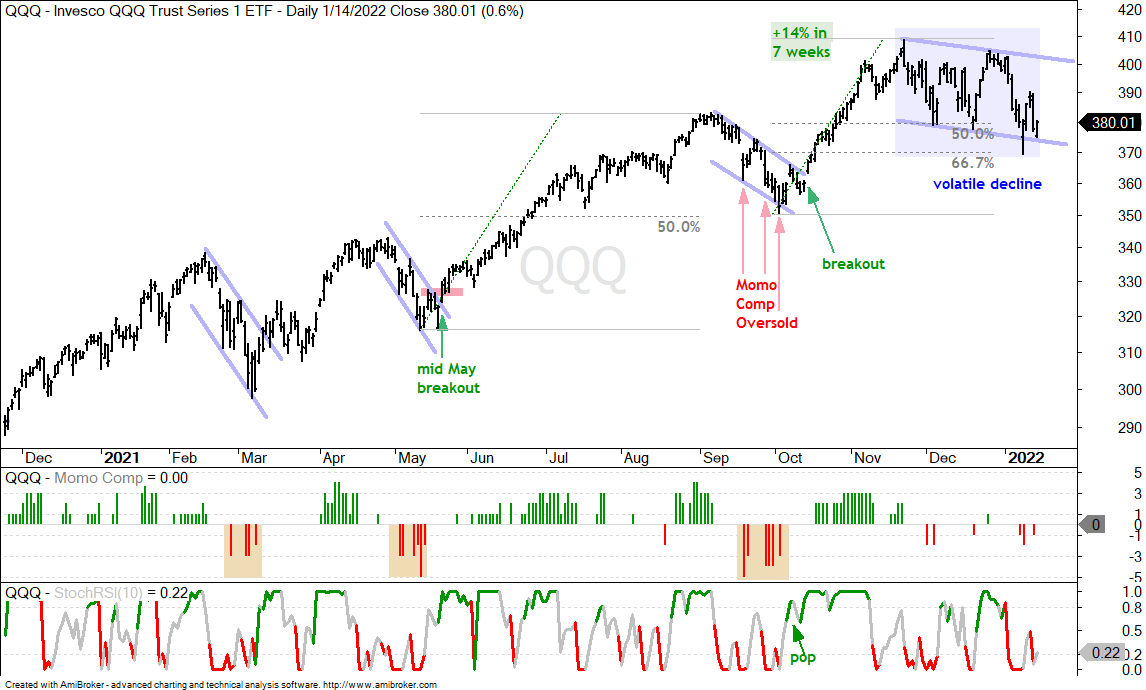
A Volatile Decline for QQQ
QQQ peaked on November 22nd and then worked its way lower with a volatile decline. This is not a controlled descent like a falling flag or wedge. Even though the pattern looks like a falling flag and QQQ retraced around 67% of the prior advance, the swings within this flag are big and this is an out-of-control decline. The increase in volatility suggests that is may be prudent to let the dust settle and/or step aside until things settle down.
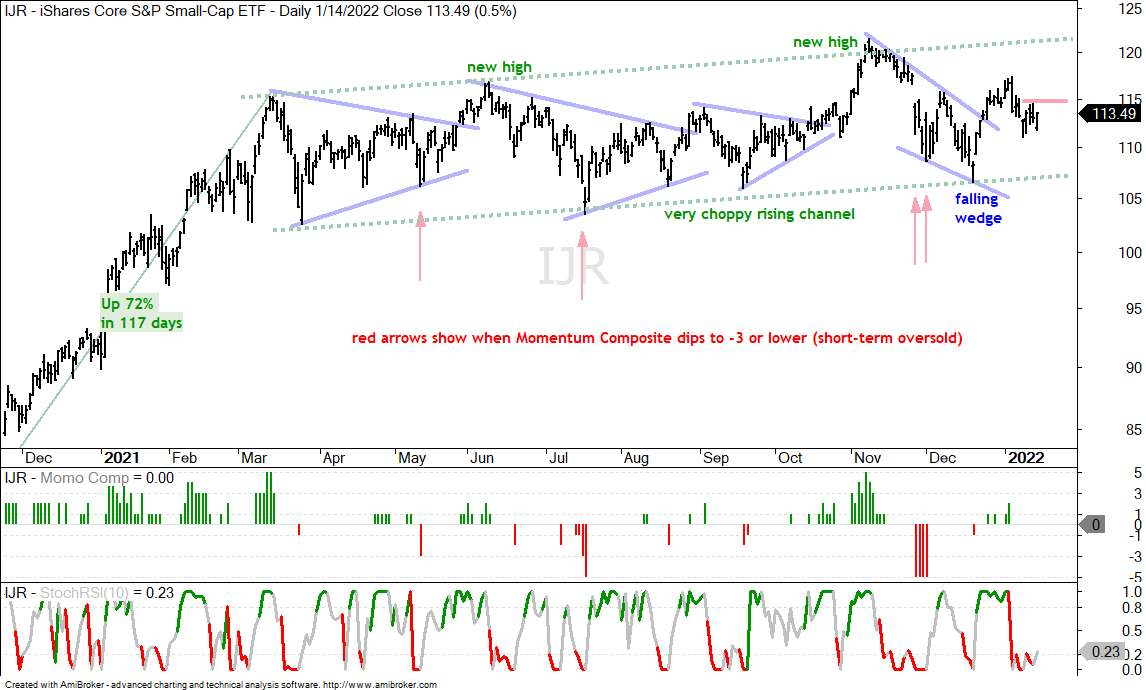
IJR Holds Up better than QQQ
The S&P SmallCap 600 SPDR (IJR) looks better than the QQQ chart since mid December. QQQ is back near its December low, while IJR remains well above its December low and shows less weakness. The chart below shows IJR in a very choppy uptrend since March 2021 (green lines). There were patterns within the channel, but the breakouts did not last long as prices dipped to the low end of the range after each breakout. Most recently, IJR broke out of a falling wedge with a surge from 21-Dec to 4-Jan. The ETF fell back the last two weeks and established resistance at 115 last week. Stock futures are pointing to a weak open on Monday, but a recovery and breakout at 115 would be bullish for IJR.
The ETFs listed and featured below are holding up the best right now. They are in uptrends of some sort and leading since the second half of December. The concern is with the broader market environment and the transition within the markets. Consumer Staples is defensive, Energy follows the price of oil and banks are following Treasury yields higher. Some commodity-related ETFs are acting well and represent an alternative to stock-related ETFs. A broad market correction, even an S&P 500 pullback of 5%, would provide a headwind for most stock-related ETFs and correlations would rise if the S&P 500 joins the correction.
New Highs the last Two Weeks (uptrends and leading)
XLP, PBJ, DBE, XLE, FCG, XLF, KRE, KBE, KIE
ETFs related to consumer staples, energy and finance are the strongest right now. They are in uptrends of various sorts and recorded new highs within the last two weeks. There are no setups on these charts, just leading uptrends.
You can learn more about my chart strategy in this article covering the different timeframes, chart settings, StochClose, RSI and StochRSI.
December Breakouts
DBA, CPER, COPX, DBB
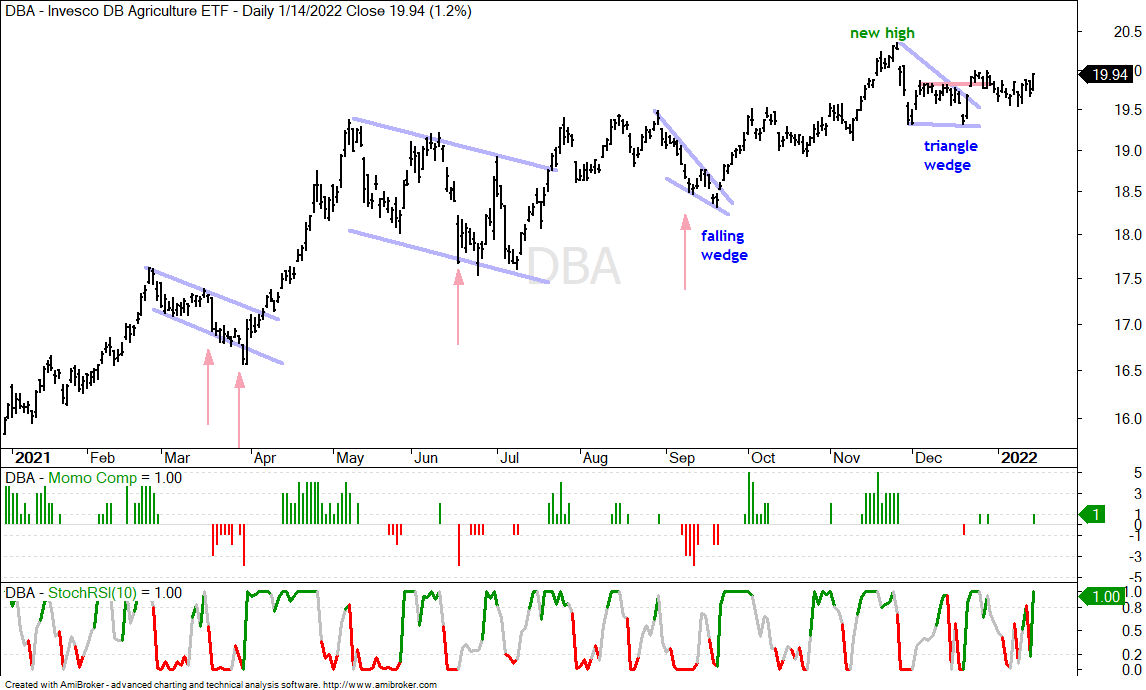
A few of the commodity ETFs are making waves here in January. The DB Agriculture ETF (DBA) hit a new high in November, fell back to its breakout zone and held support as it consolidated. A triangle breakout is in the making over the last few weeks and this signals a continuation of the existing uptrend.
The Copper ETF (CPER) and Copper Miners ETF (COPX) do not have consistent uptrends, but both charts feature October breakouts, pullbacks into December and December breakouts. Both broke out of falling wedge patterns and remained strong into January.
You can learn more about exit strategies in this post, which includes a video and charting options for everyone.
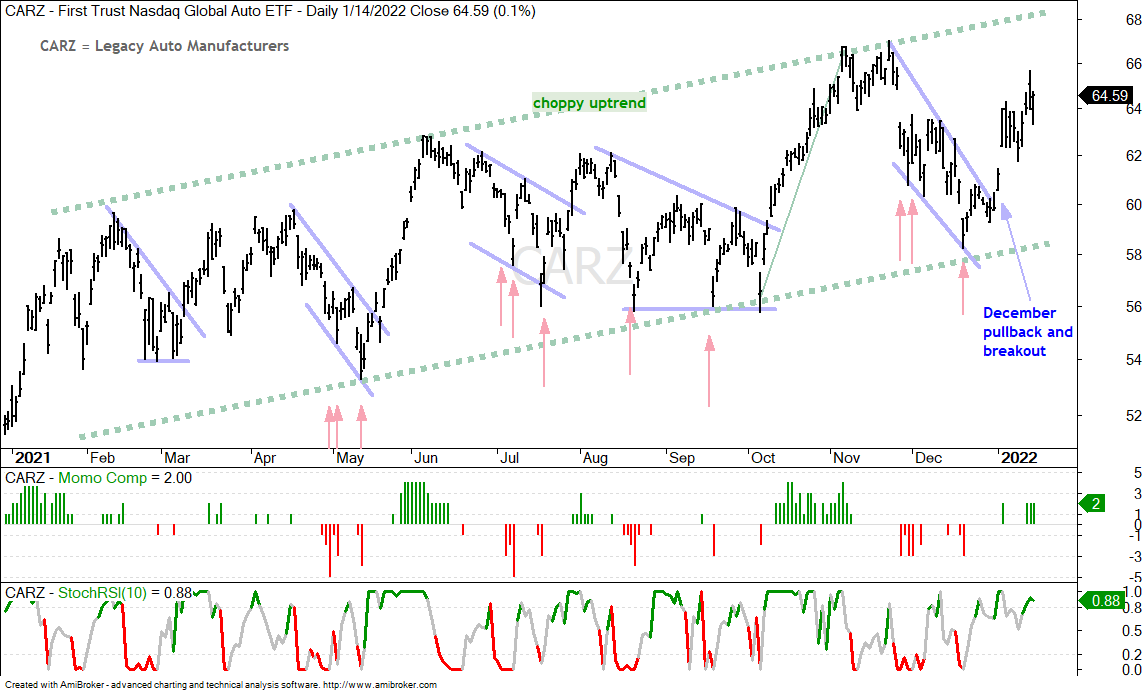
Choppy uptrend, December pullback, Breakout
CARZ, DRIV, IDRV
The Electric Vehicle ETFs are in long-term uptrends, which are quite choppy. They hit new highs in November, fell back into mid December and broke out with surges in late December. They have yet to hit fresh new highs, but the bigger trends are up and the December breakouts are holding. The uptrends and breakouts argue for further strength.
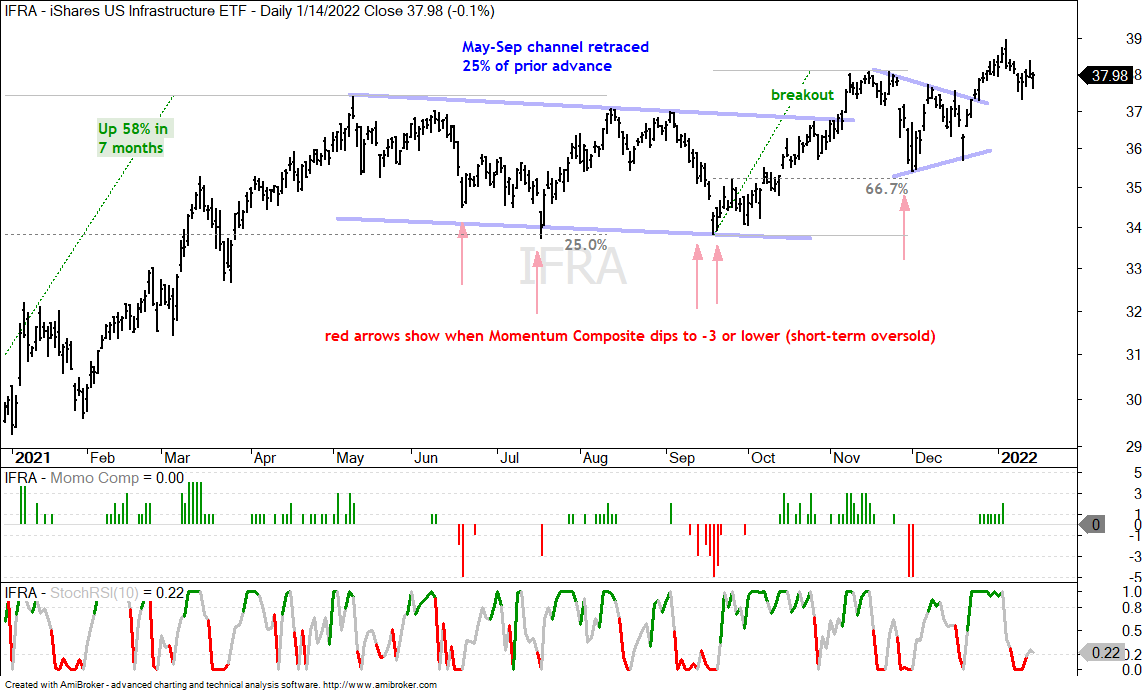
Late December Breakouts, Consolidations into January
XLB, XLI, IFRA
The Materials SPDR (XLB) and Infrastructure ETF (IFRA) broke out of long channels in late October and early November. They both hit new highs in November with double digit advances (percentage move). Triangles formed into December and these triangles were viewed as consolidations within the bigger uptrend. There were breakouts in late December, but not much follow through in January as price action turned choppy for both. Pullbacks after breakout and choppy trading seem to be more normal than abnormal for these two. The bigger picture remains bullish for both and I would re-evaluate on a break below the December lows.
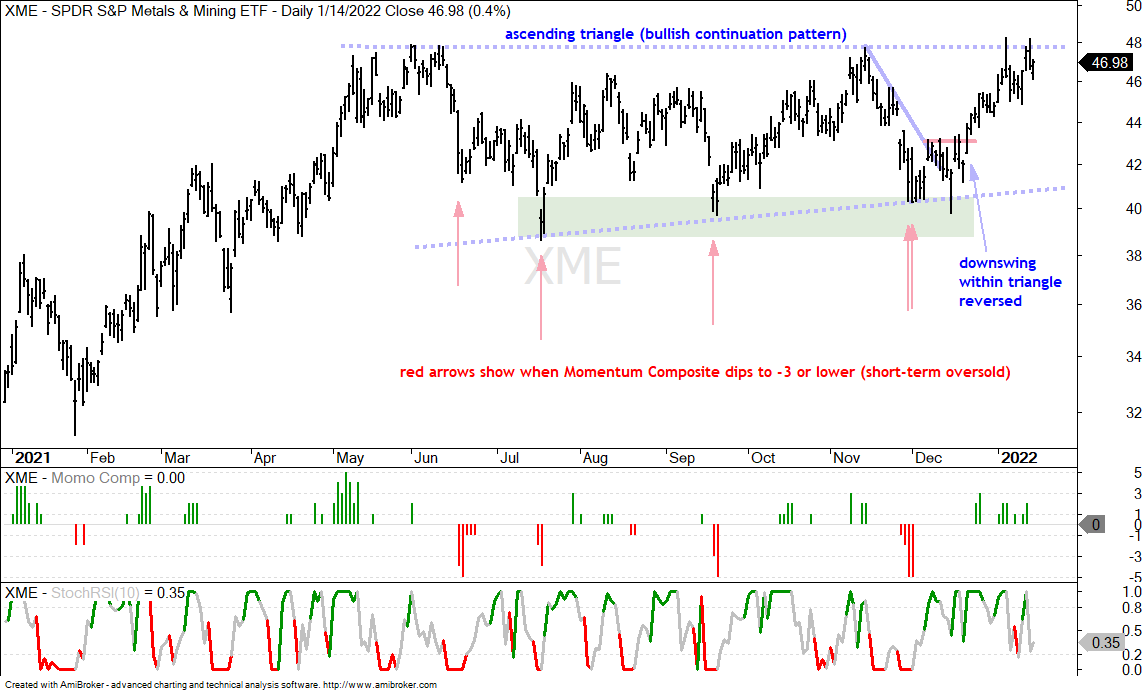
Challenging Prior Highs
The Metals & Mining SPDR (XME) gets an honorable mention because it is holding up quite well. While many ETFs broke their December lows or tested their December lows in January, XME revered its downswing with an breakout in the second half of December and surged to resistance. There is no setup right now, but XME is showing some resilience as it challenges resistance from a large Ascending Triangle.
The Momentum Composite aggregates signals in five momentum indicators. RSI(10) is oversold below 30 and overbought above 70. 20-day StochClose is oversold below 5 and overbought above 95. CCI Close (20) is oversold below -200 and overbought above +200. %B (20,2) is oversold below 0 and overbought above 1. Normalized ROC (10) is oversold below -3 and overbought above +3. Normalized ROC is the 10-day absolute price change divided by ATR(10). -3 means three of the five indicators are oversold and +3 means three of the five are overbought.
The Momentum Composite and StochClose are part of the TIP Indicator Edge Plugin for StockCharts ACP. Click here for more details.
")