")
Stocks surged on reports that inflation was less than expected. Bonds did not. This is interesting because bonds are supposed to be more vulnerable to inflationary pressures. The news, however, is just the reported news we can never be sure of the true reasons for the price moves. I will simply file the news and close the drawer. Price action is what really matters and SPY is in a short-term uptrend. So is TLT. Even though both are still in long-term downtrends, the short-term uptrends have yet to reverse and a continuation of the bigger downtrend will not happen as long as the short-term uptrends hold. Today’s report will look at these short-term uptrends, identify key support and add NDX %Above 20-day SMA to the mix. This report also covers junk bonds, gold, the Dollar, the Healthcare SPDR, the Home Construction ETF and the new Trend Composite signal in the Infrastructure ETF.
About the ETF Trends, Patterns and Setups Report
This report contains discretionary chart analysis based on my interpretation of the price charts. This is different from the fully systematic approach in the Trend Composite strategy series. In this ETF Trends, Patterns and Setups report, I am looking for leading uptrends and tradable setups within these uptrends. While I use indicators to help define the trend and identify oversold conditions within uptrends, the assessments are mostly based on price action and the price chart (higher highs, higher lows, patterns in play). Sometimes the chart assessment can be at odds with the indicators.
You can learn more about my chart strategy in this article covering the different timeframes, chart settings, StochClose, RSI and StochRSI.
SPY Surges and Exceeds May High
And just like that…inflation is over! I am not going to get into inflation forecasting or Fed policy, but I found the different reactions from the stock and bond markets rather interesting. Bonds loathe inflation and should normally rise as inflation expectations fall. Stocks surged on the news that inflation was less than expected, but bonds fell. Huh? Let’s look at stocks first using SPY as the barometer.
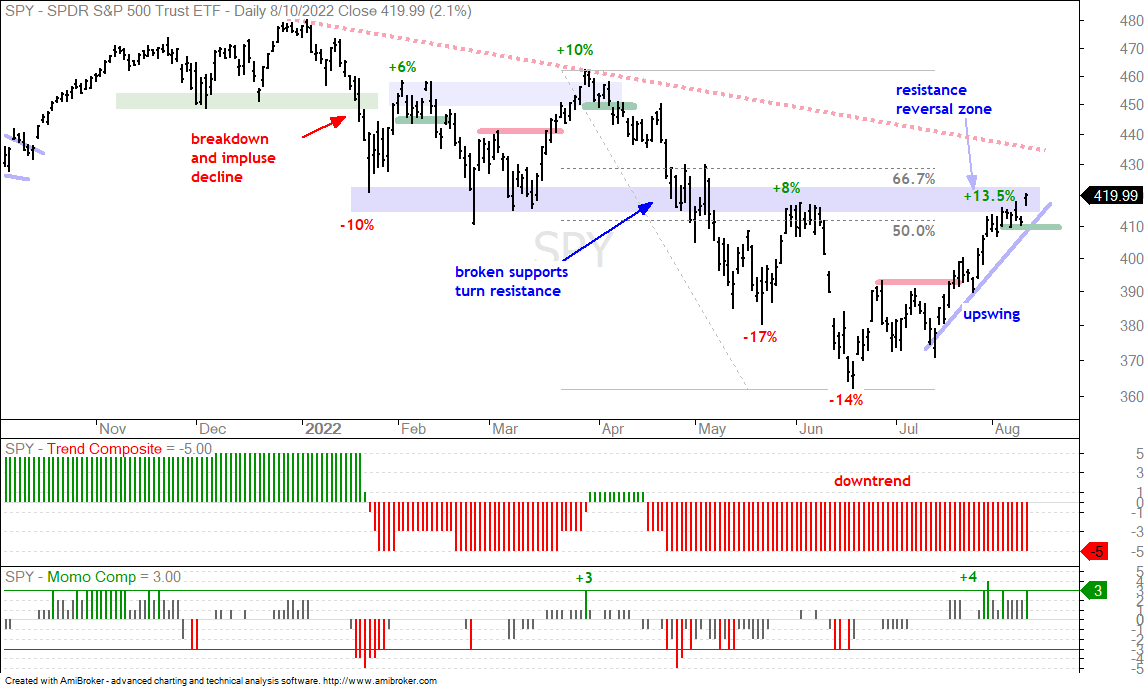
First and foremost, the Composite Breadth Model remains unchanged (-5) and we are still in a bear market. SPY is still in a long-term downtrend, but the short-term trend is up and has yet to reverse, even though it is trading in a resistance reversal zone. This is a case of becoming overbought in late July and remaining overbought into August (10th so far). SPY gapped up on the news, held the gap and closed near the high of the day. Short-term support is now set at 409 (green line). A close below this level would fill the gap and forge a lower low (short-term trend reversal).
The Momentum Composite aggregates signals in five momentum-type indicators to identify short-term overbought and oversold conditions. This indicator is part of the TIP Indicator Edge Plugin for StockCharts ACP
Short-term Breadth Indicators Remain Strong (SPY, QQQ)
The next chart shows SPY with the Momentum Composite, SPX %Above 20-day SMA and SPX %Above 50-day SMA. The Momentum Composite has been overbought from 28-July to 10-August (two weeks). %Above 20-day SMA continues to flirt with the 80% level and remains overbought. %Above 50-day SMA moved above 70% and remained above this level the last few weeks (green shading). This is a classic case of becoming overbought and remaining overbought as prices hold strong.
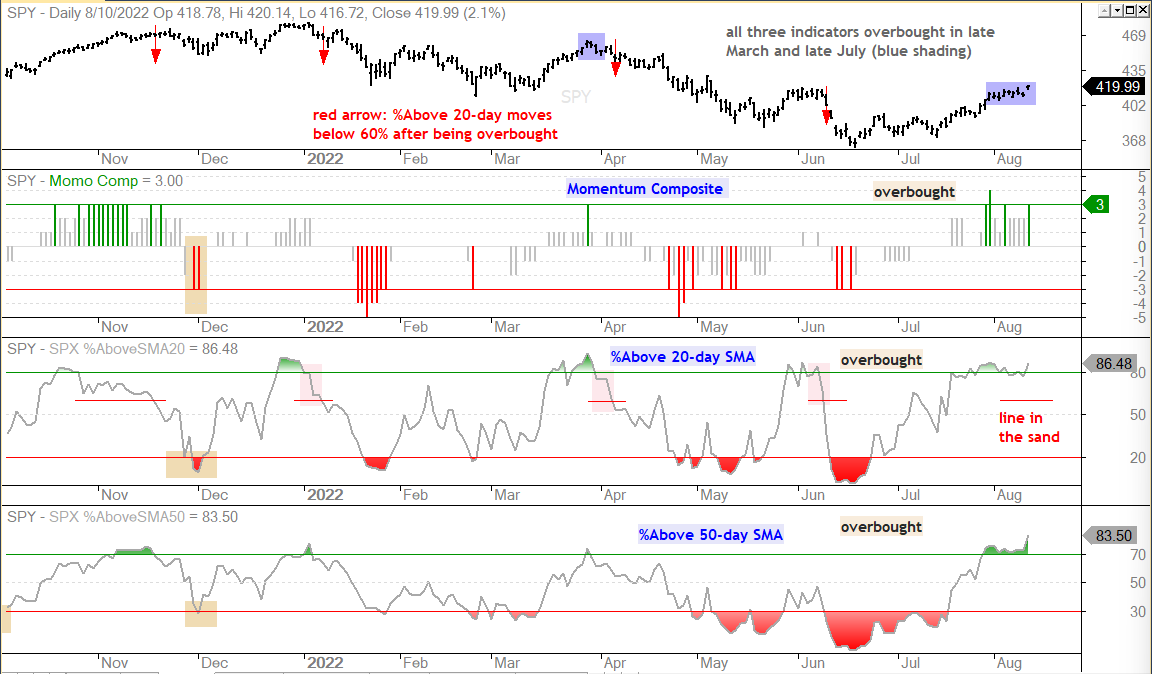
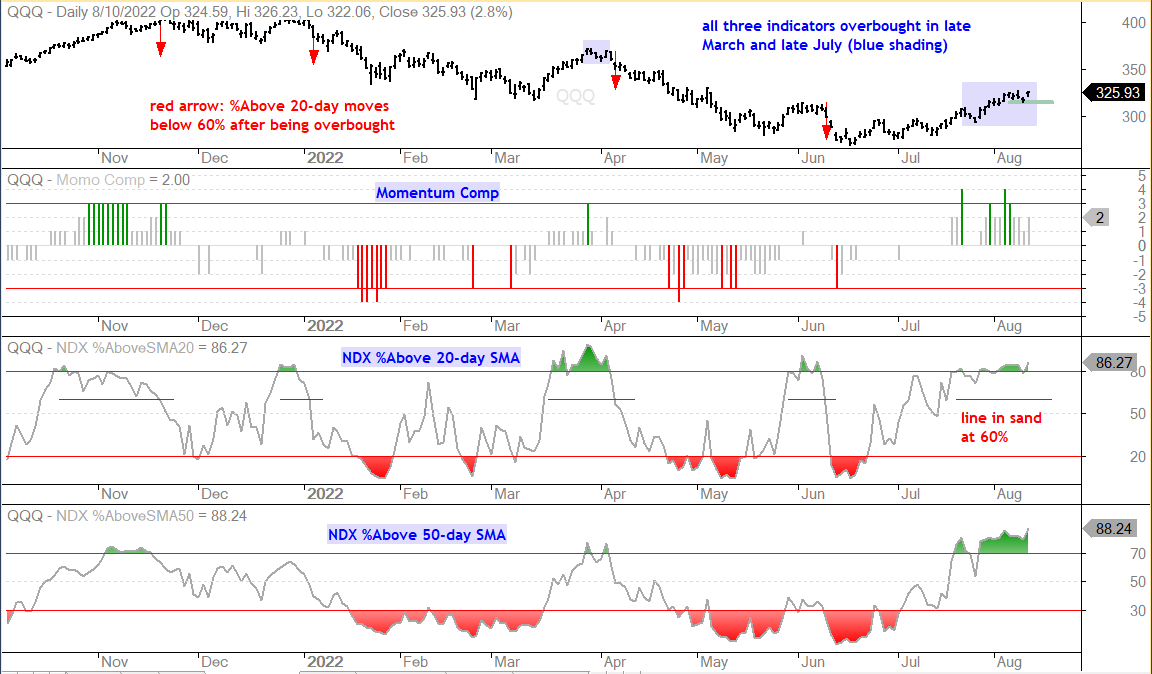
Overbought is a double-edge sword. On one hand it means prices are extended and ripe for a rest or pullback. On the other hand, overbought conditions reflect strong buying pressure, strong enough to push these indicators to relatively high levels. It is also difficult to put a time limit because overbought conditions can last a few days or a few weeks. The bulls have a short-term edge as long as overbought conditions remain. A move below 60% in both %Above 20-day SMA and %Above 50-day SMA would signal that overbought conditions have ended and the short-term uptrend is reversing. The next chart shows QQQ with short-term support at 315 and the corresponding indicators.
Bonds Fall Along with Inflation Expectations (TLT, TNX)
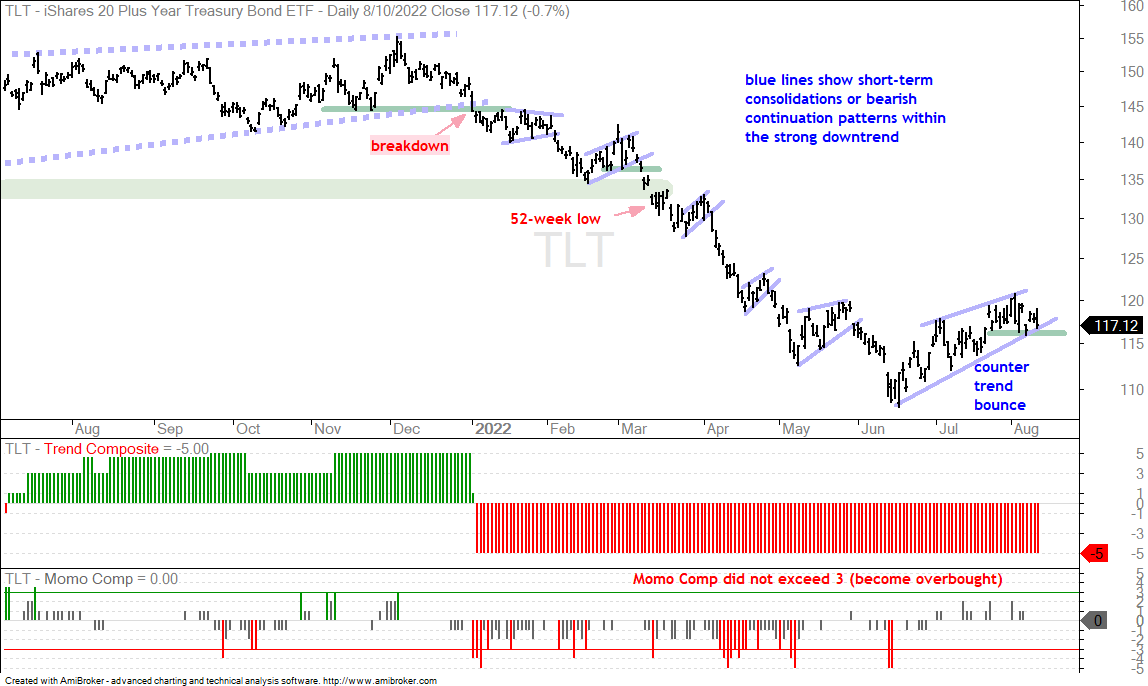
The 20+ Yr Treasury Bond ETF (TLT) remains in a situation similar to SPY: short-term uptrend within long-term downtrend. TLT did not become overbought during this uptrend because it was more subdued. Notice that the Momentum Composite has not reached +3 since December. As with SPY, the short-term trend is up for TLT as long as support holds. A rising wedge is taking shape and the ETF stalled in the 117-118 area the last two weeks. TLT traded up during the day on Wednesday, but fell back by the close. Further weakness and a close below 117 would reverse the short-term uptrend.
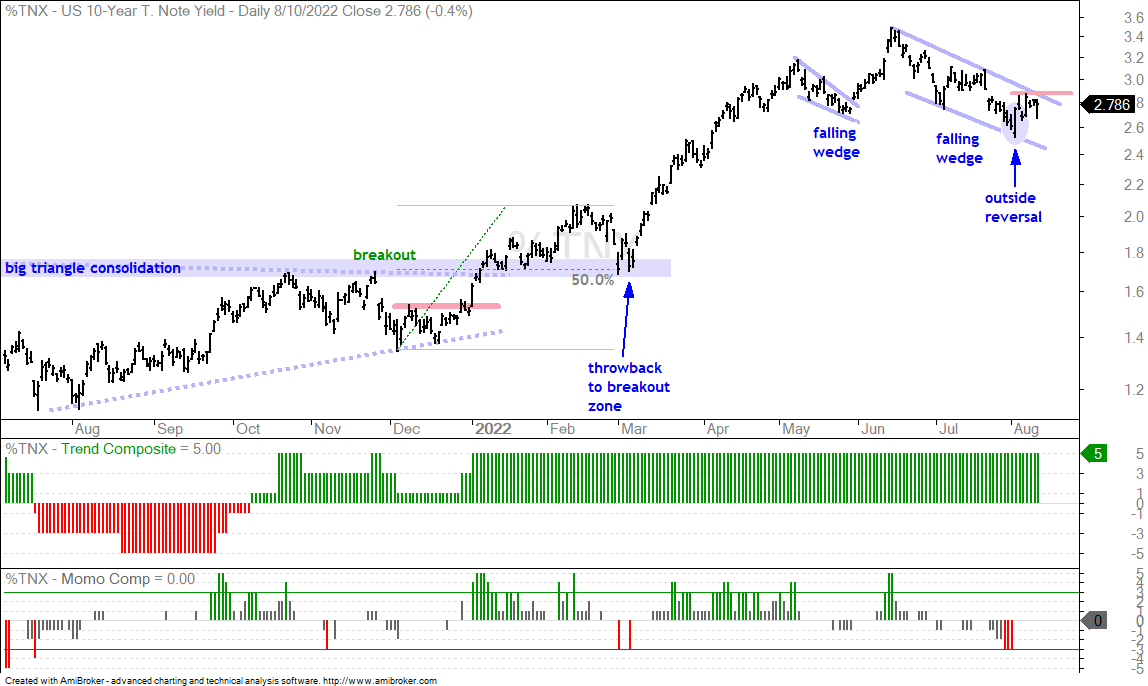
The 10-yr Treasury Yield moves opposite Treasury bonds as bonds rise when rates fall and bonds fall when rates rise. $TNX hit a new high in mid June and then fell into August with a falling wedge. These patterns are typical for corrections within a bigger uptrend. The 10yr Yield forged an outside reversal day on August 2nd and followed through with a surge on August 5th. TNX then stalled a few days and is very close to a breakout, which would signal an end to this correction and a resumption of the bigger uptrend.
You can learn more about exit strategies in this post,
which includes a video and charting options for everyone.
Junk Bond ETF Maintains Short-term Uptrend (JNK)
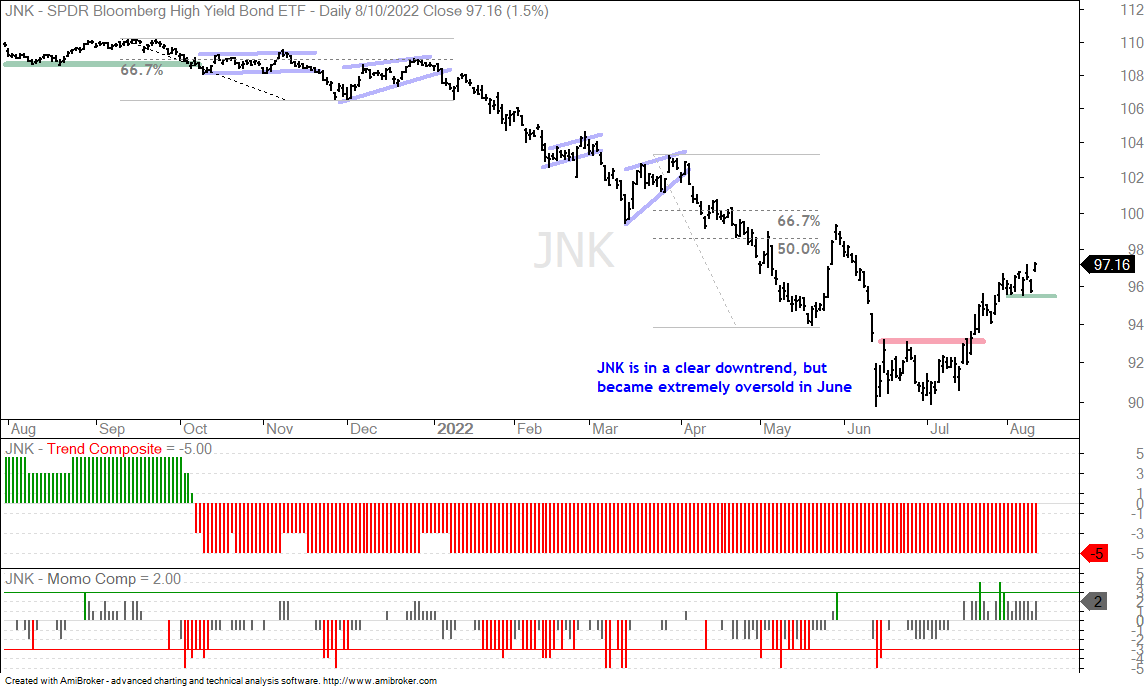
Junk bonds act more like stocks because they are tied to the performance of the economy. As with stocks, the Junk Bond ETF (JNK) fell off a cliff in early June and then surged in July. The short-term trend here is up, but the long-term trend is down as JNK hit a new low in June and the Trend Composite remains negative. As with SPY, the short-term uptrend remains in force until proven otherwise and JNK established short-term support at 95 in early August. A close below this level would reverse the short-term uptrend and would be a sign that risk-off is returning.
Dollar Plunges as Stocks Surge (UUP)
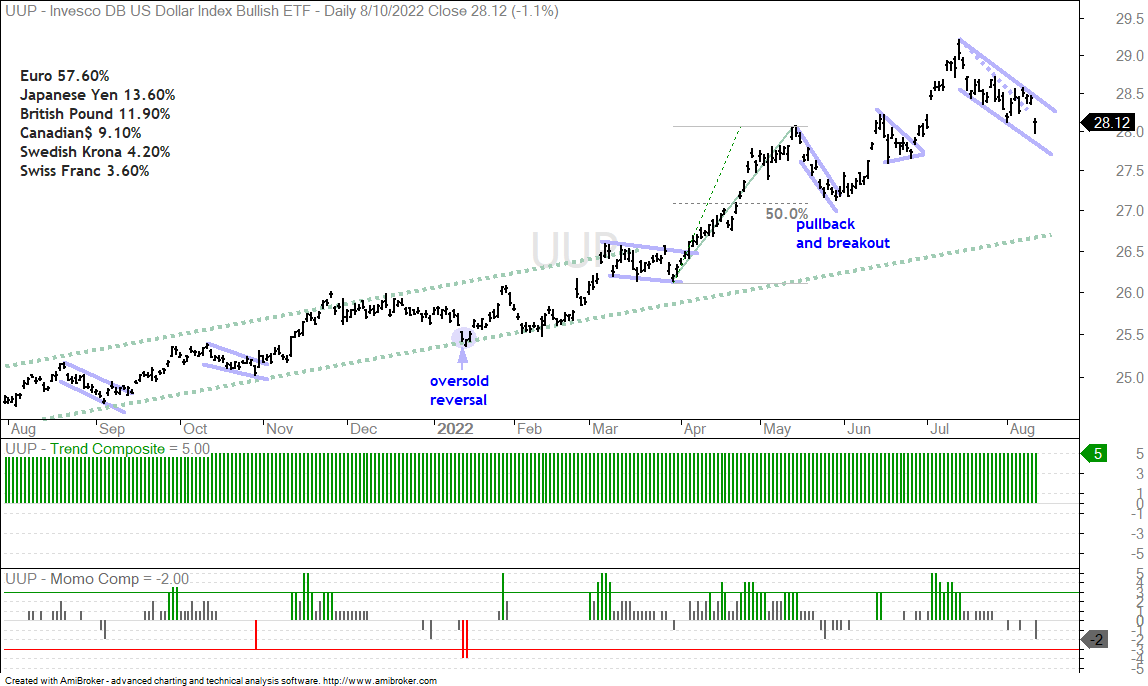
The Dollar Bullish ETF (UUP) and SPY have been negatively correlated in 2022. Note that these two were mostly positively correlated in 2021, which means relationships do change. The chart below shows UUP falling sharply as SPY surged on Wednesday. The previously drawn falling wedge breakout (dashed line) failed, but the overall trend is still up and the five week decline is viewed as a mere correction. This correction could extend as long as SPY remains strong. A breakout in the 10-yr Treasury Yield and breakdown in SPY, however, would likely lead to an upside breakout in the Dollar.
Gold hits Resistance-Reversal Zone (GLD)
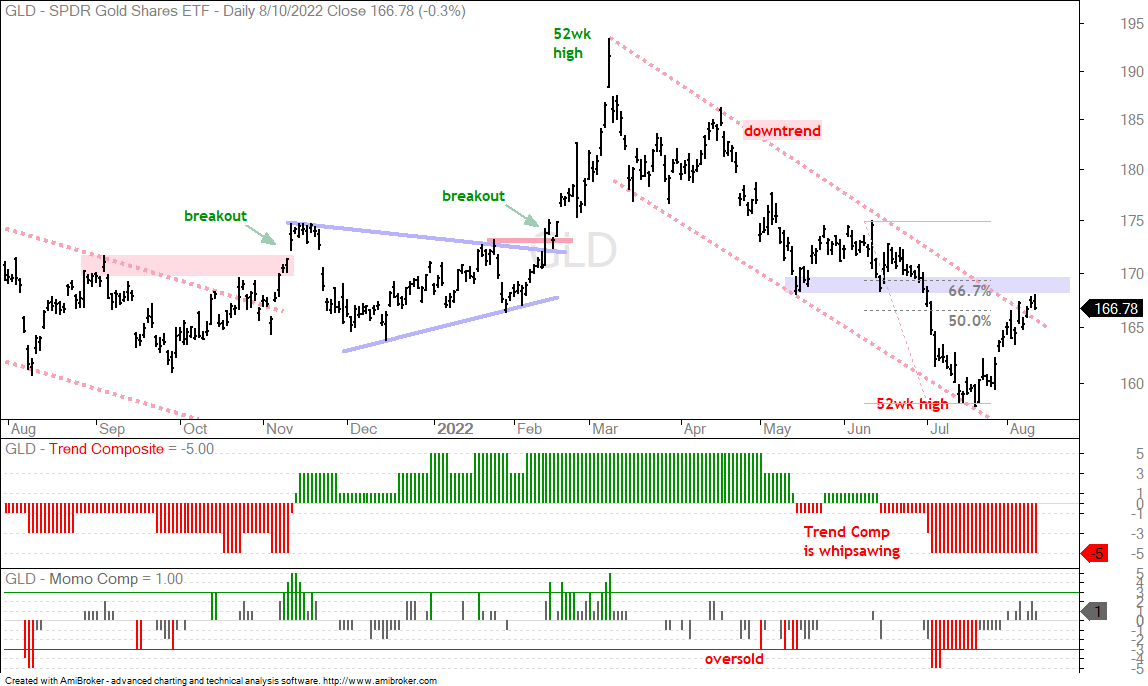
The Gold SPDR (GLD) chart reflects volatility in the markets overall. GLD hit a new high in mid March and a then fell to new low in mid July. We can blame the February-March surge on the war in Ukraine and the May-July decline on general weakness in commodities. GLD bounced along with the rest of the commodity world the last four to five weeks, but this bounce is still deemed a counter-trend bounce within a bigger downtrend. GLD is also running into resistance from broken support and the 50-67% retracement zone.
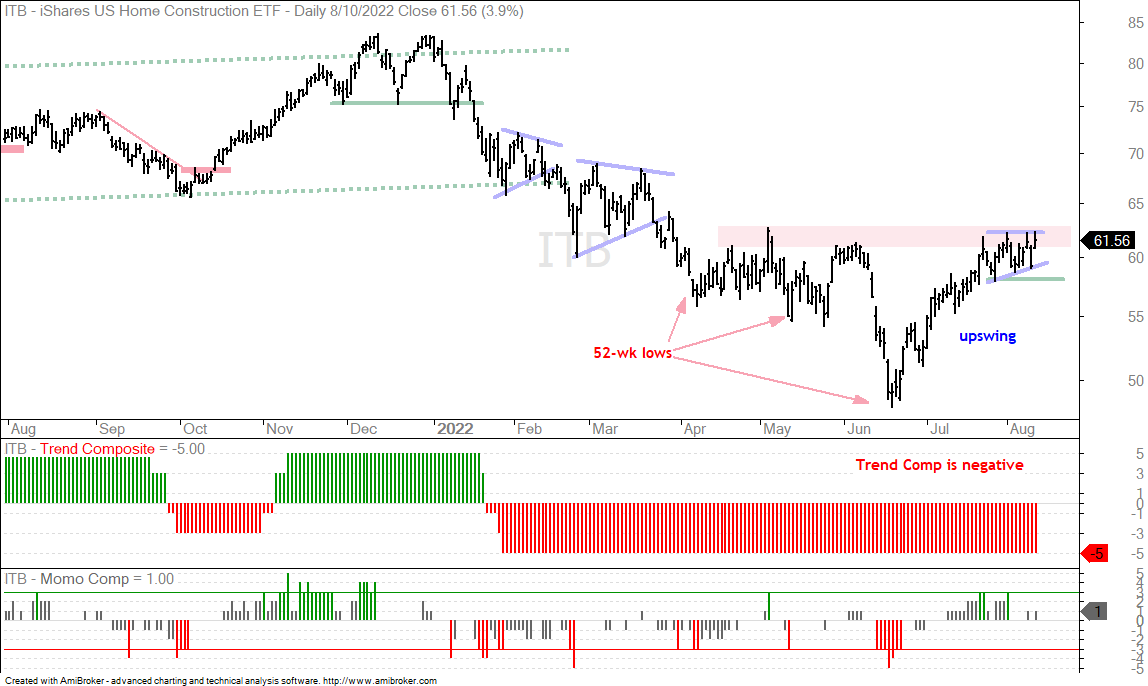
Home Construction ETF Consolidates after July Surge (ITB)
The next chart shows the Home Construction ETF (ITB) running into resistance from the spring highs in the low 60s. The short-term trend is still up as ITB simply consolidated after the initial surge from mid June to late July. This short-term consolidation (blue lines) established support at 58 and a close below this level would reverse the short-term uptrend. Even though the bigger trend is still down, a short-term consolidation after a sharp advance can be a bullish continuation pattern and a breakout would be short-term bullish. I will be watching the 10-yr Treasury Yield on this because a breakout in the 10yr would likely be negative for ITB.
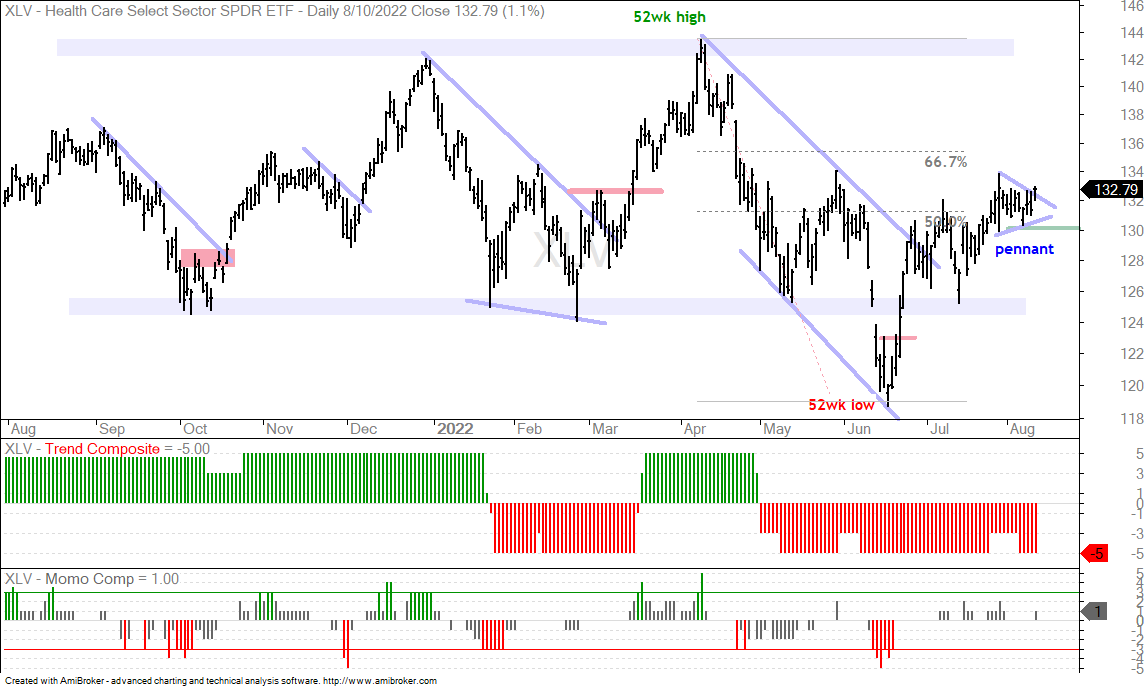
Healthcare SPDR Breaks Out of Pennant (XLV)
The Healthcare SPDR (XLV) was a leading ETF in early July, but turned into a lagging ETF as the broader market surged in the second half of July. Long-term, XLV is trading in the middle of its one year range. Note that XLV forged a 52-week high in mid April and a 52-week low in mid June. The immediate trend is up with a pennant forming in early August and a breakout on Wednesday. This short-term breakout keeps the uptrend alive and uptrend support is set a 130.
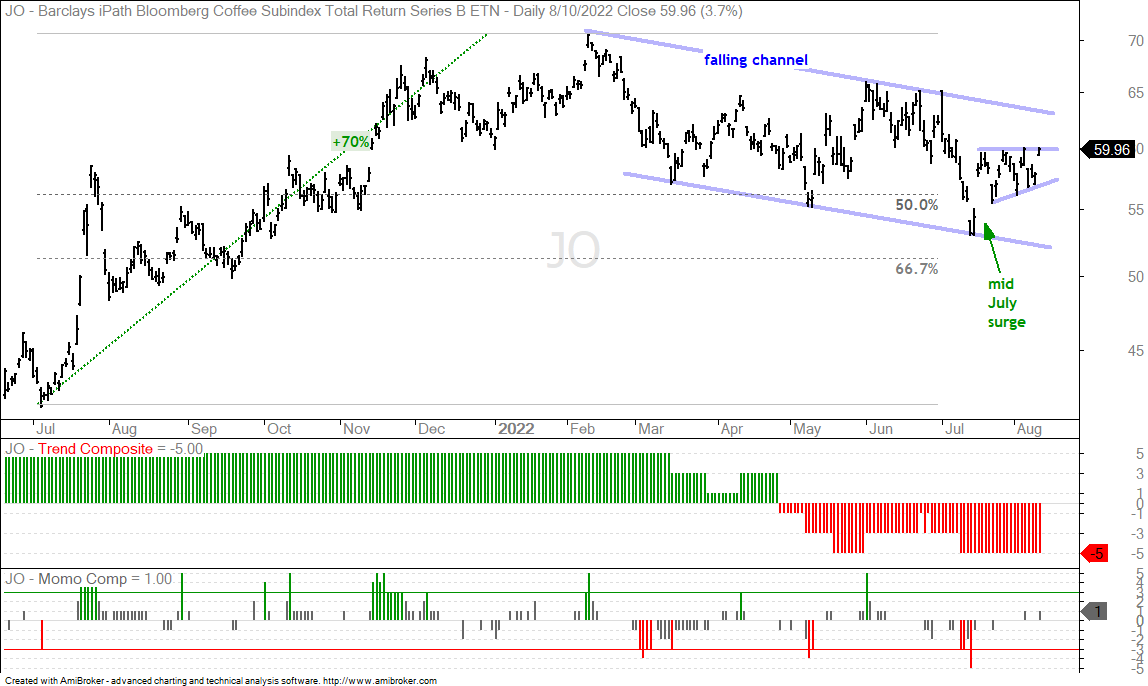
Coffee ETF Forms Small Ascending Triangle (JO)
The Coffee ETF (JO) remains on the radar as it formed a small Ascending Triangle within a bigger falling channel. Even though the Trend Composite is negative, I view the falling channel as a long correction after the 70% advance because it retraced 50 to 67 percent. JO surged in mid July and then consolidated with what looks like a small Ascending Triangle. These are bullish continuation patterns and a close above 60 would trigger a bullish signal.
Reducing Whipsaws and Adding Lag (IFRA)
There is no such thing as the perfect indicator with the perfect settings. All indicators have their ups and downs. A lot depends on market conditions, which are always changing. The default Trend Composite indicator is based on 125 days, which covers six months. I view this as the sweet spot for trend identification. Sometimes, however, 125 days is not long enough and susceptible to whipsaws. In this case, chartists can consider moving to 200 days, which covers around nine months. This will reduce the whipsaws, but also add more lag.
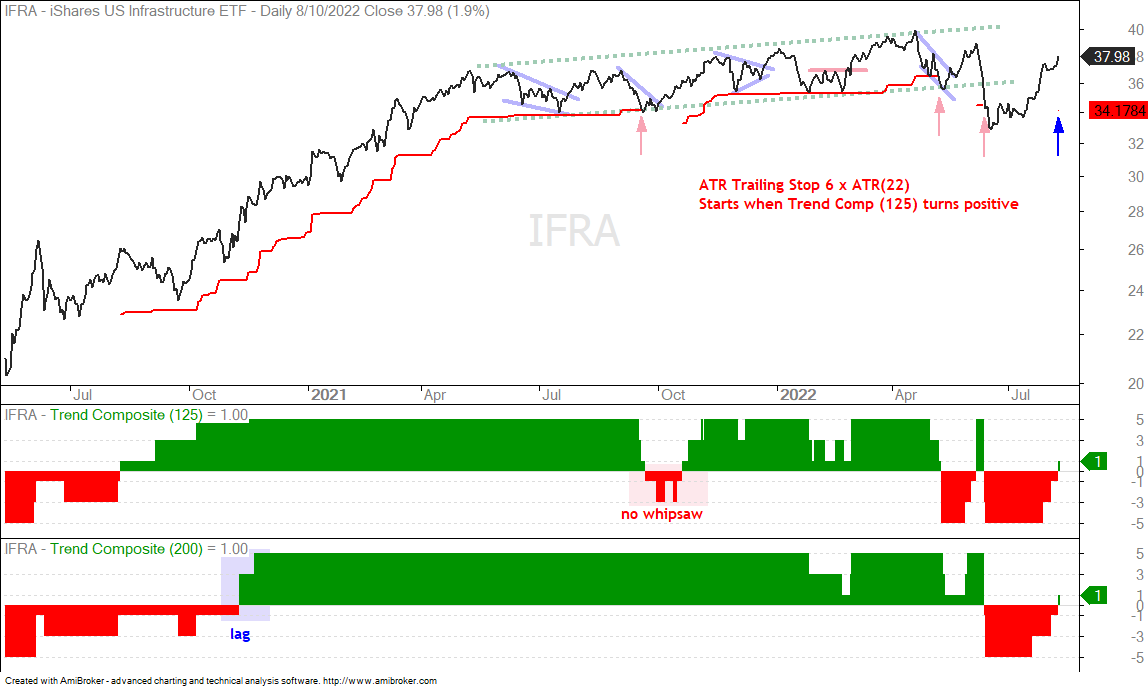
The chart above shows the Infrastructure ETF (IFRA) with the Trend Composite (125) in the first window and the Trend Composite (200) in the middle window. Notice that the 125-day Trend Comp turned bearish in September 2021 (whipsaw), but the 200-day Trend Comp did not. Also note that the 125-day Trend Comp turned bullish in August 2020, but the 200-day Trend Comp did not turn bullish until November 2020 (lag).
I chose IFRA because the 125-day Trend Composite turned bullish yesterday (and so did the 200-day Trend Comp). The red lines on the chart show the ATR Trailing Stop (6 x ATR(22)) activating when the 125-day Trend Comp turns positive. The red arrows show when the stop was hit (three times). The blue arrow shows the current trend-following stop (34.17). The Trend Composite also turned positive for the Utilities SPDR (XLU), Select Dividend ETF (DVY) and Clean Energy ETF (PBW) on Wednesday.
The Trend Composite aggregates signals in five trend indicators: Bollinger Bands (125,1), Keltner Channels (125,2), 5-day Rate-of-Change of 125-day SMA, StochClose (125,5) and CCI-Close (125). The Trend Composite and ten other indicators are part of the TIP Indicator Edge Plugin for StockCharts ACP
Previous Commentary and Video
Wednesday Market and ETF Video (here)
Market Regime Update with Breadth Model and Yield Spreads (here)
Topics Covered in Tuesday’s Report (here)
- Breadth Model Remains Bearish
- New Trend Composite Signals with an Asterisk
- SPY, QQQ and IWM Hit Resistance-Reversal Zones
- Dissecting the Trend Composite Signal in IBB
- A Tale of Two ATR Trailing Stops (IBB, XBI)
- Trend Signals and Trailing Stops for Clean Energy (TAN, ICLN)
- Lithium Battery Tech ETF Triggers Uptrend (LIT)
- Energy ETFs Fall Back after Breakouts (XOP, FCG)
- Concern with Weakness in Oil (WTIC, DBE)
- Palladium Exceeds July High (PALL)
- Wheat and Agriculture ETFs Firm after big Declines (WEAT, DBA)
- 20+ Yr Treasury Bond ETF Affirms Upswing Support (TLT)
You can learn more about my chart strategy in this article covering the different timeframes, chart settings, StochClose, RSI and StochRSI.