The broad market environment for stocks is more bearish than bullish. The Composite Breadth Model is negative, more stocks are below their 200-day SMAs than above and the S&P 500 is below its 200-day. Also note that yield spreads are rising again, offensive groups are lagging and defensive groups are leading. These are not bull market conditions. Even though defensive groups are holding up, they are still stock-related ETFs and could come under pressure should the market deteriorate further. I continue to see leadership in ETFs related to energy, industrial metals, agriculture, precious metals and aerospace/defense.
Composite Breadth Model Remains Bearish
The Composite Breadth Model turned bearish on April 11th and remains bearish. Overall, the market is quite split, but the pockets of weakness outweigh the pockets of strength. This split is reflected in the four breadth inputs. The S&P 500 Trend and Thrust Models are net positive, but the S&P 1500 Trend and Thrust Models are net negative. Large-caps are holding up better than small and mid caps. The 5/200 day SMA cross for the S&P 500 has been the tiebreaker this year with five crosses since late January. The 5-day SMA is currently below the 200-day SMA and this means risk is above average in the stock market.
About the ETF Trends, Patterns and Setups Report
This report contains discretionary chart analysis based on my interpretation of the price charts. This is different from the fully systematic approach in the Trend Composite strategy series. In this ETF Trends, Patterns and Setups report, I am looking for leading uptrends and tradable setups within these uptrends. While I use indicators to help define the trend and identify oversold conditions within uptrends, the assessments are mostly based on price action and the price chart (higher highs, higher lows, patterns in play). Sometimes the chart assessment can be at odds with the indicators.
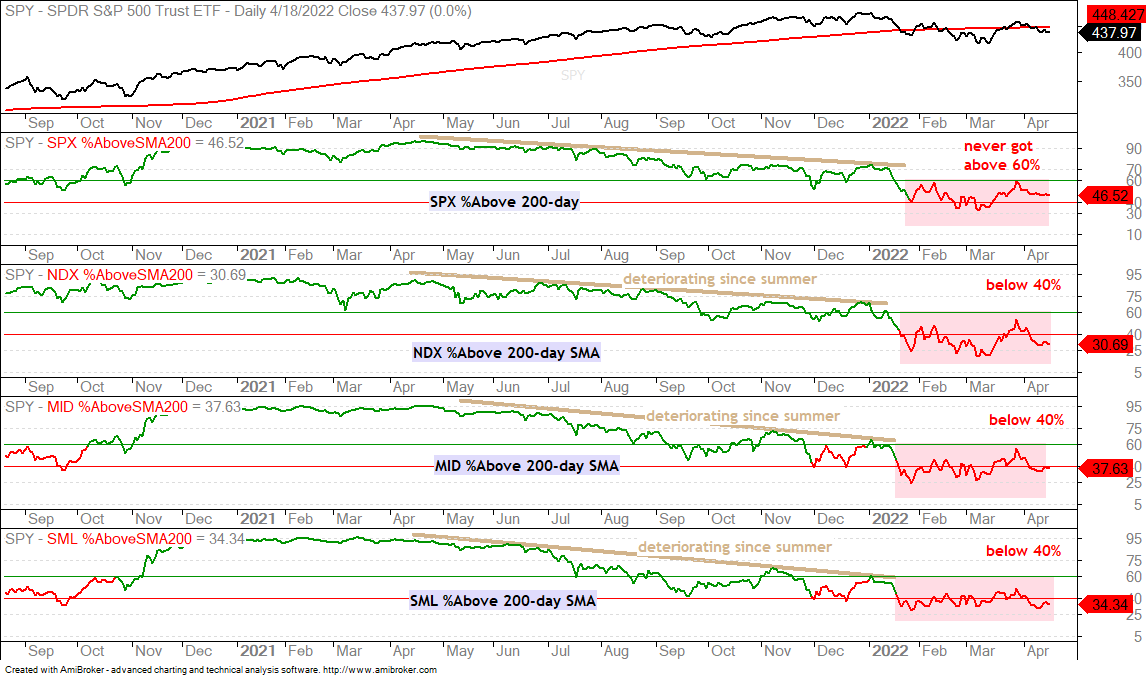
Two Thirds of Stocks in Long-term Downtrends
The percentage of stocks above the 200-day SMA sums up the current environment quite well. 46.5% of S&P 500 stocks are above their 200-day SMAs (53.5% below). The numbers deteriorate for the other indexes: Nasdaq 100 is just 30.7%, S&P MidCap 400 is 37.6% and the S&P SmallCap 600 is 35%. Roughly 2/3 of stocks in the S&P 1500 are below their 200-day SMAs and this makes it a difficult environment for stocks.
Trend Turns Down for SPY
The Trend Composite turned negative for SPY, which means it joins the other major index ETFs with a negative Trend Composite (QQQ, MDY, IJR, IWM, IWC). The swings in 2022 are quite large with a 15% decline from early January to early March, a 10% advance from mid March to late March and a six percent decline the last 13 days. Longer-term, I am treating the January-March decline as the move that broke the bull’s back (impulse decline) and the March bounce as one heck of a counter-trend bounce. This bounce failed in the blue zone so now we have a lower high from January to late March. The red dotted lines define the downtrend.
As noted above, we have seen some really big swings in 2022. The next chart shows seven swings ranging from -10% to +10% (closing prices) in just 73 trading days. That means one big swing every ten days or so. The current down swing is 13 days and a somewhat oversold. Also note that on average SPY is moving 1.13% per day over the last 65 days. This is also a relatively high number.
Personally, I ignore bullish setups when the Composite Breadth Model is bearish and the Trend Composite is negative. Nevertheless, I do see a short-term bullish setup and SPY is short-term oversold. The 13-day decline retraced around half of the March surge and returned to the breakout zone. A falling flag also formed and a small spinning top formed on Monday. After the long black candlestick on Friday, this spinning top shows indecision that can foreshadow a short-term reversal. A gap and long white candlestick today would forge such a reversal.
I noted last week that it is vital that we know your strategy and adhere to that strategy. This is akin to knowing thyself. Anthony Davis is a great basket-baller, but a lousy three point shooter. His strategy should not be built around the 3-point shot. As enticing as this setup looks, it does not fit my strategy and is therefore not considered. Learning what to ignore is just as important.
The next chart shows QQQ with a reversal in the blue zone and a downtrend here in 2022 (red dotted lines). The ETF is also experiencing big swings this year with an average move of 1.68% the last 65 days. This basically shows rising volatility and this is more negative than positive. QQQ fell around 9% the last 13 days and is short-term oversold. It is also near the 67% retracement line with a falling flag, but I am not taking the setup because it does not fit my strategy. My strategy is to look for pullbacks within uptrends, not within downtrends.
A Clearly Defensive Picture
My weekend article for ChartWatchers at StockCharts.com showed that the defensive sectors are leading and up, while the offensive sectors are lagging an down over different timeframes (3, 6 and 12 months). When offensive sectors and groups are up, but lagging, I am usually not concerned, even when defensive groups are outperforming on a relative basis. The concern comes when the offensive sectors and groups are actually down and weighing on the broader market. This is the case now.
The five offensive sectors are the Technology SPDR (XLK), Communication Services SPDR (XLC), Finance SPDR (XLF), Industrials SPDR (XLI) and Consumer Discretionary SPDR (XLY). Together they account for around two thirds of the S&P 500 and they are also down over the last three months. Not only are they down, but they are also down more than SPY and leading lower. The three defensive sectors are the Healthcare SPDR (XLV), Consumer Staples SPDR (XLP) and Utilities SPDR (XLU). These three are up and leading. The Energy SPDR (XLE), Materials SPDR (XLB) and Real Estate SPDR (XLRE) fit in the “other” category.
Also note that the Semiconductor ETF (SOXX) is down 17.24%, the Regional Bank ETF (KRE) is down 15.8%, the Home Construction ETF (ITB) is down 22.5% and the Retail SPDR (XRT) is down 7.4% over the last three months. These are also important groups and they are leading lower.
This is not the market environment for taking big risk or being fully invested in stock-related ETFs. The Composite Breadth Model is bearish, the S&P 500 is below its 200-day, the majority of stocks are below the 200-day SMAs and the wrong groups are up/down.
Utes, Food/Beverage and Healthcare Lead
The defensive groups remain with strong uptrends. These include the Utilities SPDR (XLU), Infrastructure ETF (IFRA), Consumer Staples SPDR (XLP), Food & Beverage ETF (PBJ), Healthcare SPDR (XLV) Healthcare Providers ETF (IHF) and Dividend ETF (DVY). DVY is loaded with staples, utilities and REITs. I do not see any setups on these charts because they became quite extended after big moves in March. The first charts show XLU and PBJ with big moves to new highs. There is no setup, just a strong uptrend that is short-term overbought. The blue shading marks a zone to watch should we get a pullback (broken resistance and 50% retracement).
You can learn more about exit strategies in this post, which includes a video and charting options for everyone.
The next chart shows XLV with a market leading new high last week and a pull back working the last five days. The blue shading marks the first potential reversal zone (50% retracement and broken resistance). This is an area to watch for support and a bounce.
Oil and Energy-Related ETFs Remain the Big Leaders
Oil surged the last five days with a move back above $100. The chart shows West Texas Intermediate ($WTIC) in the top window and the DB Energy ETF (DBE) in the lower window. The bigger pattern is a wedge-type consolidation or pullback after the surge above 120. The swing within this wedge was down until last week’s breakout (smaller wedge). The overall trend is up and the big wedge is deemed a bullish continuation pattern. A breakout at 110 would open the door to a new high in oil.
The next chart shows XLE with a flag breakout on March 21st, a bit of a stall in the 75-80 area and a push to new highs the last six days. No setup here, just a strong and leading uptrend. The second chart shows the Oil & Gas Equipment & Services ETF (XES) with a similar flag breakout and an even stronger push to new highs.
The Trend Composite aggregates trend signals in five trend-following indicators: 5-day ROC of 125-day SMA, Bollinger Bands (125,1), Keltner Channels (125,2,125), CCI (125) based on Closing Prices and StochClose (125, 5). You can learn more about the Trend Composite here.
The DB Agriculture ETF (DBA) broke out of a falling wedge on March 21st, stalled as a triangle formed and broke out of this pattern last week. DBA hit a new high on Monday and agricultural commodities are also leading.
Within DBA, the Corn ETF (CORN), Soybean ETF (SOYB) and Sugar ETF (CANE) hit new highs over the last few days. The chart below shows CANE extending further on its early March breakout with a move above 10. The ETF is a bit extended short-term, but in a leading and strong uptrend.
The next chart shows the Wheat ETF (WEAT) with an 80% surge and 22% decline that formed a falling wedge or triangle. The 80% surge is an impulse move and the correction alleviated overbought conditions. The subsequent wedge breakout signaled an end to the correction an a resumption of the bigger uptrend. Volatility is very high here.
Industrial Metal ETFs are Not Far Behind
The DB Base Metals ETF (DBB) and related ETFs are not far behind energy and agriculture. DBB is in an uptrend, but just shy of a new high. The ETF went parabolic with the rest of the commodity world, fell back hard in early March and then rebounded in the second half of March. It is a bit difficult to make sense of the short-term patterns and price gyrations, but the long-term trend is clearly up and the trading bias is bullish. Short-term, we have a surge and consolidation (pennant). This is a short-term bullish continuation pattern and a breakout would be bullish.
Volatility is the challenge here because we could see a pennant breakout followed by a frustrating dip below the pennant lows. While this would seem short-term negative, it would not affect the long-term uptrend. In fact, a dip to the 24.5 area would provide a mean-reversion setup (pullback within uptrend). Even short-term traders need to give ETFs with high volatility some wiggle room to present pre-mature exits. Note that I am not predicting a failed breakout. Instead, I am showing a future possibility to considering when planning a trade. What would you do if…?
Copper provides a great example of short-term patterns, volatility and pre-mature exits. A pennant formed in late March and there was a breakout, but the breakout failed as CPER fell below the pennant low. This, however, was not enough to derail the bigger uptrend and was just part of the new volatility regime. Last week’s dip below 28 became another short-sharp pullback within a choppy uptrend.
Agribiz and Steel Follow Ag and Industrial Metals
The Agribusiness ETF (MOO) and the Metals & Mining SPDR (XME) are also leading the market with new highs in the last few days. We also have short-term pennant breakouts that could become victim to short-term volatility. The first chart shows MOO with a pennant breakout last week and this breakout is holding. A volatility dip to 102 would suggest a failure, but not affect the long-term uptrend and also lead to the next mean-reversion setup. The second chart shows XME with similar characteristics.
Aerospace & Defense ETFs Doing the Flag Thing Too
The Aerospace & Defense ETFs (ITA/PPA) are also doing the flag dance with recent breakouts that could fail, but not affect the bigger breakouts and uptrends. The first chart shows ITA with a new high in March and falling flag into April. The ETF broke out of the flag last week and is just above the breakout zone. Forecasting short-term fluctuations is a challenge and we could even see a dip to the 108 area. Again, this would seem like a failed breakout, but it would not affect the bigger uptrend and would lead to a mean-reversion setup (short-term pullback within uptrend).
Precious Metal ETFs Hold Breakouts
The Gold SPDR (GLD), Silver ETF (SLV) and Palladium ETF (PALL) have similar charts with big breakout moves in February, pullbacks into March and breakouts in April. The first chart shows GLD with a breakout surge (+16%) and a 50-67 percent retracement of this surge with a decline back to the breakout zone. A falling wedge formed and GLD broke out on April 8th.
Keep this setup in mind: big advance, ~50 percent retracement of advance, falling wedge/channel pattern and return to breakout zone. This is a classic bullish continuation setup and the breakout signals a continuation of the bigger uptrend. Some setups will fail, but I think this setup works over time (100s of trades). The next chart shows SLV with a similar setup.
The Palladium ETF (PALL) is like silver on Red Bull, the energy drink. Note that silver is like gold on Red Bull so this mean PALL as twice as much Red Bull than gold. ‘Tis enough to make one jittery so lay off the Red Bull if trading palladium. PALL has a similar chart with much bigger swings and much more volatility.
Residential REIT ETF Stays within Flag
The Residential REIT ETF (REZ) broke out of a falling wedge in March and advanced to its early January high. The ETF did not hit a new high and consolidated just below the January high. A bull flag is taking shape and a breakout would be bullish. It is also possible that a cup-with-handle is taking shape, which is a larger bullish continuation pattern. The only negative for this setup is the broad market environment (bearish, defensive, risk-off).
Strategic Metals ETF Hits Potential Reversal Zone
The Strategic Metals ETF (REMX) broke out of a channel correction and surged to a new high in March. The ETF then fell back quite hard as it returned to the breakout zone and retraced 50-67 percent of the surge. This is a potential reversal zone and the ETF firmed the last few days. A break above last week’s high would trigger a short-term reversal.
Uranium ETF Maintains Uptrend
The Uranium ETF (URA) fell 3.1% on Monday, but this is not unusual given market volatility and the volatility of the ETF. Overall, it remains one of the stronger ETFs because it broke out in early March and continued higher after the breakout. Last week’s high was a new high for the current move.
You can learn more about my chart strategy in this article covering the different timeframes, chart settings, StochClose, RSI and StochRSI.
")