")
After a big surge in the second half of March, stocks fell back this week as the S&P 500 declined around 2%. This modest decline is warranted after the March surge, but it was not enough to push sentiment to an extreme. The AAII Bears are back above 40%, but two other sentiment indicators barely budged. Let’s investigate.
The chart below shows three sentiment indicators: AAII Percent Bears, the VIX and the Put/Call Ratio. I like to use more than one indicator to get a consensus of sorts and an odd number of indicators to have a clear bias. Sentiment tells us when there is excessive bearishness or fear in the stock market. Typically, we should be on alert for a bounce when there is too much bearishness or fear. Personally, I have not found sentiment indicators good at calling tops or foreshadowing weakness.
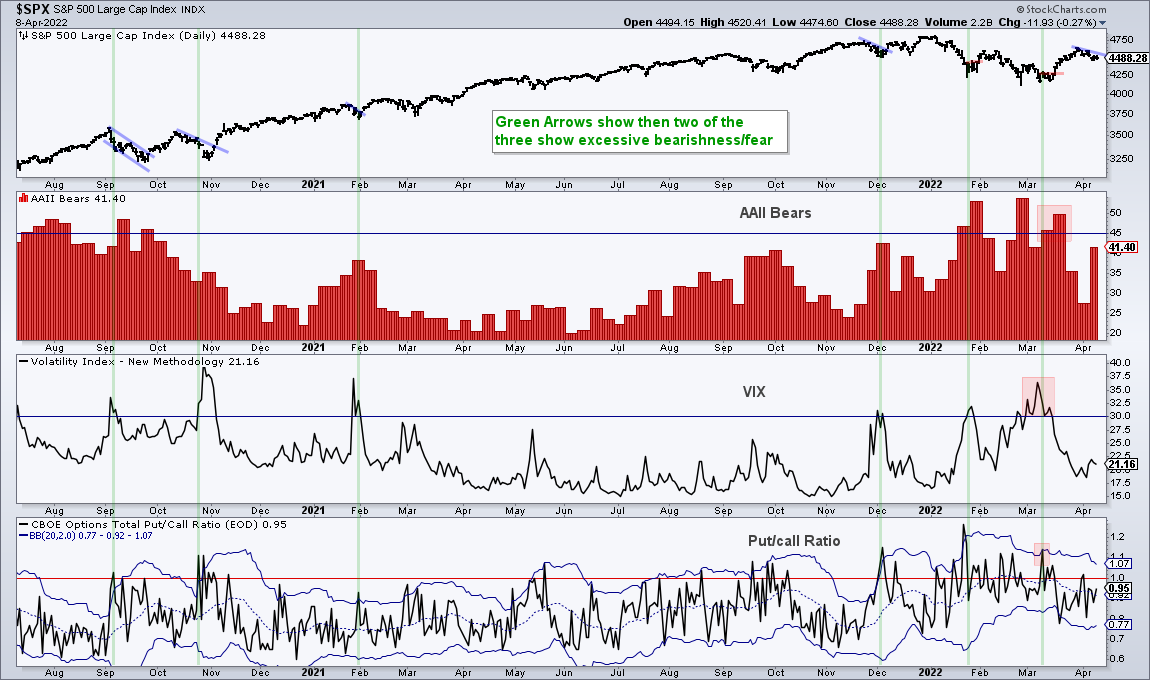
The AAII Bears and VIX settings are pretty straight forward. AAII percent bears signals excessive bearishness when above 45% and VIX signals excessive fear when above 30. Identifying excess with the Put/Call Ratio is more nuanced. A move above 1 signals more put volume than call volume and this shows some bearish excess. Similarly, a move above the upper Bollinger Band shows a short-term increase in put volume. The latter is my preferred measuring stick. The green lines on the chart show when two of the three indicators are signaling excess that could lead to a bounce.
None of the indicators are signaling an extreme just yet. AAII Bears surged this week and is at 41.40%. The VIX is still well below 30 and the Put/Call Ratio is nowhere close to its upper Bollinger Band. Keep in mind that sentiment is just one piece of the analysis puzzle. Extremes serve as an alert to be vigilant for a short-term bounce and we should then turn to the price charts for a setup or signal.
This week at TrendInvestorPro I covered the reversal zones for SPY and QQQ, the breakdowns in some key groups and the ETFs that are truly leading the market. These were covered with a long written report and a comprehensive video. Click here for immediate access.
In this week’s video (here), I compared the performance of defensive groups and offensive groups, showed how to use the Momentum Composite to identify oversold setups within an uptrend and analyzed three sentiment indicators.
The Trend Composite, Momentum Composite, ATR Trailing Stop and eight other indicators are part of the TIP Indicator Edge Plugin for StockCharts ACP. Click here to take your analysis process to the next level.