")
It is not pretty out there. The Composite Breadth Model is bearish and yield spreads are rising. We are also seeing large-techs (QQQ) and small-caps (IWM) lead the broader market lower. Selling pressure intensified with lopsided down days on Friday and Tuesday. Basically, there were two -80% down days in each of the major indexes. We used to be able to hide out in defensive groups and commodities, but even these were hit over the past week. It is one tough market right now. Nevertheless, I will endeavor to bring forward some bullish setups in ETFs that are perhaps less correlated to the stock market.
About the ETF Trends, Patterns and Setups Report
This report contains discretionary chart analysis based on my interpretation of the price charts. This is different from the fully systematic approach in the Trend Composite strategy series. In this ETF Trends, Patterns and Setups report, I am looking for leading uptrends and tradable setups within these uptrends. While I use indicators to help define the trend and identify oversold conditions within uptrends, the assessments are mostly based on price action and the price chart (higher highs, higher lows, patterns in play). Sometimes the chart assessment can be at odds with the indicators.
Sad News and Scheduling
The report schedule for the next ten days will be a bit different because I am attending a family funeral. My mother (85) had a sudden heart attack on Easter Sunday evening and passed away the following Monday. Fortunately, we had a family zoom on Easter morning and saw her in good spirits. I am working in the US for now and will publish Market/ETF Reports before 10PM ET on the following dates:
- Thursday, April 28
- Sunday, May 1
- Wednesday, May 4
- Thursday, May 5
Downside Participation Expands
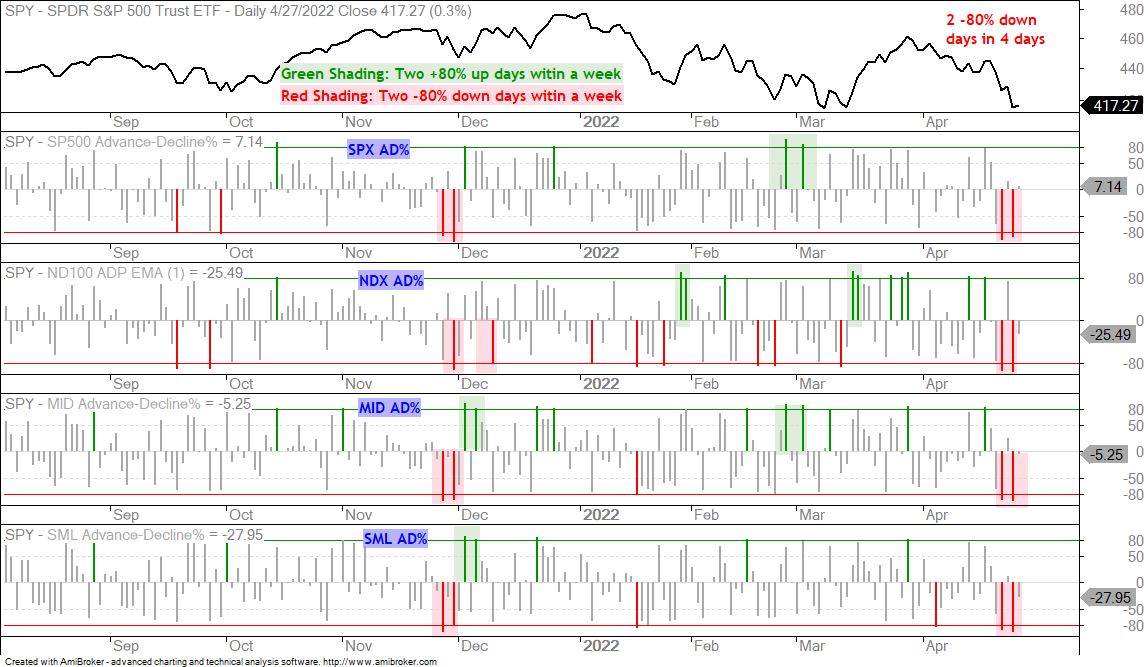
As noted on Sunday, the big concern with last week’s selling pressure was that the leaders were hit hard. This showed perhaps a new phase and broadening participation to the downside. The next chart shows Advance-Decline Percent for the S&P 500, Nasdaq 100, S&P MidCap 400 and S&P SmallCap 600. AD% = %Advances less %Declines. A move above +80% means more than 90% of issues advanced (broad upside participation). A move below -80% means more than 90% of stocks declined (broad downside participation). The green shading shows when there are two +80% days within a week and the red shading shows when there are two -80% days within a week. These are bullish and bearish breadth thrusts. The chart shows that there were two -80% down days within the past week for each index and this shows broadening downside participation. There are fewer places to hide within the stock market as more groups and stocks succumb to selling pressure.
With the Composite Breadth Model bearish, downside participation broadening and yield spreads widening, stocks and stock-related ETFs are not the place to be. As noted on the Market Regime page, BBB spreads widened significantly and this shows stress in the credit markets, which is negative for stocks. There may be some groups that buck the selling pressure, but a stock is a stock and most stocks are affected by the broad market environment. This includes defensive groups, such as Utilities, Healthcare and Consumer Staples. Even groups tied to commodities came under selling pressure. Be careful out there.
SPY is in a Downtrend
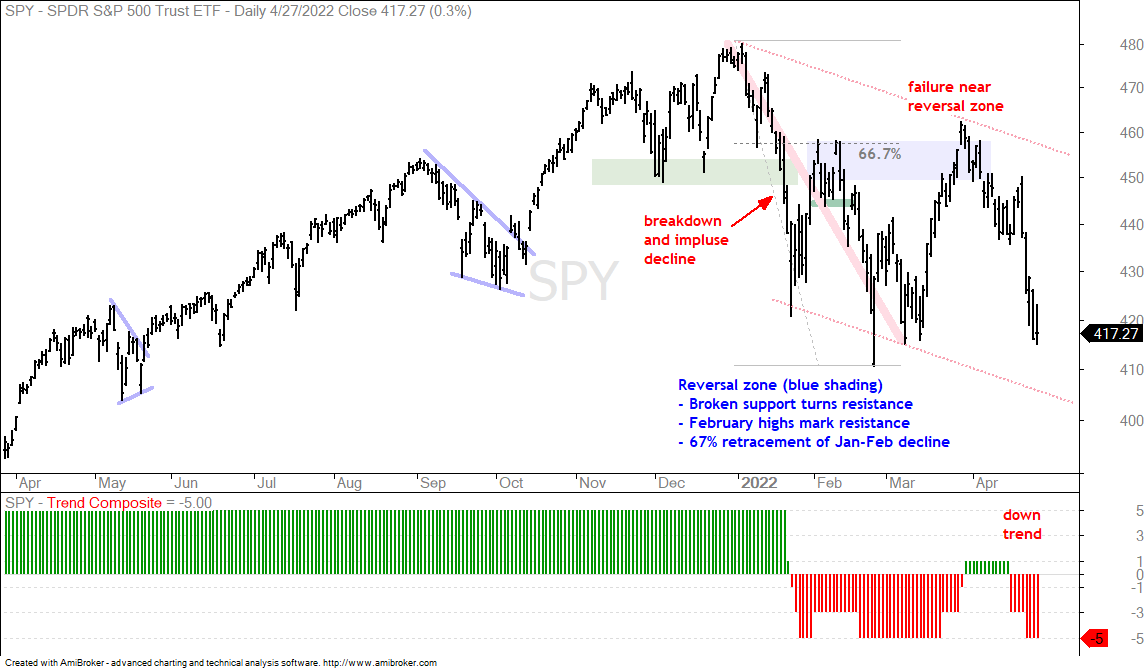
The S&P 500 represents large-caps and the most widely followed benchmark for US stocks. It is in a downtrend and this is a headwind for other stocks and stock-related ETFs. On a closing basis, SPY closed below its March closing low and this represents a lower high, to go along with the lower high from January to late March. The red dotted lines show a possible falling channel with the lower line extending to the 405 area.
You can learn more about my chart strategy in this article covering the different timeframes, chart settings, StochClose, RSI and StochRSI.
QQQ is Leading Lower
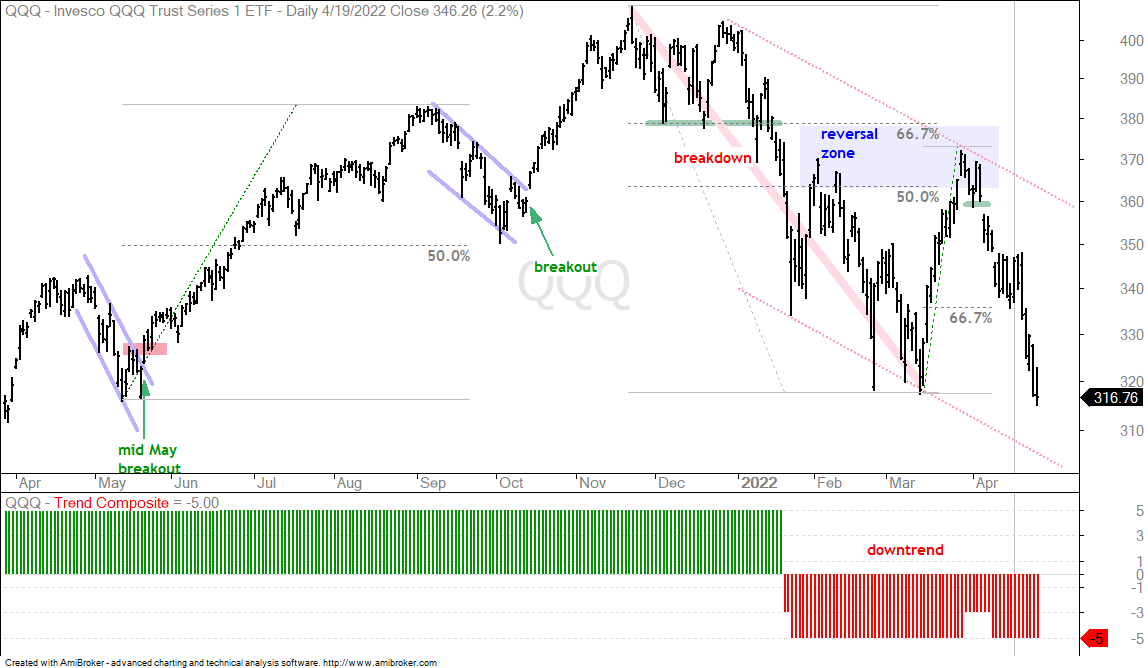
The Nasdaq 100 ETF (QQQ) is leading the way lower with a move below the March lows this week. The decline was swift and QQQ is short-term oversold, as is SPY. This may give way to an oversold bounce, but it is not my type of setup because the bigger trend is down. The red dotted lines show a falling channel with the lower line extending to the 305 area.
Small-caps are the Weakest of All
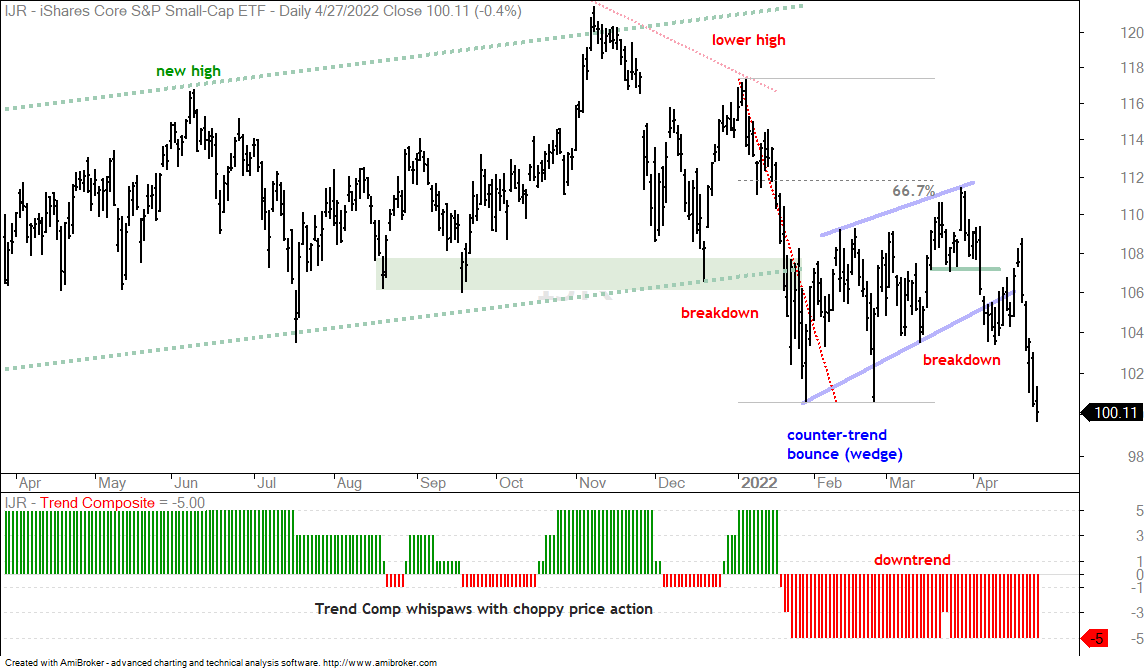
The S&P SmallCap 600 SPDR (IJR) is weaker than SPY and QQQ. The ETF broke down in January, formed a rising wedge for a counter-trend bounce, broke wedge support to signal a continuation lower and hit a 52-week low this week. 52-week lows occur in strong downtrends and show relative weakness. Small-caps and large-techs represent the high beta trade and relative weakness in these two groups shows risk-OFF in the markets right now.
You can learn more about exit strategies in this post,
which includes a video and charting options for everyone.
ETFs that are Oversold within Uptrends
There are a few stock-related ETFs that are still in uptrends and became short-term oversold over the last few days. These include PPA, ITA, IFRA, REZ and USMV. There are also a handful of non-stock ETFs in uptrends and short-term oversold. These include GDX, SLV and CPER. Just because something is short-term oversold and in a long-term uptrend does not mean this is a sure thing trade. Sometimes stocks and ETFs become oversold and remain oversold as downtrends extend. We also need to be very careful because the Market Regime is bearish, which means stock-related ETFs carry above average risk. I gravitate towards non-stock ETFs when the market regime is bearish. This used to mean the 20+ Yr Treasury Bond ETF (TLT), but bonds are in a strong downtrend. Thus, the only alternatives are commodities and currencies. The Dollar is very strong.
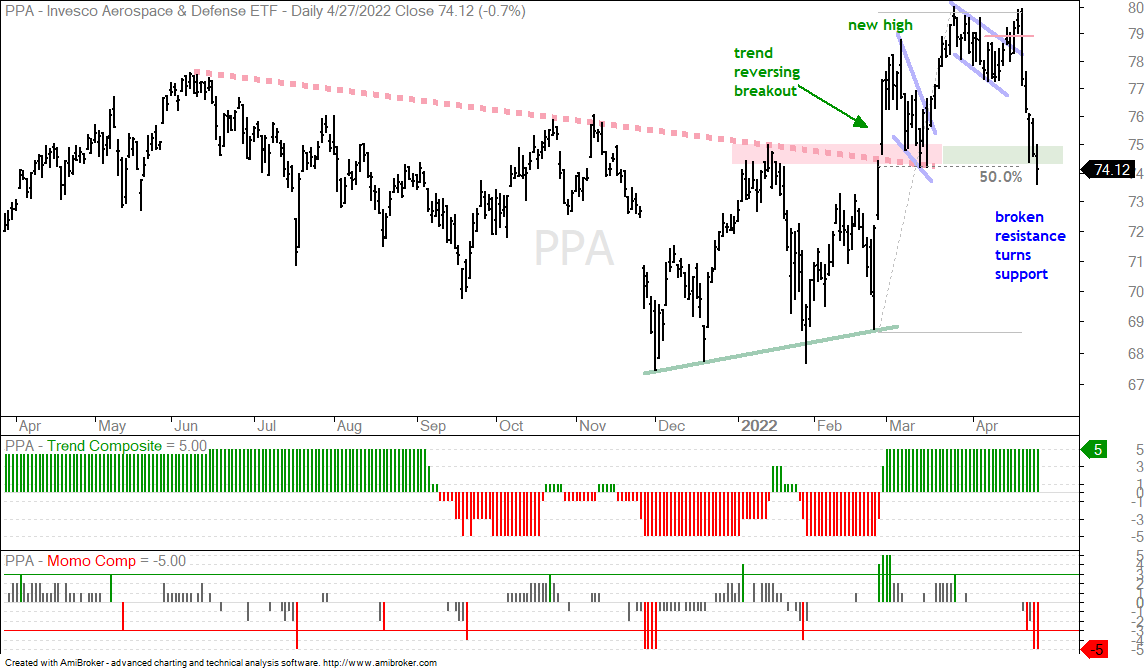
Of the stock-related ETFs, I will single out the Aerospace & Defense ETF (PPA) because it is an industry group with a secular theme (increase in defense spending) and PPA is in an uptrend (Trend Composite positive). The green arrows on the chart show when the Momentum Composite dips to -3 or lower for reference (short-term oversold). Currently, the Momentum Composite is at -5, which means all five indicators are oversold. The ETF is also near broken resistance, which turns support, and the 50% retracement line. This is an area to watch for a short-term reversal or bounce. Unfortunately, I do not see a bullish continuation pattern because the decline over the last five days was quite sharp. Sometimes the market does not give us and ideal setup.
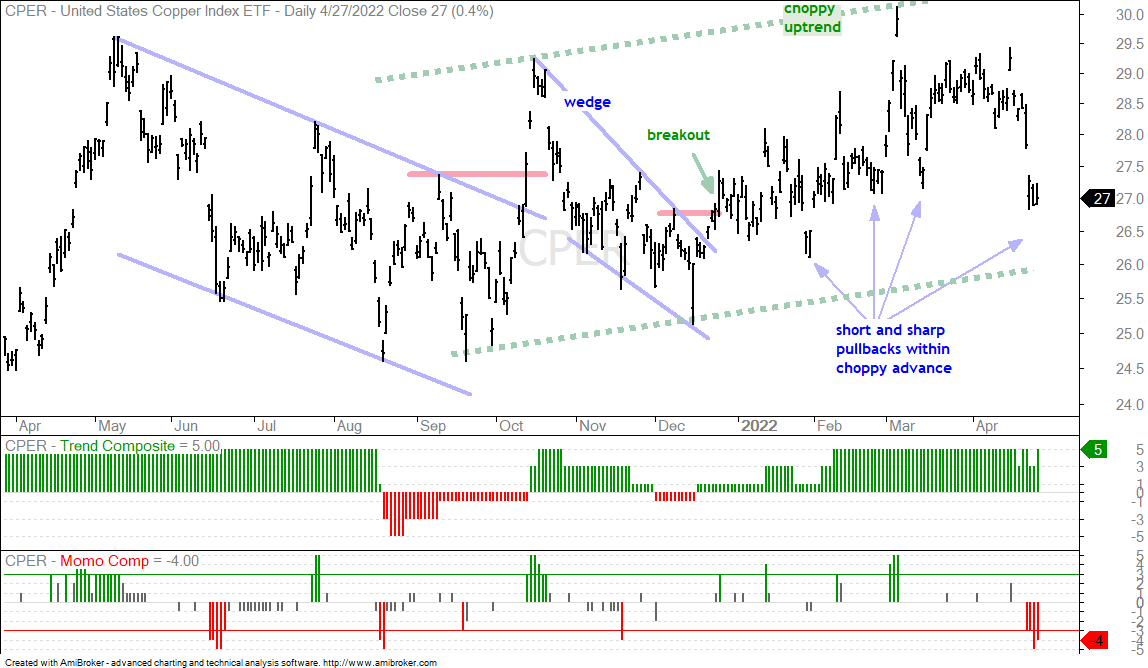
Of the alternative ETFs, I will single out the Copper ETF (CPER). Notice that CPER was short-term oversold four days ago and fell sharply again the next day. Overall, CPER is in a choppy uptrend and the pullbacks have been quite violent during this uptrend. This pullback is no exception because CPER fell some 7% in as many days. The Momentum Composite hit -3 four days ago, -5 on Tuesday and -4 on Wednesday. CPER is oversold within an uptrend and the trade here is for an oversold bounce. Again, I do not see a short-term bullish pattern (flag, wedge) because the decline was so sharp.
The Trend Composite aggregates trend signals in five trend-following indicators: 5-day ROC of 125-day SMA, Bollinger Bands (125,1), Keltner Channels (125,2,125), CCI (125) based on Closing Prices and StochClose (125, 5). You can learn more about the Trend Composite here.
The Trend Composite is part of the TIP Indicator Edge Plugin for StockCharts ACP
DBB Becomes Oversold
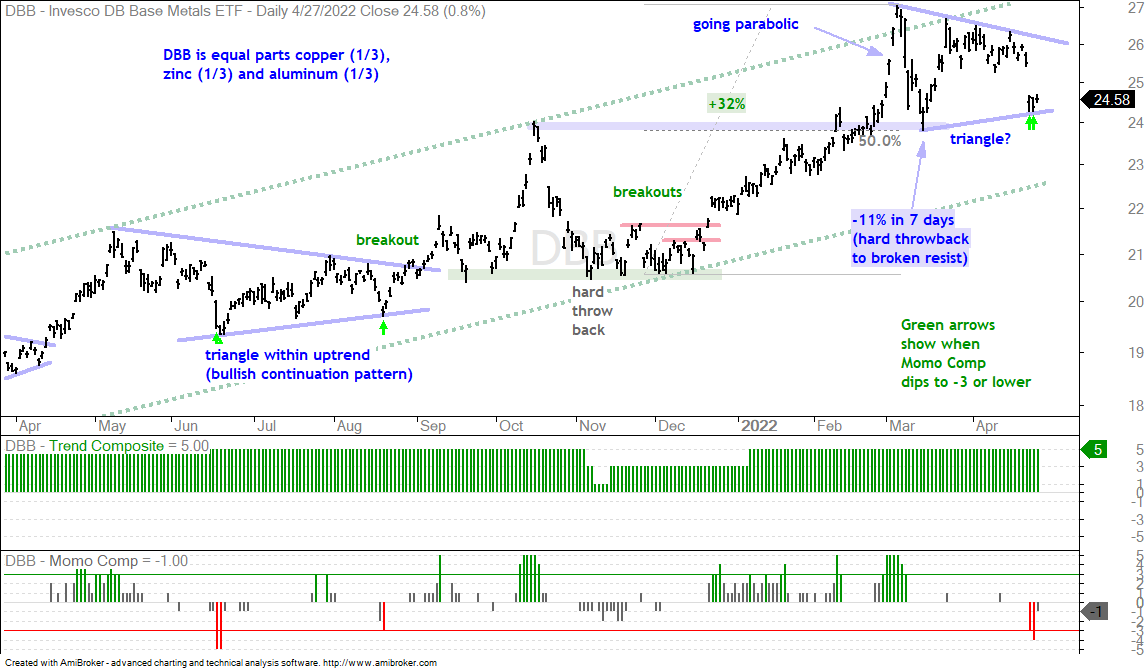
The next chart shows the DB Base Metals ETF (DBB) falling sharply last Friday and then firming the last two days. I was watching a bullish pennant, but this did not work out after the sharp decline. The overall trend is still up with the Trend Composite at +5. DBB is just succumbing to a little volatility, or rather a lot of volatility, which seems to be running rampant right now. Even though DBB has yet to bounce, a bigger triangle is still possible here. Keep in mind that DBB was up 32% from early December to early March and is entitled to a consolidation (rest). DBB caught my eye because the Momentum Composite dipped to -3 and -4 to become oversold within an uptrend.
Palladium Wins the Volatility Prize
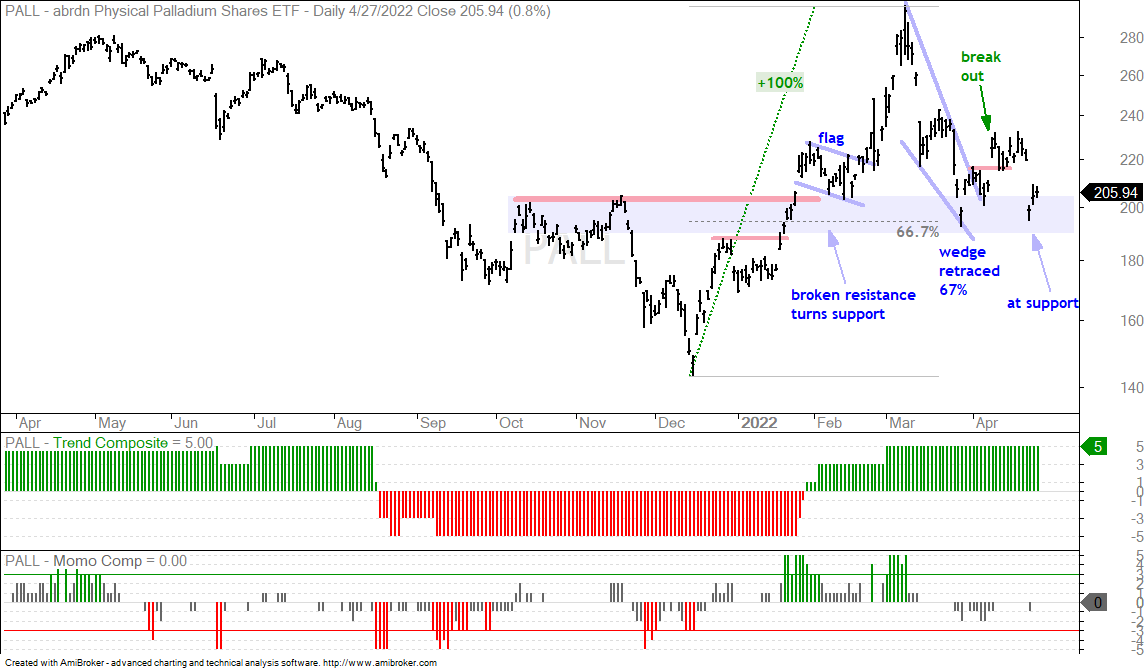
The Palladium ETF (PALL) has taken volatility to a new level with a 13% pop/breakout and a 13% decline that gave it back. This one is all over the place, but still bullish because the Trend Composite is positive. Even though the wedge breakout did not hold and this is concerning, the ETF is at support and industrial metals are strong overall. I don’t see a setup other than at support in an uptrend. The Momentum Composite only dipped to -2 and did not become oversold. However, we do not need an oscillator to figure out something is short-term oversold after a 13% decline. Thus, PALL is oversold, at support and in an uptrend. Careful here because volatility is through the roof.
Prior Report and Video
Sunday’s Report Included the Following:
- The Benefits of a Systematic Approach
- Selling Pressure Broadens within the Stock Market
- SPY with Lower Lows and Lower Highs this Year
- QQQ Fails to Break Out
- Weight of the Sector/Group Evidence is Bearish
- Defensive ETFs Take a Hit
- Aerospace & Defense ETFs Take Big Hits
- Oil Remains with Upswing in Bullish Consolidation
- Energy Related ETFs Act Like Stocks
- MOO, XLB and XME Act More Like Stocks
- Base Metals Hold Up, but Copper Gets Hit
- DB Agriculture ETF and Related ETFs in Uptrends
- Gold Falls Back and GDX Plunges
- Uranium ETF Falls with Market
You can learn more about my chart strategy in this article covering the different timeframes, chart settings, StochClose, RSI and StochRSI.