There are often crosscurrents in the market and these can create confusion. For example, the Trend Composite for SPY is positive, but the 5-day SMA is below the 200-day SMA. On the price chart, SPY appears to be in a downtrend in 2022, but there is a short-term bullish setup after a two week decline. It is times like these that we need to have a strategy and stick to that strategy.
My strategy is to focus on leading uptrends and trade in the direction of the bigger trend. This means avoiding ETFs that are in downtrends and ETFs that are lagging. So, while I see some short-term bullish setups with the April declines, I am not considering these because they do not fit my strategy. SPY and IGV, which are highlighted below, are not in leading uptrends and do not make the cut.
This report contains discretionary chart analysis based on my interpretation of the price charts. This is different from the fully systematic approach in the Trend Composite strategy series. In this report, I am looking for leading uptrends and tradable setups within these uptrends. While I use indicators to help define the trend and identify oversold conditions within uptrends, the assessments are mostly based on price action and the price chart (higher highs, higher lows, patterns in play). Sometimes the chart assessment can be at odds with the indicators.
SPY versus the Broader Market
SPY is holding up the best of the broad market ETFs, but price action in 2022 is more bearish than bullish. Focusing purely on the price chart, I see a strong decline from January to March and a strong bounce that retraced around 2/3 of this decline. It is confusing because both the decline and the bounce were strong. Nevertheless, SPY failed in the blue reversal zone marked by broken support, the February highs and the 2/3 retracement line. There was an overshoot on the upside, but this is the area where one would expect a counter-trend bounce to fail. I am working under the subjective assumption that January-March decline signaled the start of a downtrend and the March bounce was a counter-trend move within this bigger downtrend.
This assumption, however, is not as subjective as it may seem. As noted over the last two weeks, I have a bearish bias because of extenuating factors. These include a bearish Composite Breadth Model, weakness in the percentage of stocks above their 200-day SMAs, leading uptrends in defensive issues and leading downtrends in key groups (tech/semis, finance/banks, housing).
The PerfChart below shows that the Technology SPDR (XLK), Semiconductor ETF (SOXX) Finance SPDR (XLF), Regional Bank ETF (KRE) and Home Construction ETF (ITB) are down over the last three months. Meanwhile, the Utilities SPDR (XLU), Food & Beverage ETF (PBJ), Consumer Staples SPDR (XLP), Healthcare SPDR (XLV) and Dividend ETF (DVY) are up. It is not so much that defensive groups are leading. The problem is that key offensive groups are actually down and weighing.
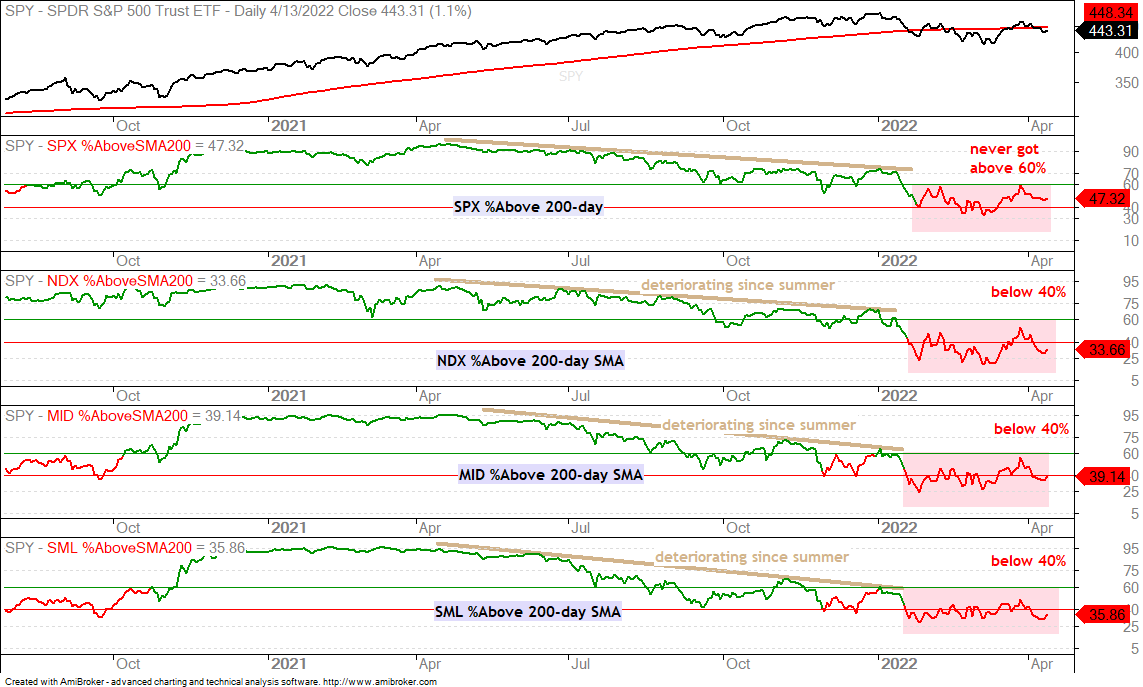
The chart below shows that the percentage of S&P 500 stocks above the 200-day SMA is below 50% and did not exceed 60% on the March surge. %Above 200-day SMA is below 40% for the Nasdaq 100, S&P MidCap 400 and S&P SmallCap 600. These are not bull market numbers.
Long-term vs Short-term
SPY provides a perfect example of the bigger picture conflicting with the short-term setup. The bigger picture is bearish, but there is a short-term bullish setup. Personally, I am ignoring this setup because the broad market environment is bearish. The candlestick chart below shows SPY retracing around half of the March surge with a falling flag decline back to the prior breakout. Thus, we have a potential reversal zone around 440 and a bullish pattern. SPY formed a bullish engulfing on Wednesday and a break above Tuesday’s high (446) would be short-term bullish. Note that there was a similar setup in early December and post-breakout price action was quite choppy.
You can learn more about exit strategies in this post, which includes a video and charting options for everyone.
Materials SPDR is Stronger than SPY
The SPY chart and indicators may be conflicted, but one thing is certain. SPY is not a leading ETF right now. It broke its September-October lows and is some 8% below its January high. There are other ETFs with stronger charts and clearer trends. The next chart shows the Materials SPDR (XLB) with a surge and wedge breakout in March. SPY fell back the last two weeks, but XLB pretty much consolidated with a pennant and held up better. Longer-term, the Trend Composite is 5 (vs 1 for SPY) and the 5-day SMA is 3.88% above the 200-day SMA (vs 1.06% for SPY). XLB is also closer to its January high and all around stronger than SPY. The pennant is a short-term bullish continuation pattern and a breakout would open the door to new highs.
The next chart shows the EW Materials ETF (RTM), which is even stronger than XLB. The Trend Composite has been positive since early November and the 5-day SMA has been above the 200-day SMA for over a year. Medium-term, RTM broke out of a triangle with the March surge and hit new highs at the end of March. Short-term, a falling flag formed into early April and the ETF broke out the last few days.
The Trend Composite aggregates trend signals in five trend-following indicators: 5-day ROC of 125-day SMA, Bollinger Bands (125,1), Keltner Channels (125,2,125), CCI (125) based on Closing Prices and StochClose (125, 5). You can learn more about the Trend Composite here.
The Semiconductor ETF (SOXX) is weighing on the Technology sector as it exceeded its March lows this month. Several tech-related ETFs, in contrast, remained well above the March lows during the April decline (SKYY, FINX, IPAY, IGV). The chart below shows IGV with a 52-week low in mid March and a surge off this low. The Trend Composite has been negative since early December and the bigger trend is down. There is a short-term bullish setup, but this setup runs counter to the bigger downtrend so I will pass. The April decline retraced 50-67% and formed a small wedge. A break above Tuesday’s high would reverse this wedge and signal a continuation of the March surge.
In contrast to IGV and the other tech-related ETFs, the Cybersecurity ETF (CIBR) is in an uptrend and shows upside leadership the last two months. CIBR broke the February high in early March, formed a higher low in mid March and surged above the prior high in late March. The ETF is still well below its 52-week high from November, but prices are zigzagging higher since the early March breakout. Weakness in the technology sector and the broad market environment are the concerns here. For now, CIBR looks bullish as long as it holds above 50.
")