A Medium-term Breadth Indicator Waves the Caution Flag (Free)

The Nasdaq 100 has been on a tear the last few months with a move to new highs, but a medium-term breadth indicator is not keeping pace here in February. This indicator is simply flashing the yellow caution sign right now and we have yet to see an actual signal that would point to a correction. Here’s what to look for.

The chart below shows QQQ in the top window and the percentage of Nasdaq 100 stocks above their 50-day SMA in the lower window. The blue lines show QQQ moving higher, while the yellow dashed lines show participation narrowing in February 2020, early September 2020 and now. This indicator hit 90% in early January and has yet to exceed 75% here in February. Fewer stocks made it back above their 50-day SMAs and this shows some deterioration under the surface.

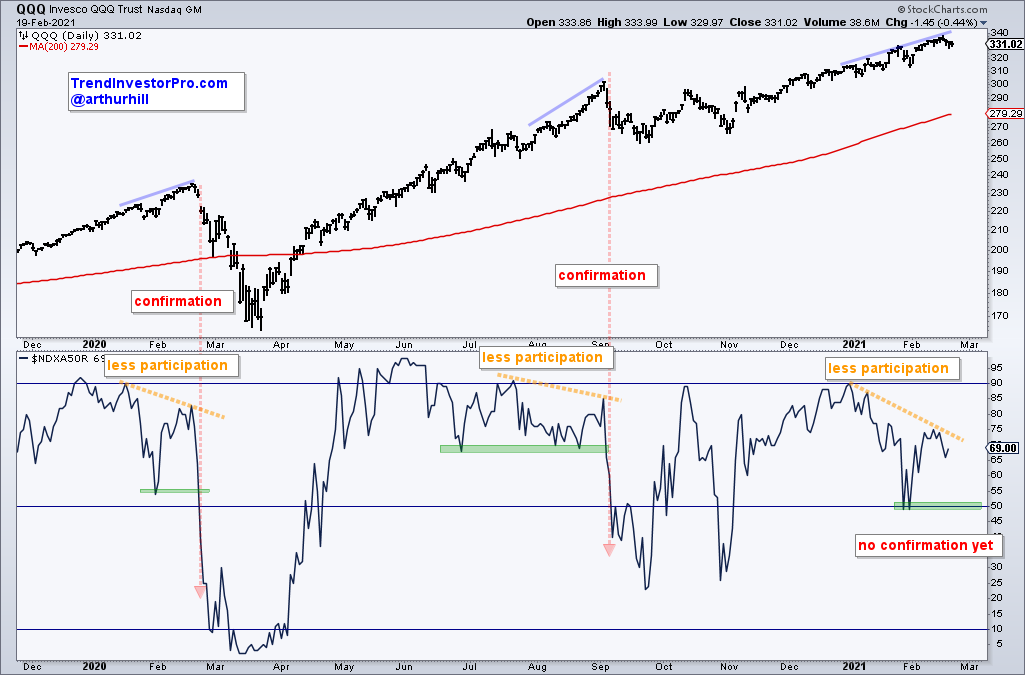
The trouble starts when the indicator moves from less upside participation to more downside participation (less than 50% of stocks above their 50-day SMAs). The red lines show when the indicator fell below the prior low and below 50% in February 2020 and September 2020. The first signal preceded the March crash and the second preceded the September-October consolidation (corrective period).

Currently, the indicator is flashing a caution signal because fewer stocks are above their 50-day SMAs. The green zone around 50 is the level to watch going forward. A break below the late January lows (~50%) would signal that the majority of stocks broke their 50-day SMAs and this could usher in a corrective period for QQQ.

trendinvestorpro.com tracks trend signals and mean-reversion setups for a core group of ETFs and adds broad market timing to stay on the right side of the big trend. Click here to subscribe and get immediate access to our ETF Trends, Patterns & Setups report, Broad Market Timing Strategies and Weekend Video. 

SOXX Follows Overbought Extreme with Outsized Decline

Last weekend’s post showed the Semiconductor ETF (SOXX) with a 10 day overbought streak and several ETFs with even bigger overbought streaks. These streaks came to an end this week as SOXX fell 6.21%, its biggest weekly decline since mid March. As measured by Normalized ROC, this is an outsized decline that argues for at least a corrective period over the next few weeks.

SOXX Follows Overbought Extreme with Outsized Decline Read More »

SOXX and other ETFs with Extended Overbought Conditions

The Semiconductor ETF (SOXX) and several other ETFs are on a serious roll in 2021. For the fourth time since 2009, 14-day RSI was above 70 for ten or more days. This is an exceptional streak, but SOXX is not alone and there are even longer streaks. The following list shows some ETFs and the number of days RSI has been above 70: ROBO (39), DRIV (25), ARKQ (13), EWT (13), MOO (12), XRT (11), SOXX (10), YOLO (10). Note that these numbers are based on Thursday’s close.

SOXX and other ETFs with Extended Overbought Conditions Read More »

A Top or a Mere Correction?

Visual chart analysis is prone to subjectivity and biases. While we cannot completely remove subjectivity, we can approach chart analysis in a systematic fashion and increase objectivity. This commentary will show an example using the Home Construction ETF (ITB) because the ETF has traded flat since mid October. Is this a top or merely a correction?

A Top or a Mere Correction? Read More »

Volatility Contraction in QQQ could Foreshadow an Expansion

The weekly high-low range for the Nasdaq 100 ETF (QQQ) was the narrowest of the year this past week and the ETF is battling triangle resistance. A narrowing range shows indecision and a volatility contraction. Even though this is just one weekly bar, QQQ is at a moment of truth. Will we see a triangle breakout and continuation higher or a failure at resistance and extended correction?

Volatility Contraction in QQQ could Foreshadow an Expansion Read More »

Two ETFs with Market Leading Charts and Fast Growing Industries

New highs and a fast growing industry group make for a powerful combination. Today’s article will focus on two ETFs that capture two fast growing industries, video gaming and esports. We will show why these two ETFs are leading, why a consolidation within an uptrend is bullish and why a 50-day SMA is better suited for mean-reversion trading.

Two ETFs with Market Leading Charts and Fast Growing Industries Read More »

The Setup to Anticipate the Breakout – XME Example

Chartists are often faced with a choice: wait for the breakout or anticipate using a mean-reversion setup. The Metals & Mining SPDR (XME) broke out of a bullish consolidation this week and the breakout signals a continuation of its long-term uptrend. Chartists keying off the mean-reversion setup could have anticipated the breakout and gotten the early jump. Let’s investigate.

The Setup to Anticipate the Breakout – XME Example Read More »

Silver Crosses Turn Dull

There are fewer silver crosses in the major stock indexes and this shows less participation during the last leg higher. A silver cross occurs when the 20-day EMA crosses above the 50-day EMA. DecisionPoint took this concept on step further and developed breadth indicators based on the percentage of stocks with silver crosses. This is a great way to look under the hood and aggregate medium-term trend performance for each index. The chart below shows this indicator for four key indexes: $NDX, $SPX, $MID and $SML. I set the bullish and bearish thresholds at

Silver Crosses Turn Dull Read More »

Trend Composite Turns Fully Bullish for Verizon

Verizon (VZ) participated in the first leg up from late March to mid April, but then stumbled with a decline into mid June. This stumble, however, looks like a classic correction and the stock broke out with a strong move over the last six weeks. In addition, the TIP Trend Composite, which aggregates five trend-following indicators turned positive in early August. Let’s investigate further.

Trend Composite Turns Fully Bullish for Verizon Read More »

Four Stocks Poised to Drive Healthcare Higher

The Healthcare SPDR (XLV) is one of the strongest sectors in 2020. Even though it does not sport the biggest gain, XLV recorded a new high in July and some 80% of its components are above their 200-day EMAs. The new high points to a long-term uptrend and upside leadership, while the percentage of stocks above the 200-day EMA points to broad strength within the sector. Sector SPDRs, however, are only as strong as the sum of their parts (component stocks).

Four Stocks Poised to Drive Healthcare Higher Read More »

Scroll to Top