")
The bigger trend is one of the most important factors to consider when trading stocks or ETFs. We can use trend signals as part of a trend-following strategy or to dictate our trading bias. I look for bullish setups and pullback opportunities when the trend is up. When the trend is down, I am out or looking for bearish setups. In short, I want to trade in the direction of the bigger trend because this is the dominant force at work. May the trend be with you!
There are dozens of trend-following indicators and techniques to define the trend. We never know which indicators will work and when so I devised the Trend Composite to aggregate trend signals in five trend-following indicators. These include the Moving Average Trend, Bollinger Bands, Keltner Channels, StochClose and CCI-Close. The Trend Composite and other indicators are part of the TIP Indicator Edge Plugin for StockCharts ACP (learn more here).
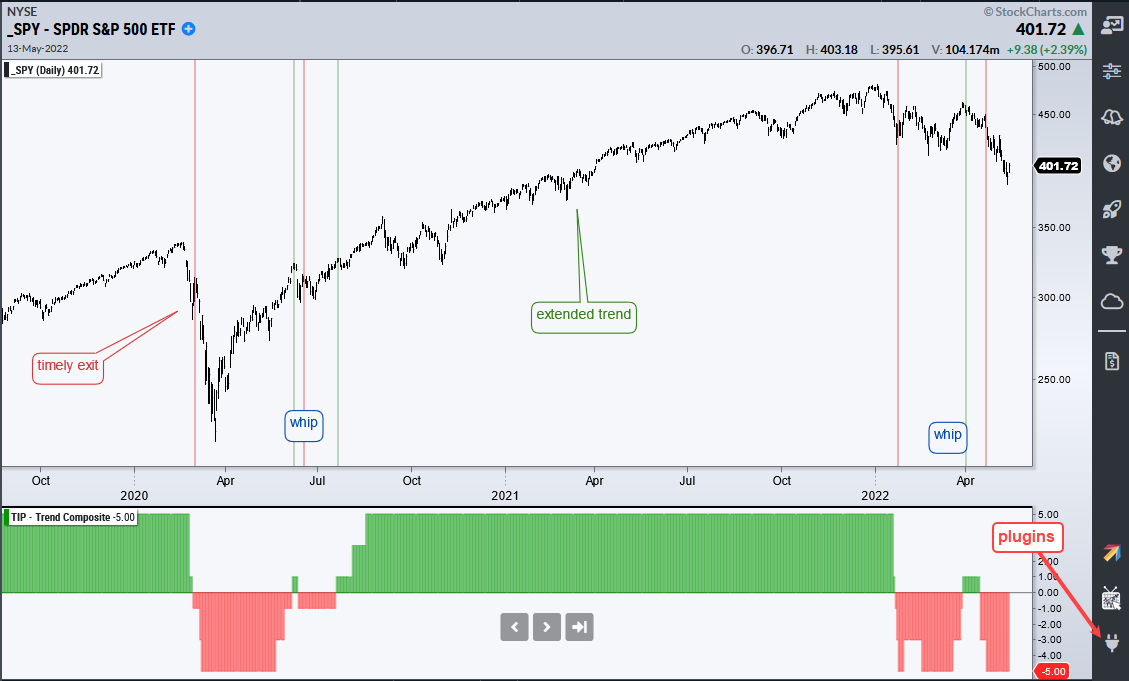
The chart above shows SPY with the Trend Composite generating seven signals since February 2020. This is a typical assortment for trend-following signals because they lag, there are some whipsaws and there is a big trend. The blue annotations show the whipsaws (whip) in June 2020 and late March 2022. Whipsaws and lag are just part of the process needed to catch the big trend, which extended from July 2020 to January 2022.

The chart above shows QQQ with just three signals over this same timeframe. The bearish signal in March 2020 did not catch the top and the bullish signal in May 2020 did not catch the bottom. Even so, the bullish signal in May 2020 lasted until January 2022 and caught a monster trend. Trend-following is built on the assumption that a few good trends (profits) will pay for the losses over time.
The focus at TrendInvestorPro remains on select commodity-related ETFs and defensive ETFs because these are still in uptrends (energy, agriculture, staples, utilities). The Composite Breadth Model has been bearish for a month and most stock-related ETFs in our trend-signal table are in downtrends. Click here for immediate access to the breadth model and trend signal table.
In this week’s video (here), I reviewed the Market Regime using the Composite Breadth Model and yield spreads. I also showed what the “stink” bid might look like when using the percentage of S&P 500 stocks above the 200-day SMA.
The Trend Composite, Momentum Composite, ATR Trailing Stop and eight other indicators are part of the TIP Indicator Edge Plugin for StockCharts ACP. Click here to take your analysis process to the next level.