Traders interested in Treasury bonds, Treasury bond ETFs and yields would be better off ignoring Fed-speak and focusing on the charts. The bond market leads the Fed, not the other way around.
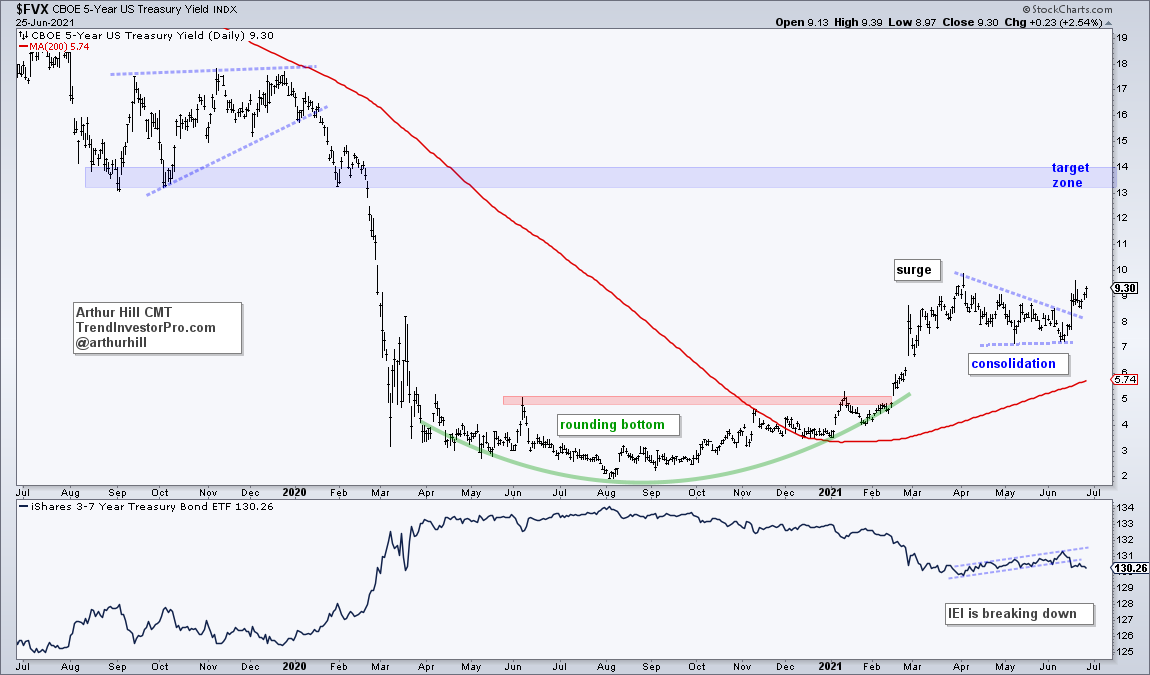
There is a battle raging for the heart and soul of the bond market. In a rare divergence, short-term yields are rising and long-term yields are falling. As a result, the difference between the two is narrowing and the yield curve is flattening. The first chart shows the 5-yr yield surging from late February to early April, consolidating into June and breaking out of this consolidation. The breakout signals a continuation of the bigger uptrend and higher short-term yields are expected. A rising 5-yr yield would be bearish for the 3-7 Yr Treasury Bond ETF (IEI).
The next chart shows the 10-yr yield with a long basing process from April 2020 to December 2020 and a breakout at the beginning of 2021. The yield surged above 1.7% (17 on chart) and then fell back with a falling channel. The 5-yr yield is breaking out, but the 10-yr yield is within its falling channel. Nevertheless, this channel is viewed as a correction within a bigger uptrend. This is also a bullish continuation pattern and a breakout at 16.5 (1.65%) would signal an end to this correction. I would then target a move toward the 2% area. A breakout and move higher in the 10-yr yield would be bearish for the 7-10 Yr Treasury Bond ETF (IEF).
This analysis continues for subscribers (here) as we look at the yield curve, the Regional Bank SPDR, the breakout in the Junk Bond ETFs and the effect on small-caps. Click here to subscribe.
")