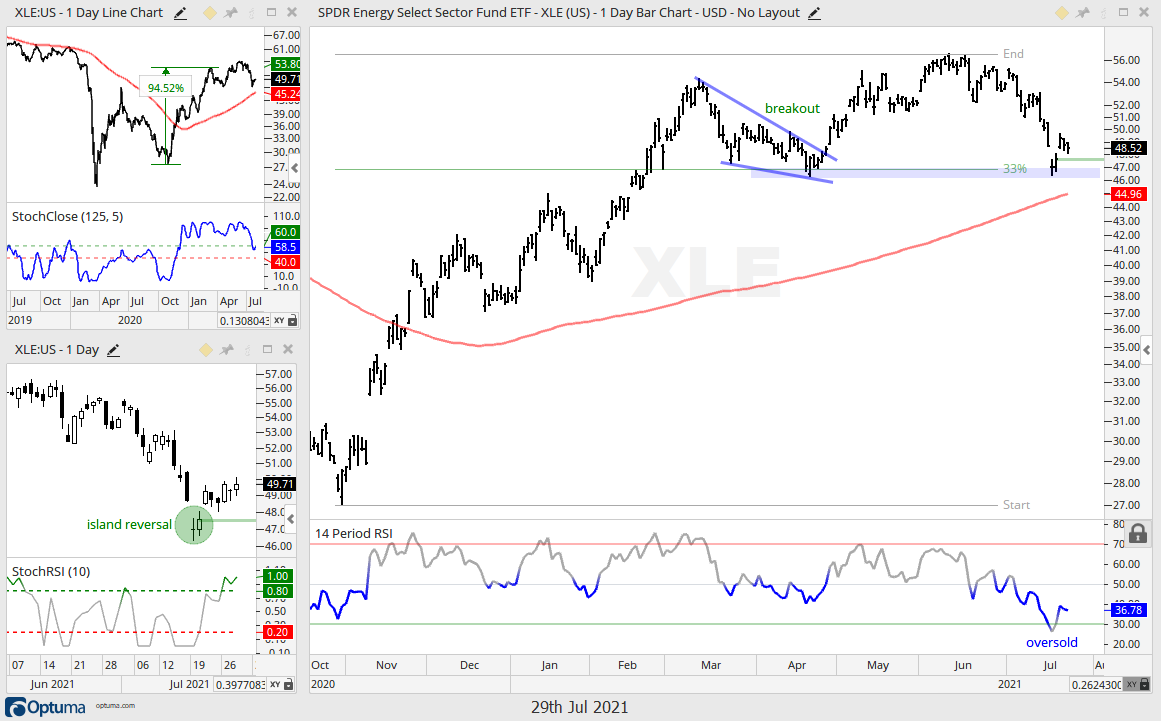
The Energy SPDR (XLE) is setting up to end its correction and resume its bigger uptrend.
First and foremost, the long-term trend is up because the Trend Composite signaled an uptrend (gray circle) in late November when the majority of indicators turned bullish. There are five trend-following indicators in the Trend Composite and all five are currently signaling an uptrend. This indicator, and 10 others, are part of the TIP Indicator Edge Plugin for StockCharts ACP.
The trend is the dominant force at work and we want to look for setups in harmony with this trend. Thus, I am on the hunt for short-term bullish setups and signals when the trend is up. XLE fell some 10% from mid June to mid July and became quite oversold as the Momentum Composite hit -4. There are five indicators in the Momentum Composite and this means four of the five were oversold.
On the price chart, XLE fell to the March-April lows and these levels offered prior support (green shading). Buyers again stepped in as XLE forged an island reversal this week with a gap up (blue oval). A bullish island reversal is a short-term reversal that forms with a gap down, stall and gap up. The two gaps align to create a price island were the bears are trapped with losses.
The combination of an uptrend, oversold conditions, support zone and island reversal suggests that XLE is ripe for a bounce and continuation of the bigger uptrend. This week’s lows mark support and a close below these lows would argue for a re-evaluation.


